-
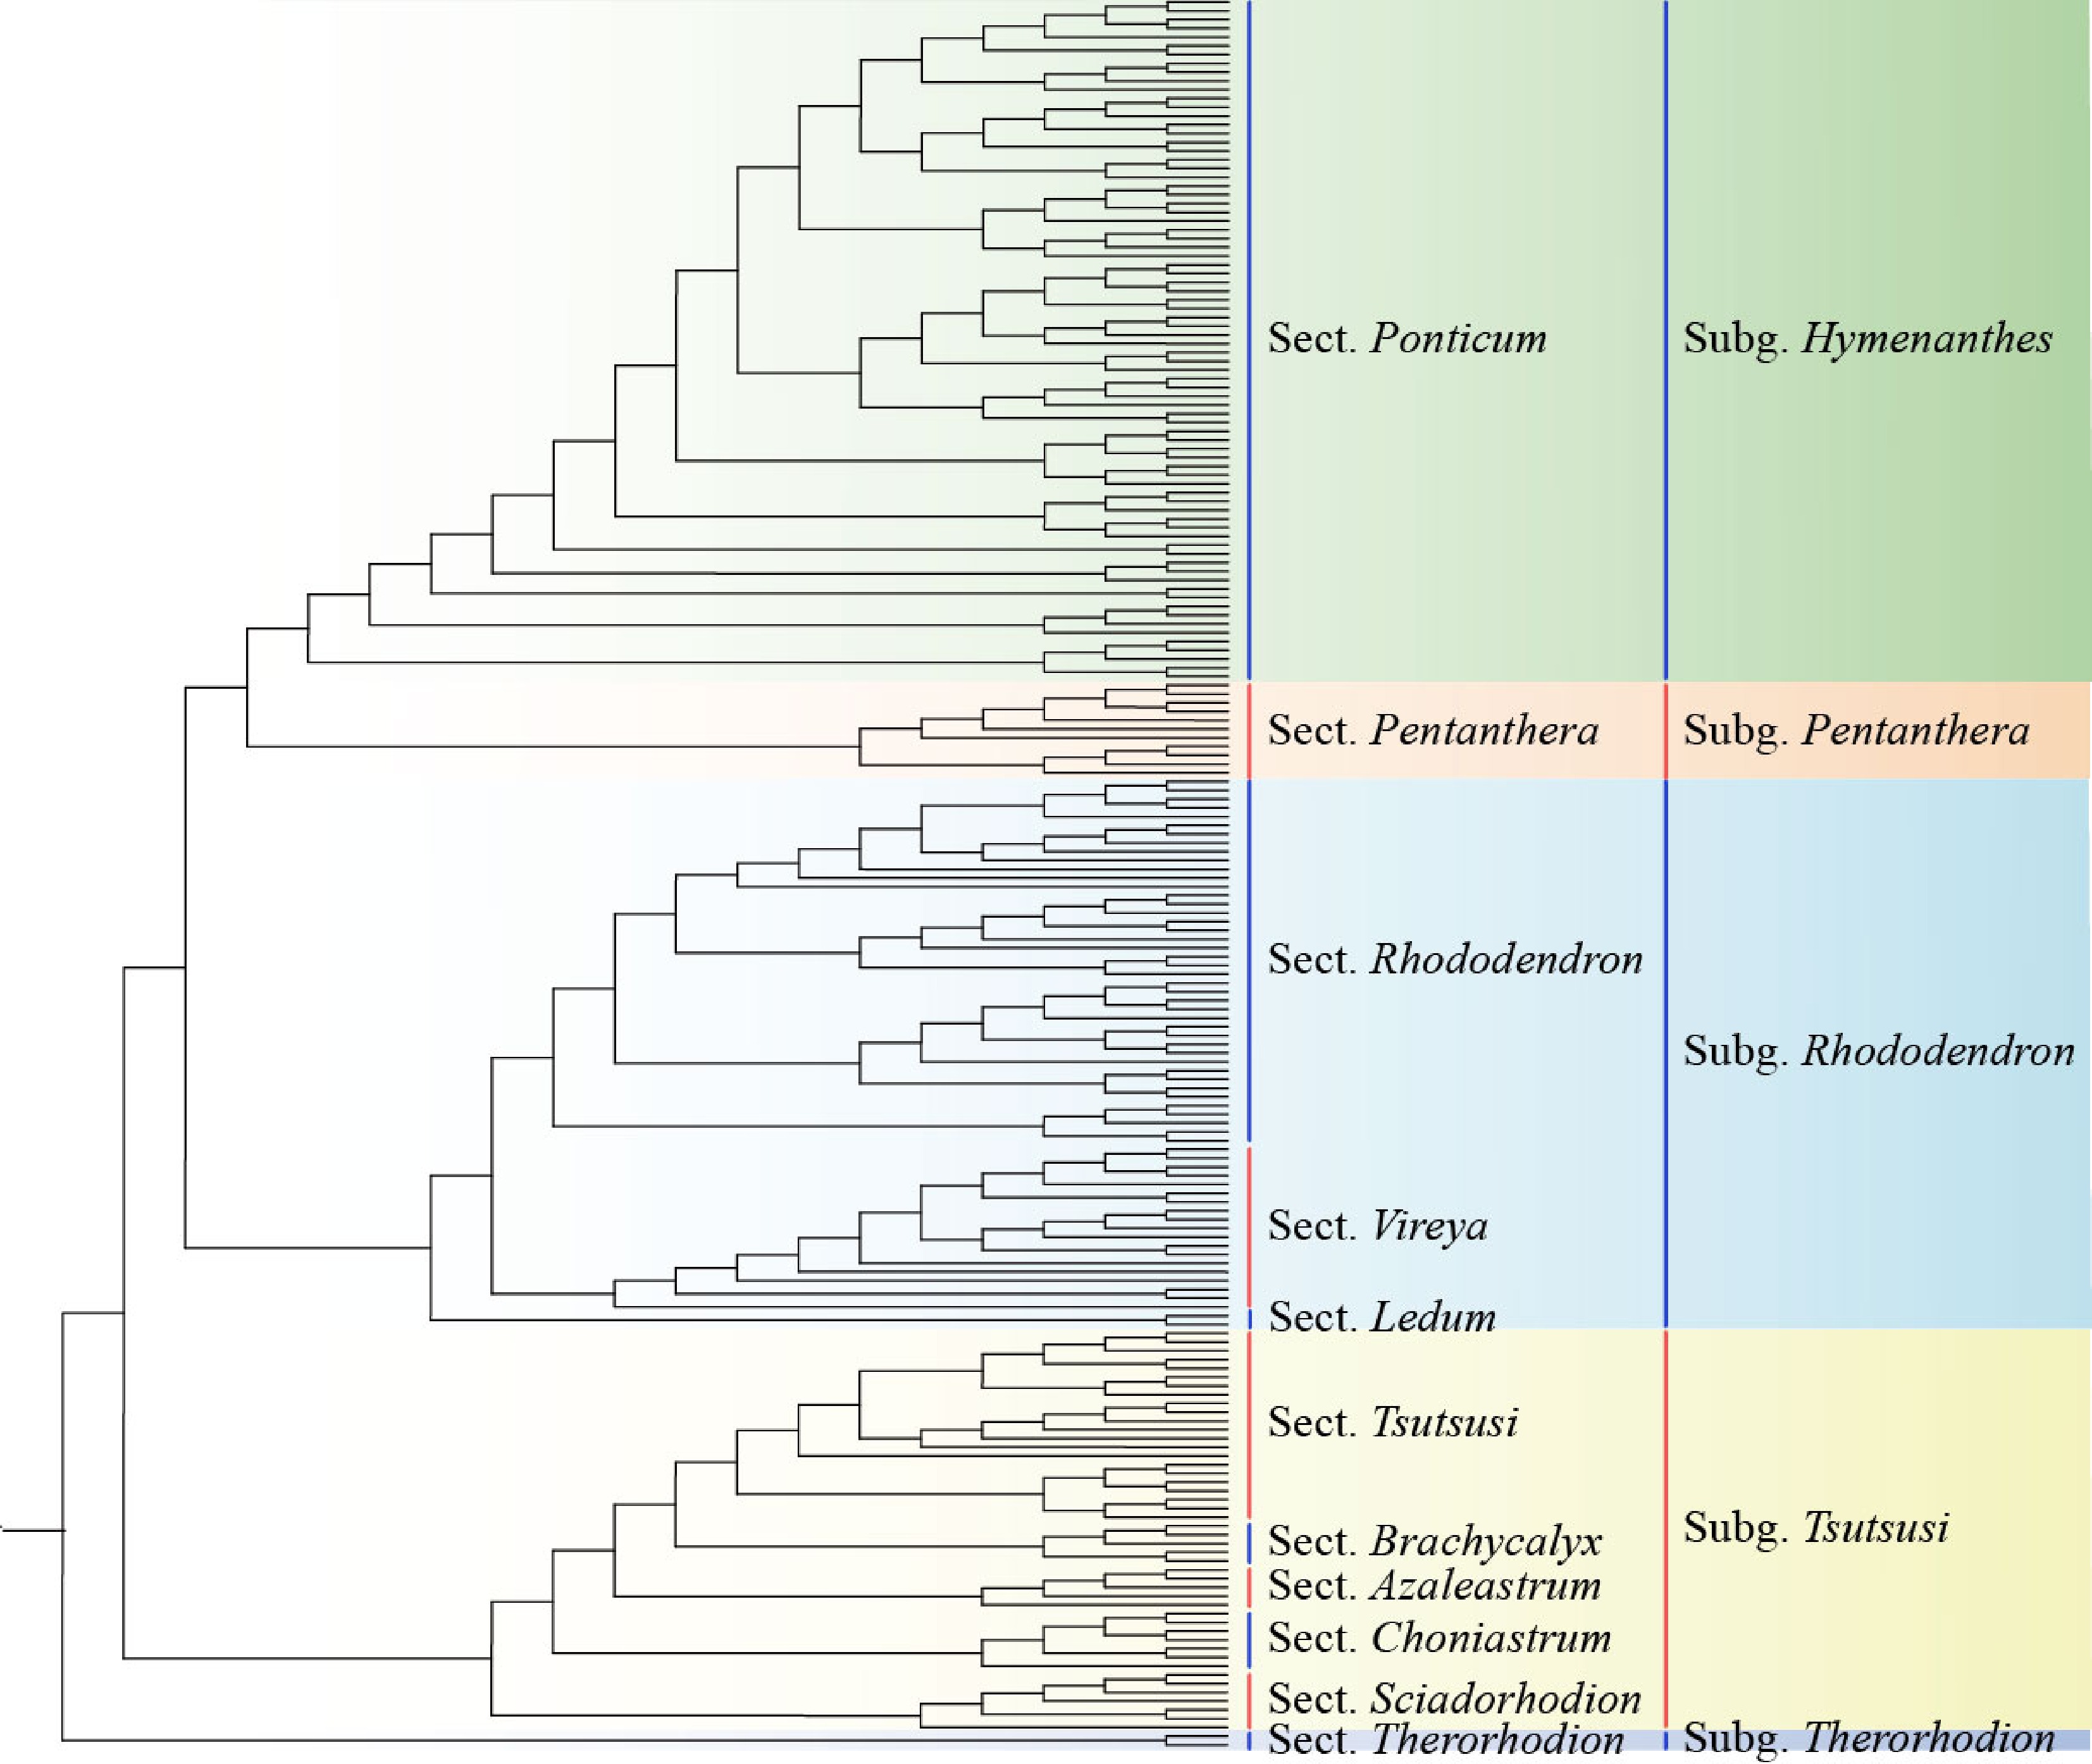
Figure 1.
Phylogenetic reconstruction in Rhododendron L. Sect., Section; Subg., Subgenus. (Modified from a previous publication[4]).
-
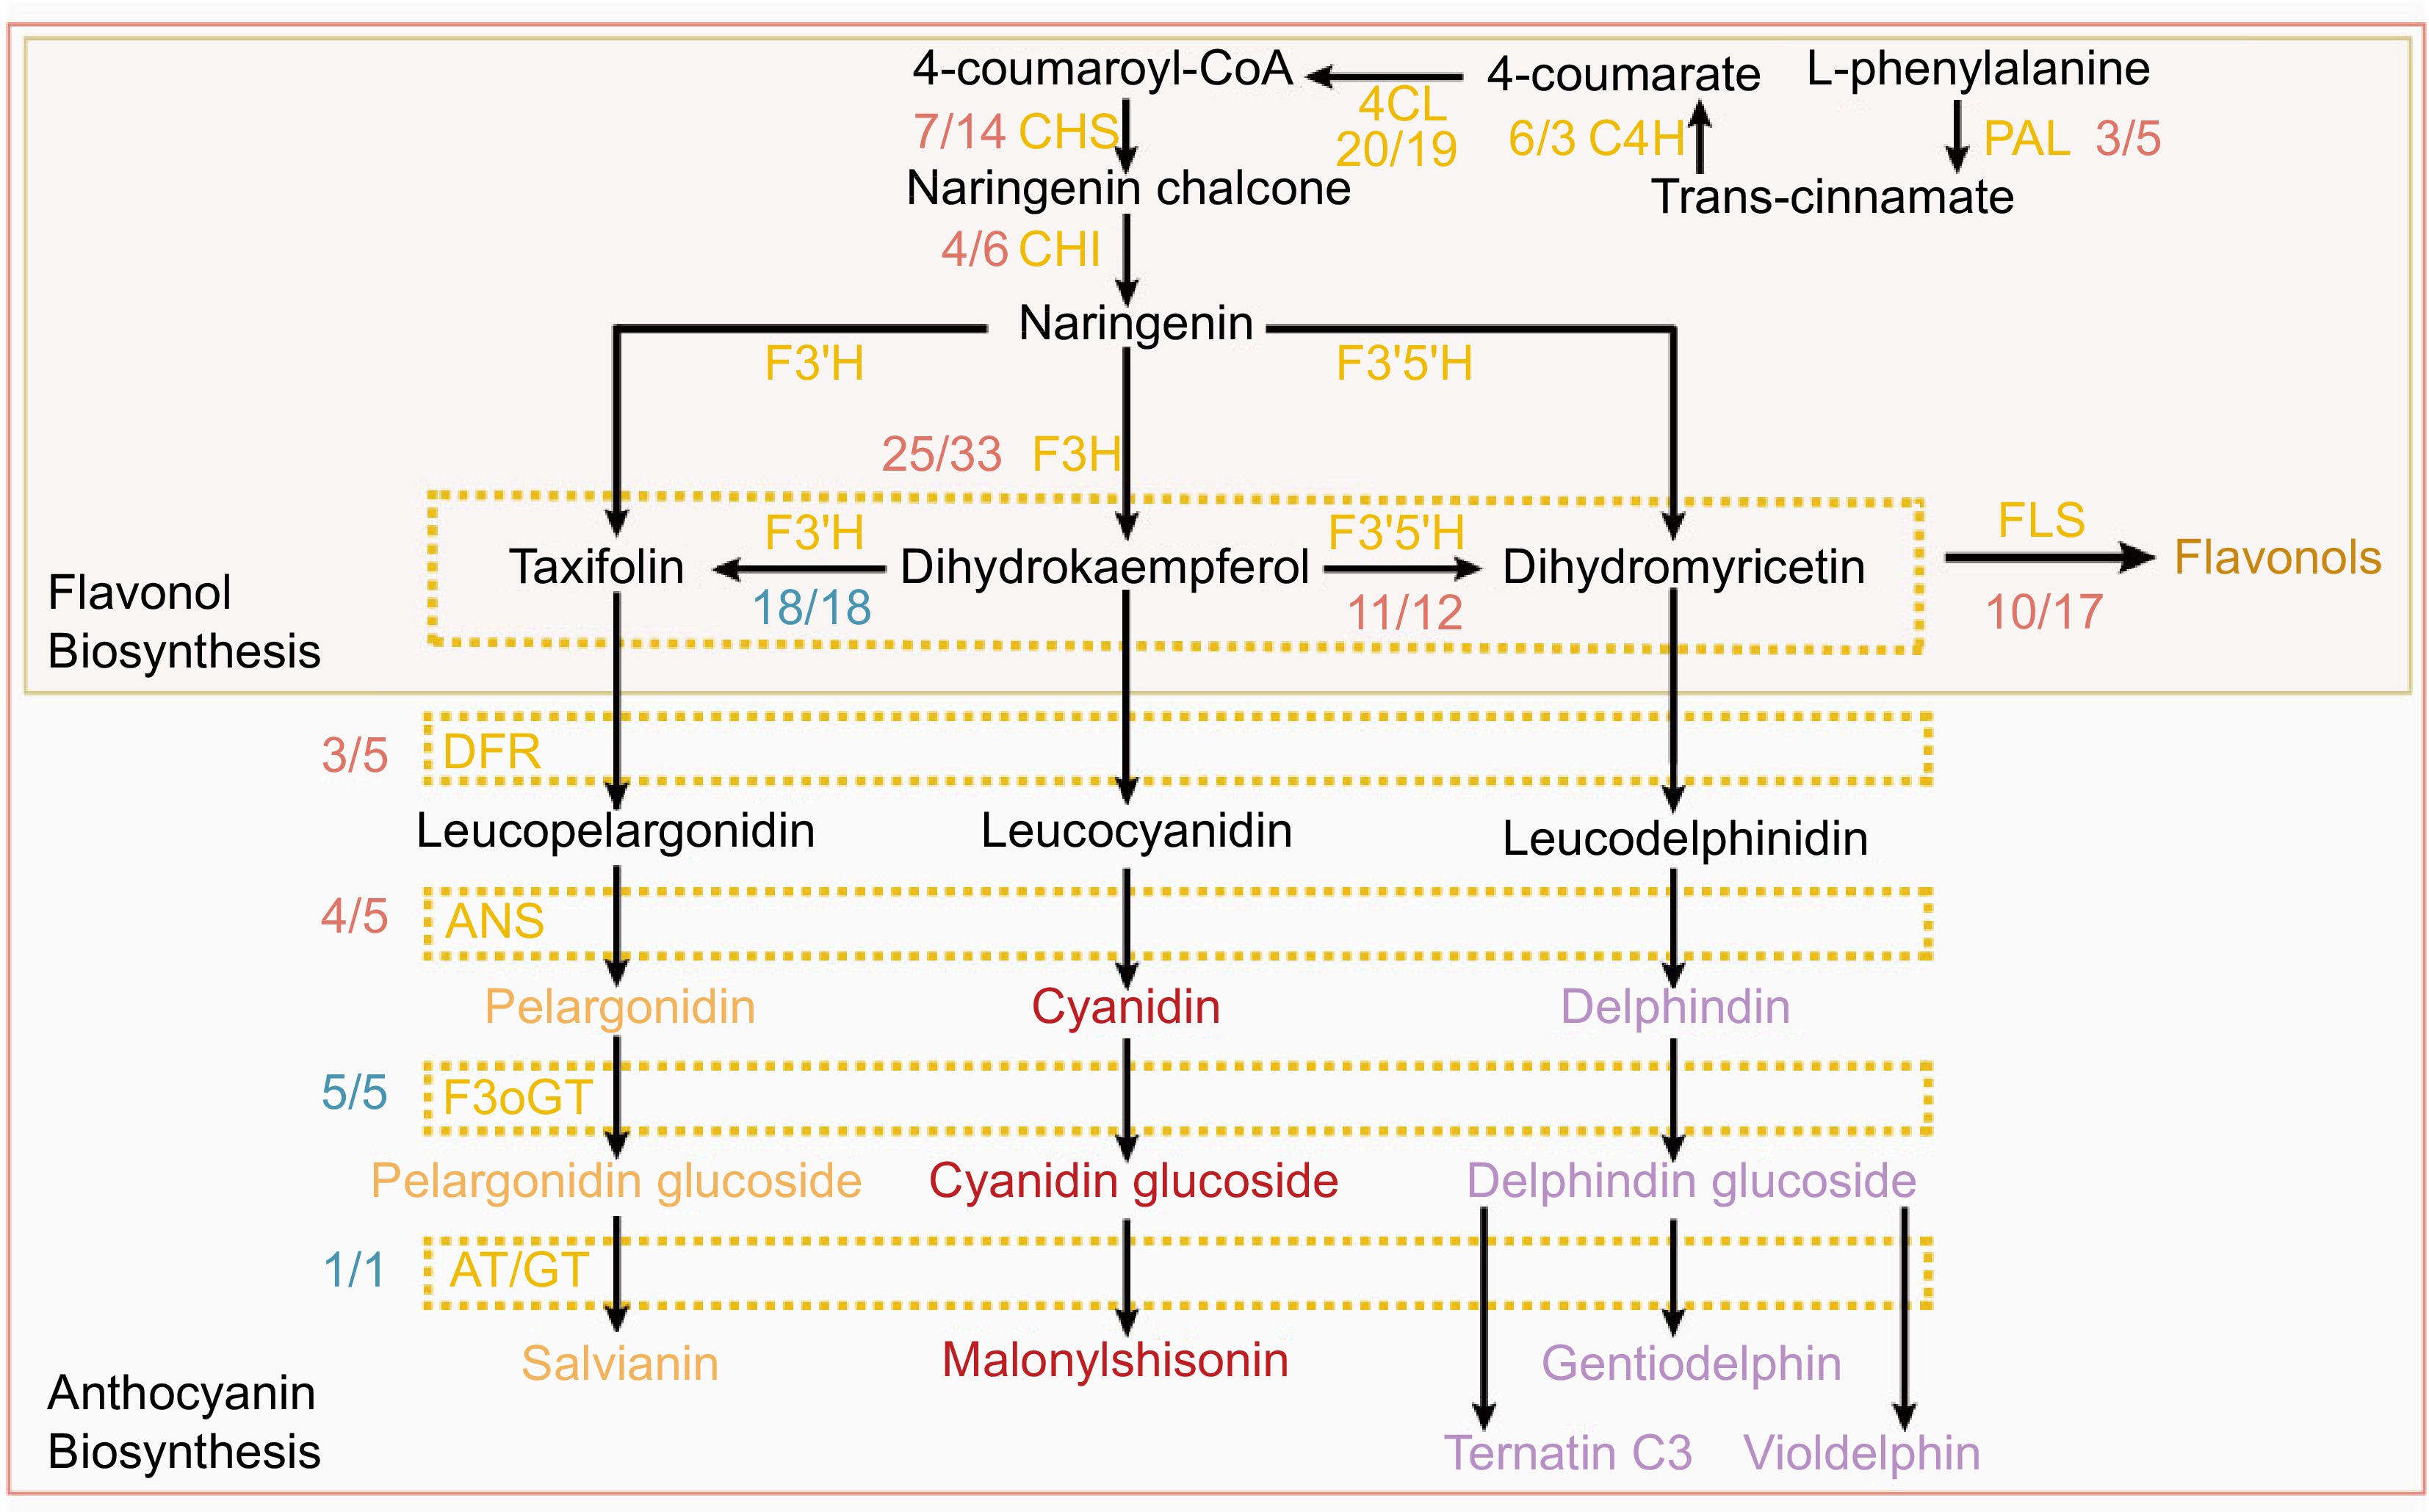
Figure 2.
Metabolic pathways of anthocyanins and flavonols in R. simsii and R. molle. Fractions next to gene abbreviations indicate the ratio of the number of expressed genes for R. molle vs R. simsii; the numerator is the gene number for R. molle and the denominator is the gene number for R. simsii. Equal gene numbers are colored blue, excess ratio in the gene number for R. molle is colored yellow, while excess ratio in R. simsii colored red.
-
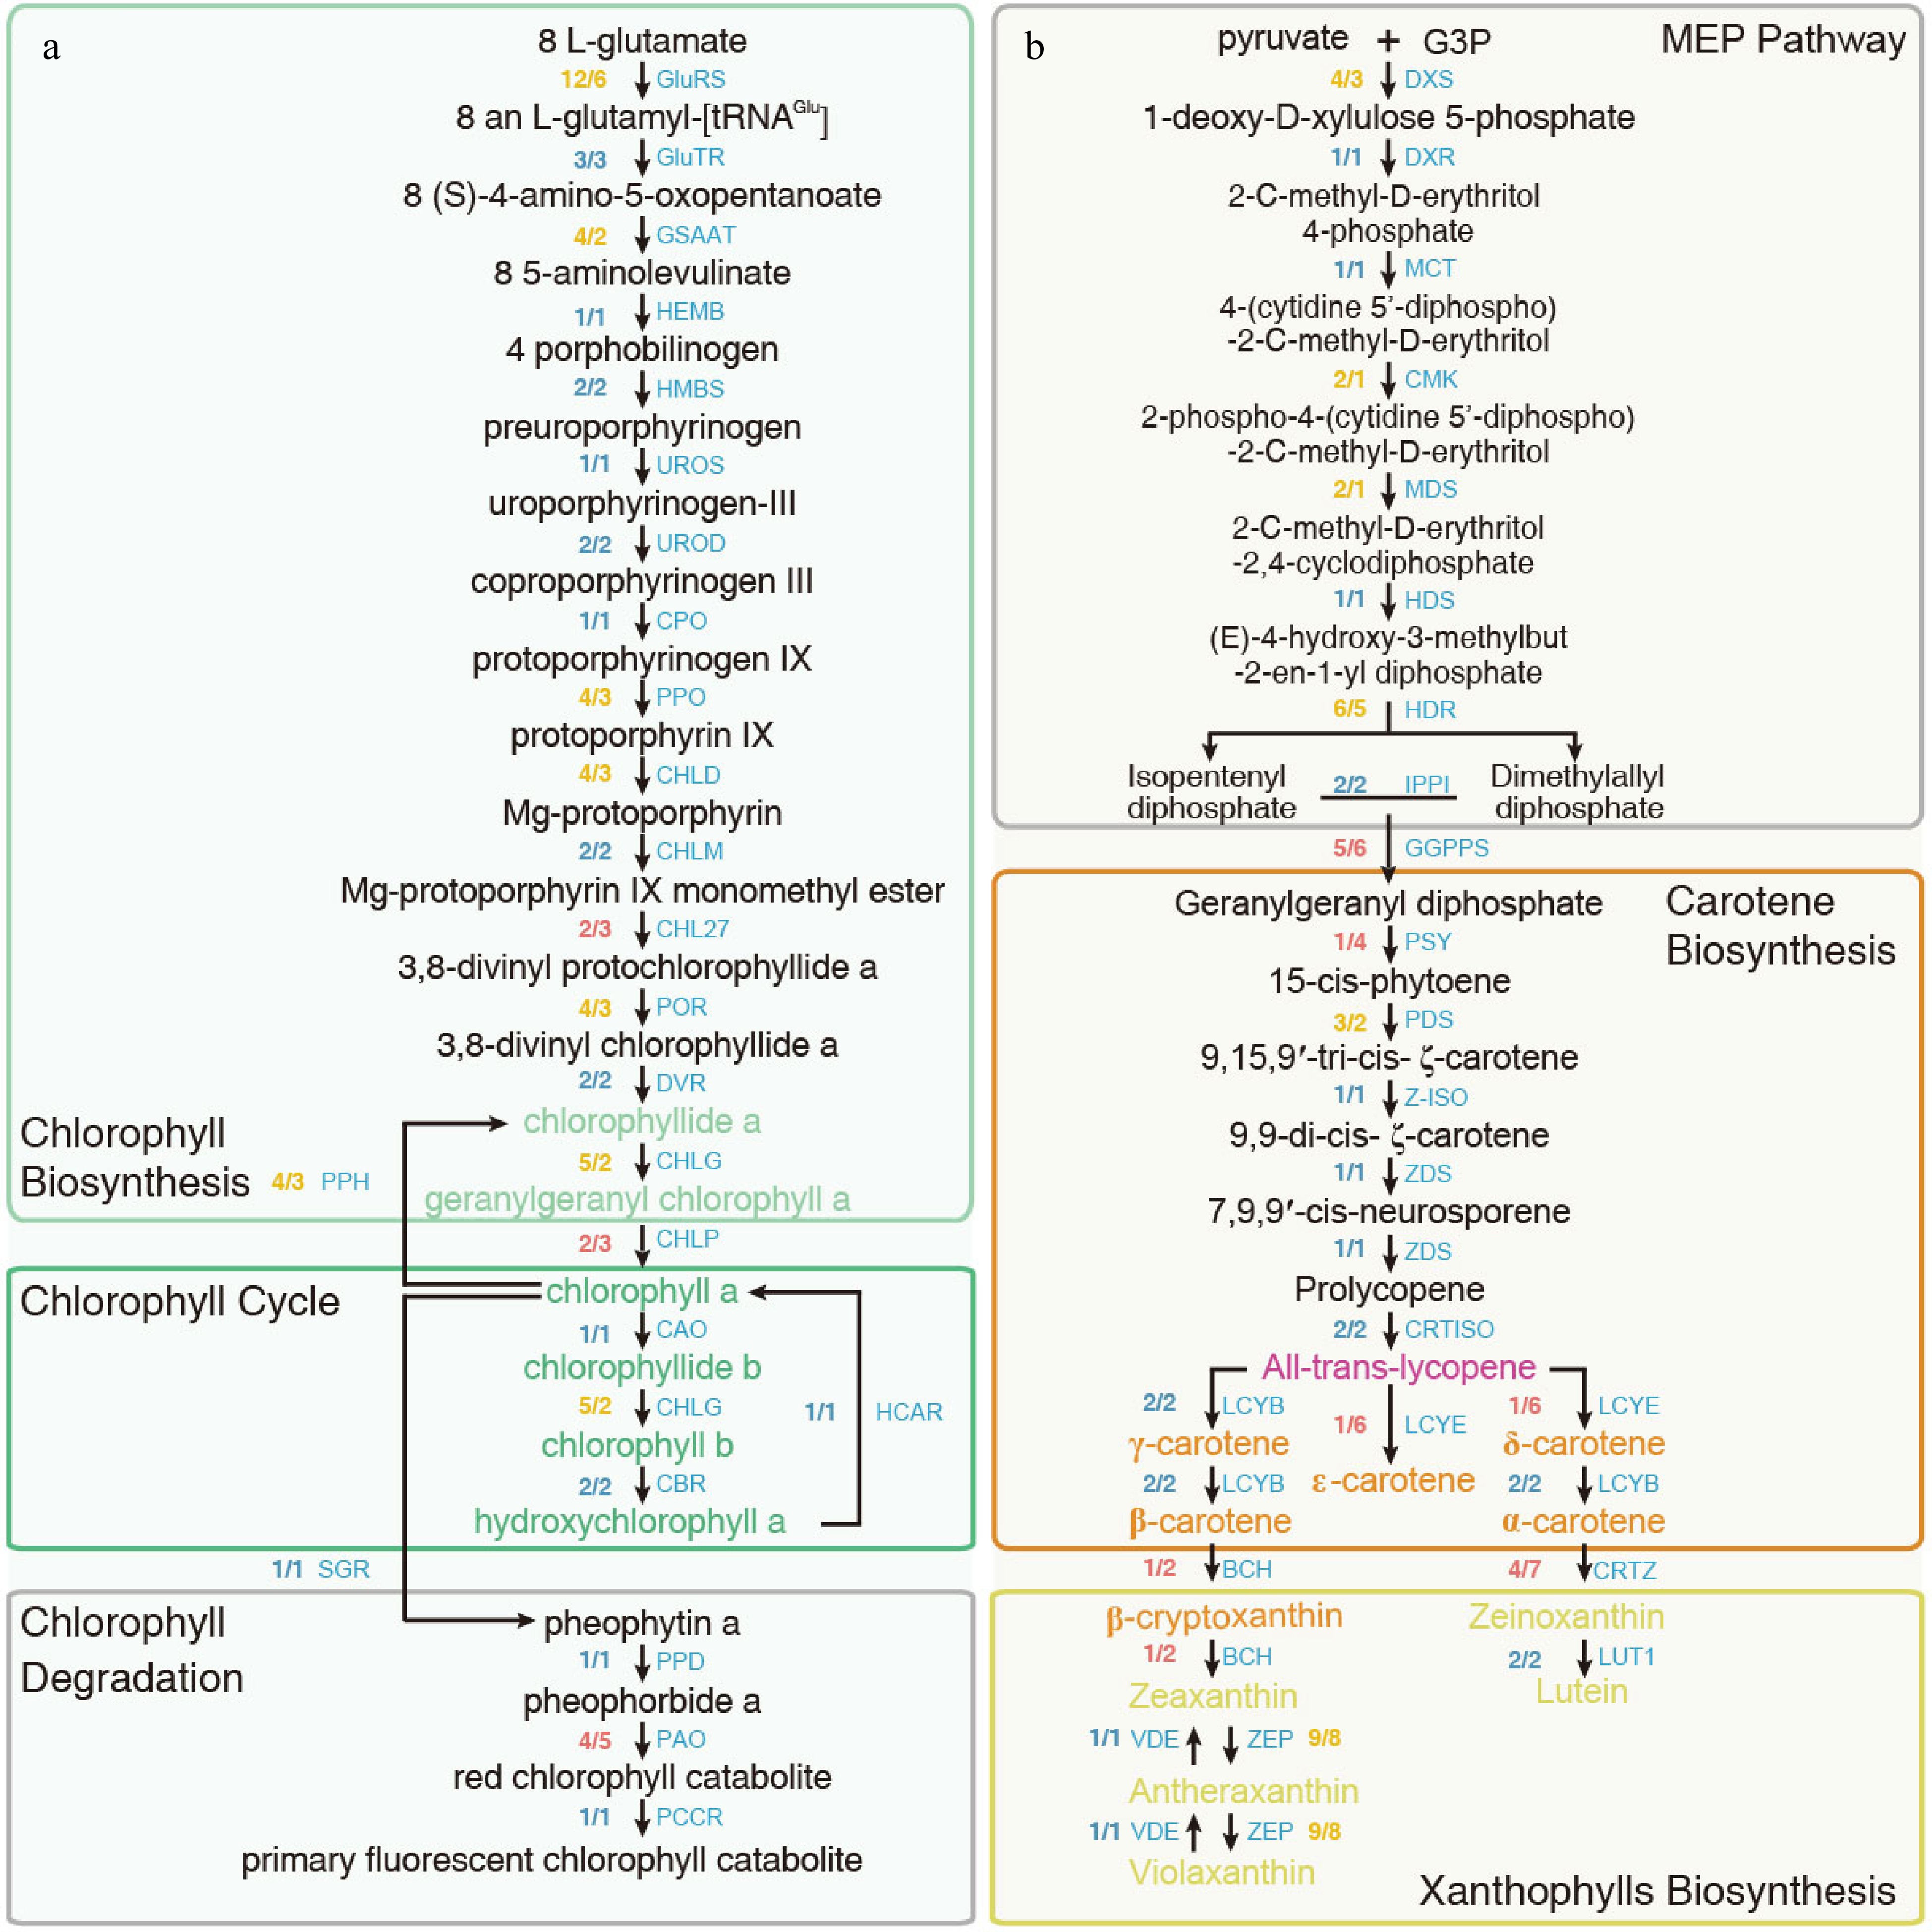
Figure 3.
Metabolic pathway of (a) chlorophylls and (b) carotenoids in R. simsii and R. molle. Fractions next to gene abbreviations indicate the ratio of the number of expressed genes for R. molle vs R. simsii; the numerator is the gene number for R. molle and the denominator is the gene number for R. simsii. Equal gene numbers are colored blue, excess ratio in the gene number for R. molle is colored yellow, while excess ratio in R. simsii colored red.
-
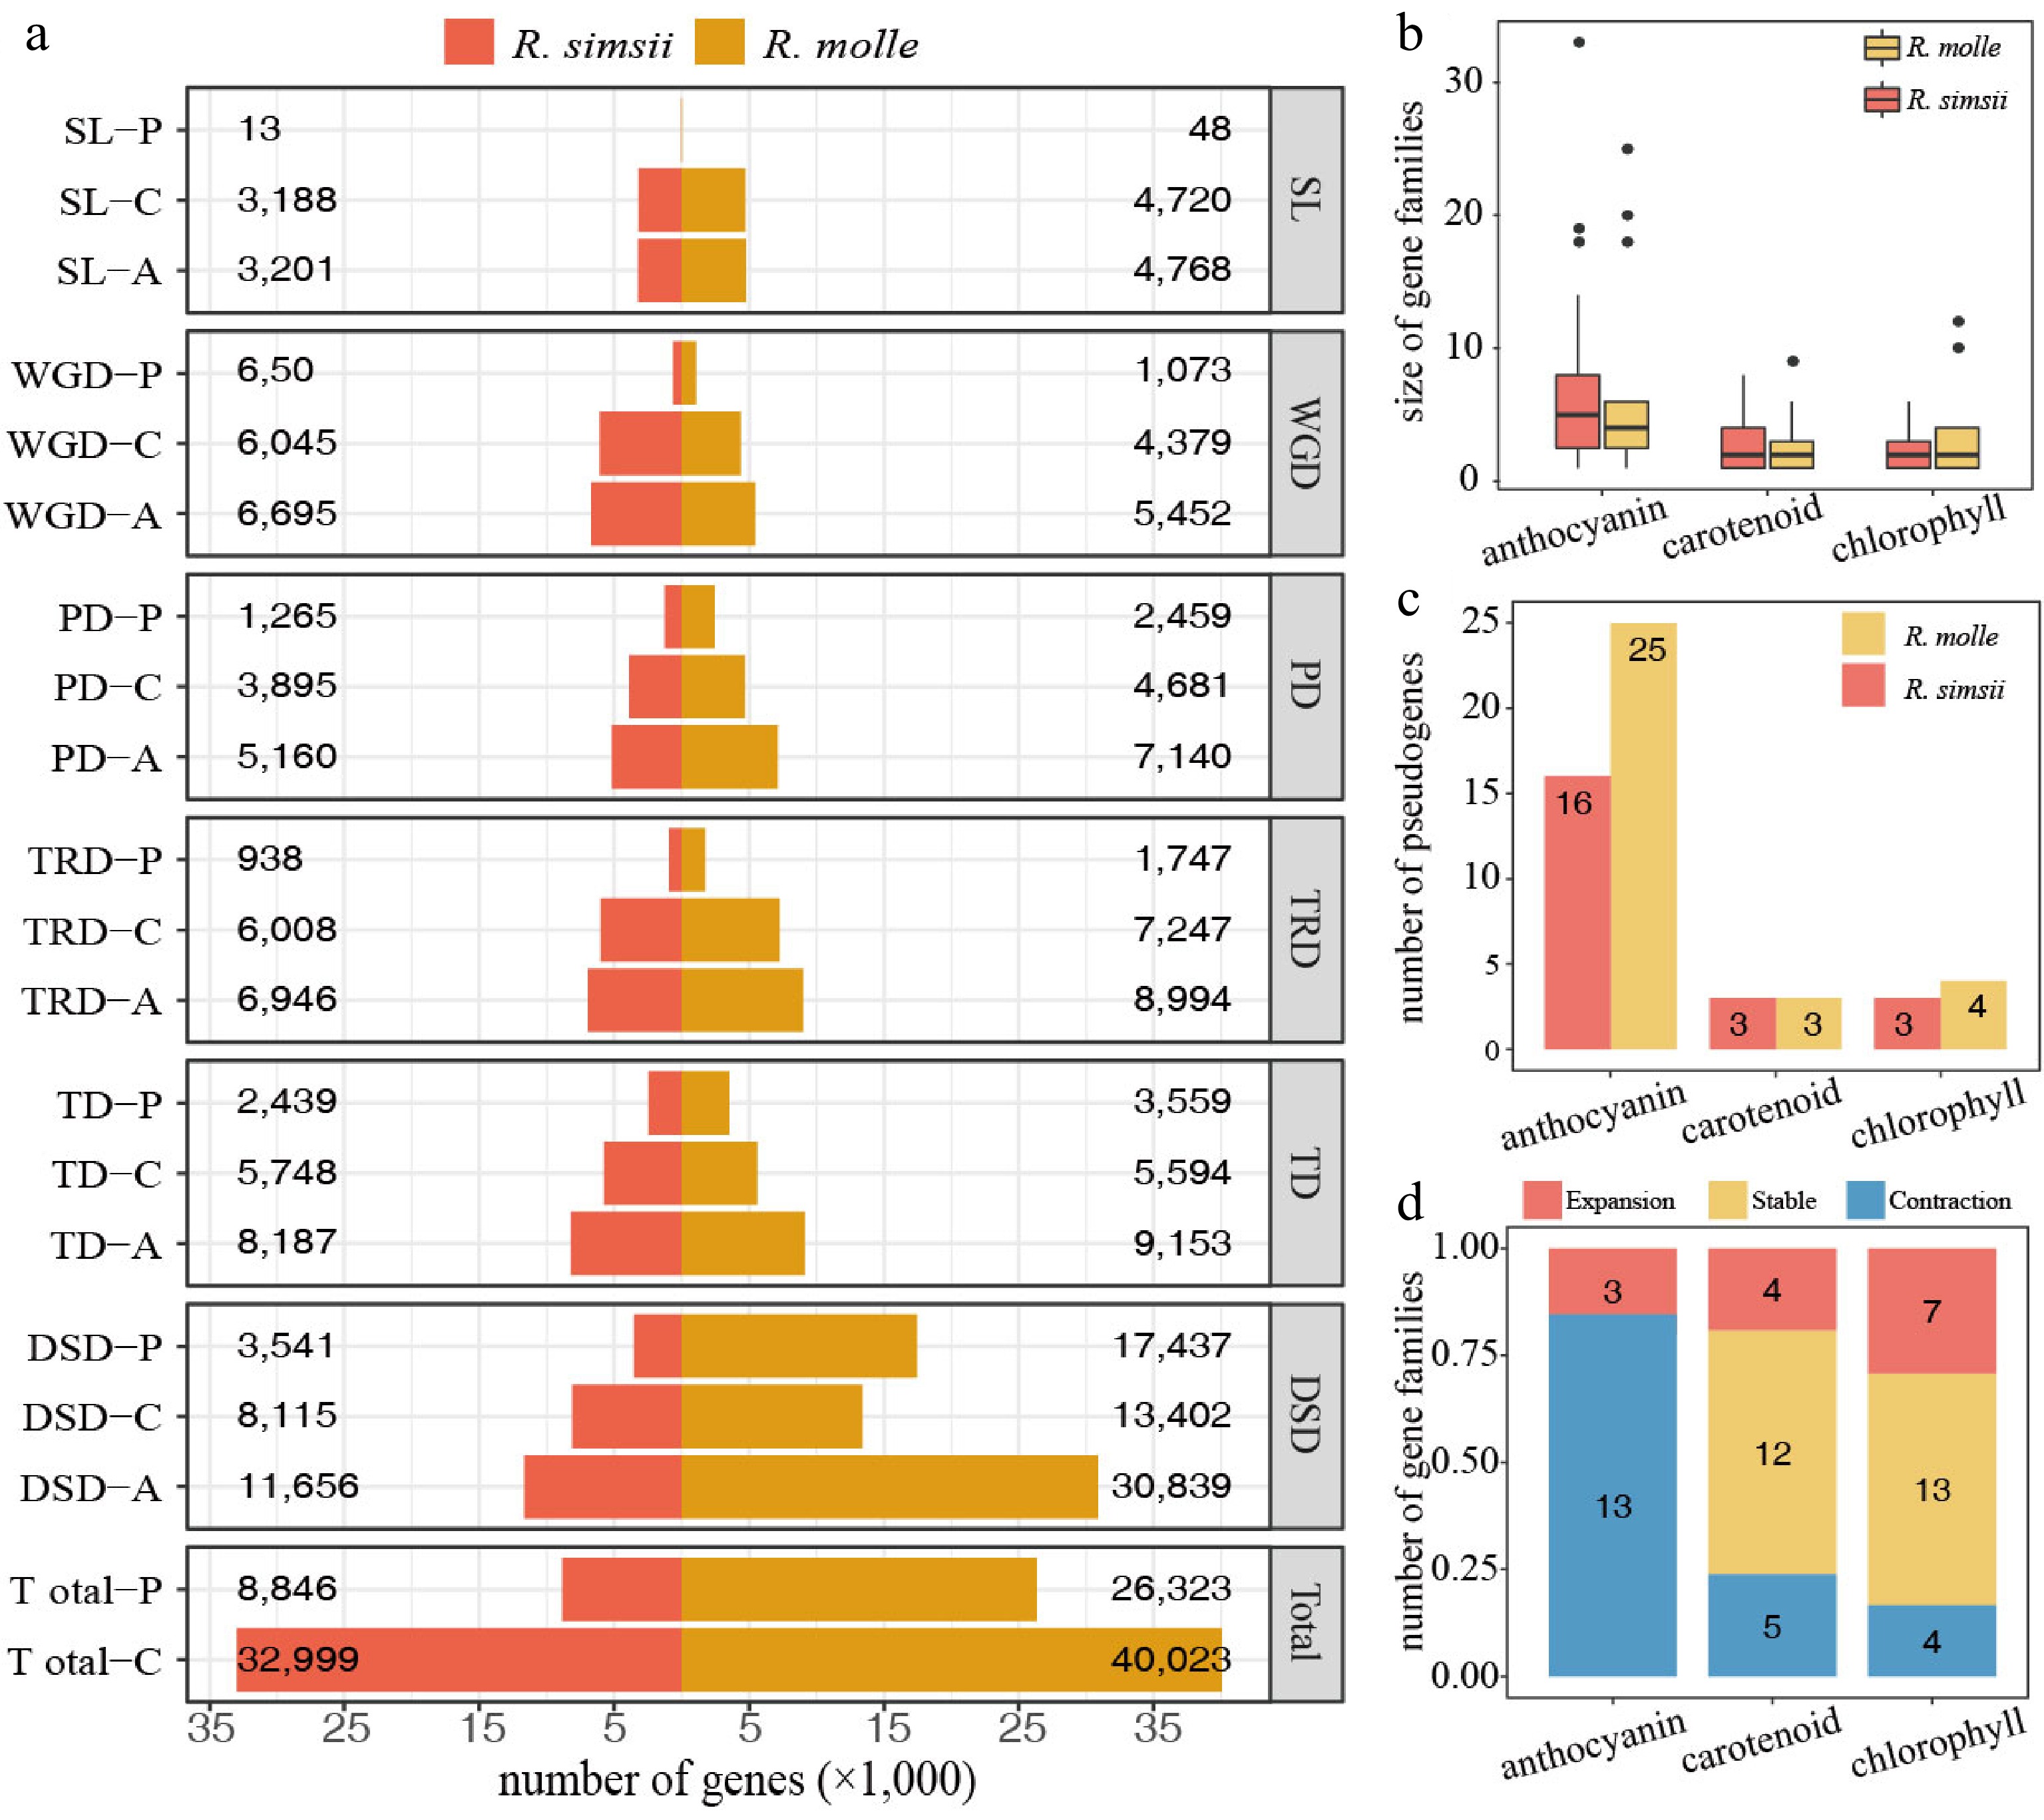
Figure 4.
Gene duplications and losses in R. simsii and R. molle. (a) Barplots show the counts between R. simsii and R. molle of coding genes and pseudogenes for the different duplication modes (WGD, TD, PD, TRD, DSD and SL: whole-genome, tandem, proximal, transposed and dispersed duplications, and singletons). Different suffixes on the left denote '-P' for Pseudogene, '-C' for Coding gene, and '-A' for all coding genes and pseudogenes. (b) Size distribution of enzyme coding gene families for the different pigment metabolic pathways. (c) Pseudogene numbers from the different metabolic pathways for anthocyanin, carotenoid and chlorophyll synthesis. We have linked a pseudogene to a specific enzyme, depending on which enzyme its parental coding gene encodes. (d) Barplots showing the counts of enzyme families from the different metabolic pathways for anthocyanin, carotenoid and chlorophyll synthesis. A fraction > 1 for enzyme encoding gene numbers (R. molle/R. simsii) defines as 'Expansion'; a fraction of 1 defines as 'Stable'; a fraction < 1 defines as 'Contraction'. (Modified from a previous publication[26]).
-
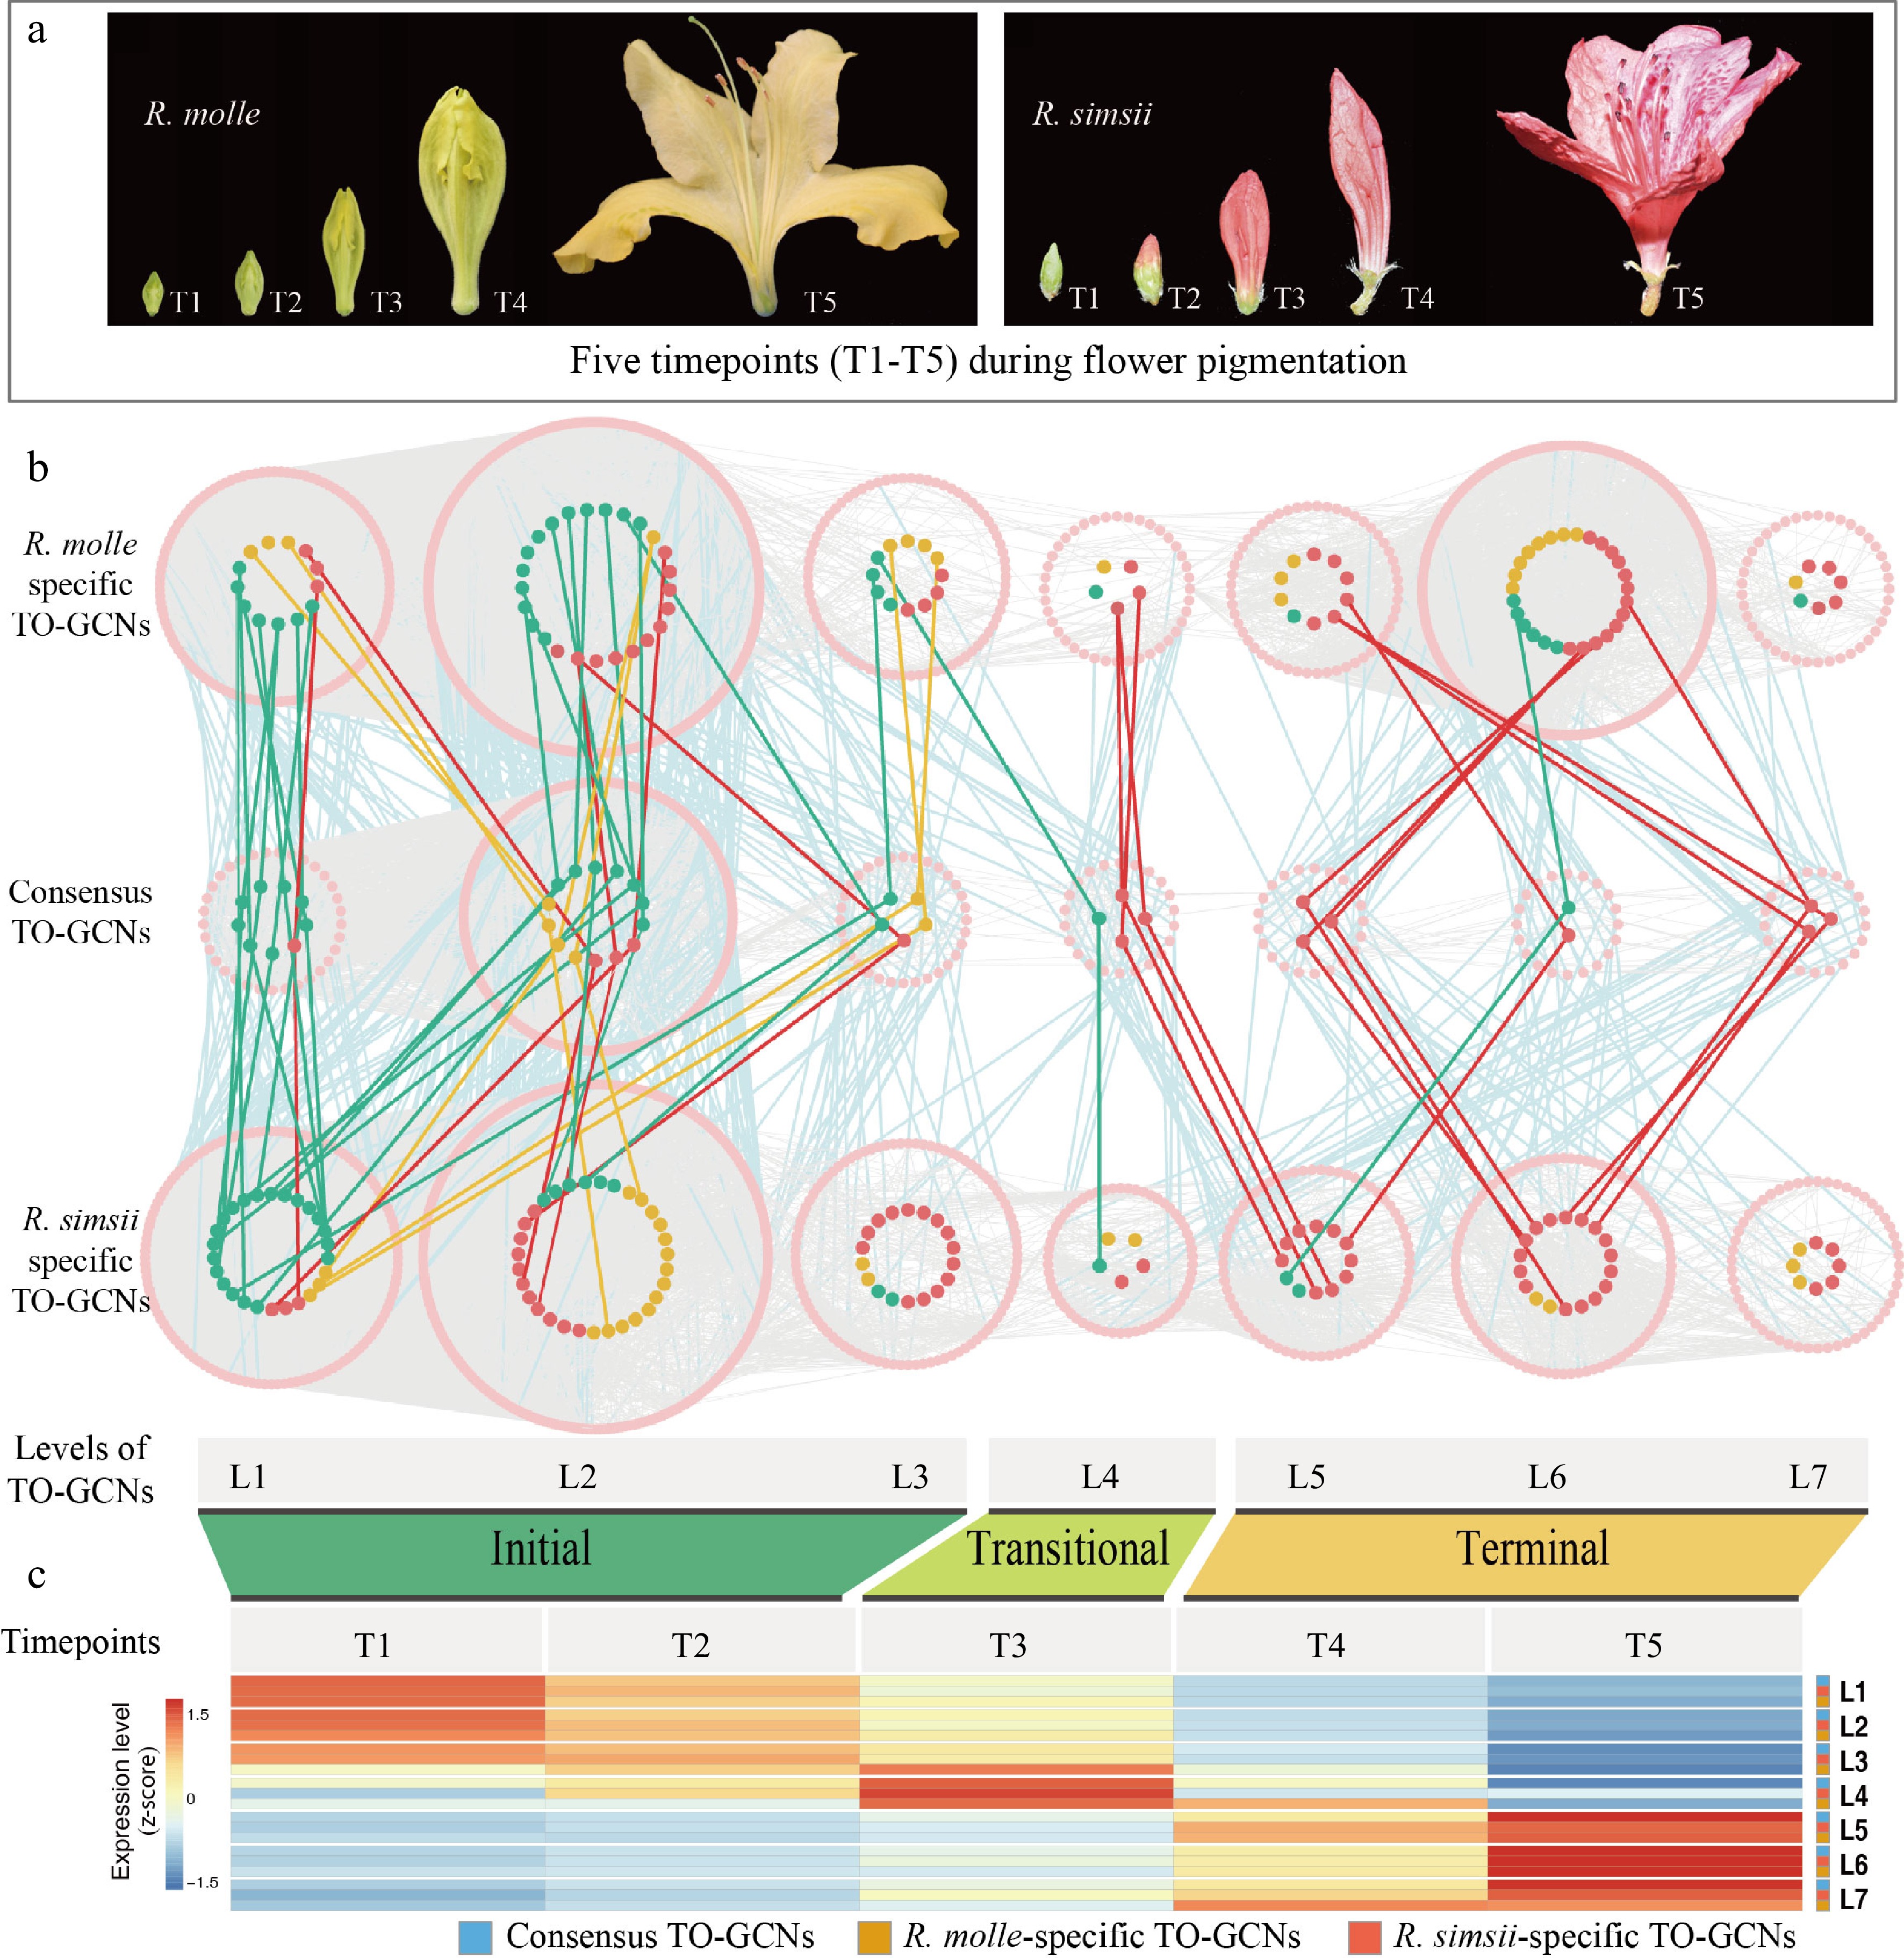
Figure 5.
Time-ordered gene co-expression networks during flower coloration of R. molle and R. simsii. (a) Five timepoints (T1−T5) during flower pigmentation. (b) Predicted regulatory network and the resolved gene regulation among transcription factors (TFs; pink points) and enzymatic genes involved in pathways of carotenoid (orange points), chlorophyll (green points) and anthocyanin/flavonol (red points) biosynthesis. L1 to L7 indicate seven levels identified in three hierarchical time-ordered gene co-expression networks (R. molle-specific, R. simsii-specific and the consensus TO-GCNs). Edges between enzymatic genes were not shown. (c) Heatmaps of average normalized TPMs (z-score) at each timepoint of flowering at each level identified in three TO-GCNs. Three stages of flower coloring were identified as the initial (T1−T2), transitional (T3) and terminal (T4−T5) stages, based on the expression profile. Low to high expression is indicated by a change in color from blue to red.
-
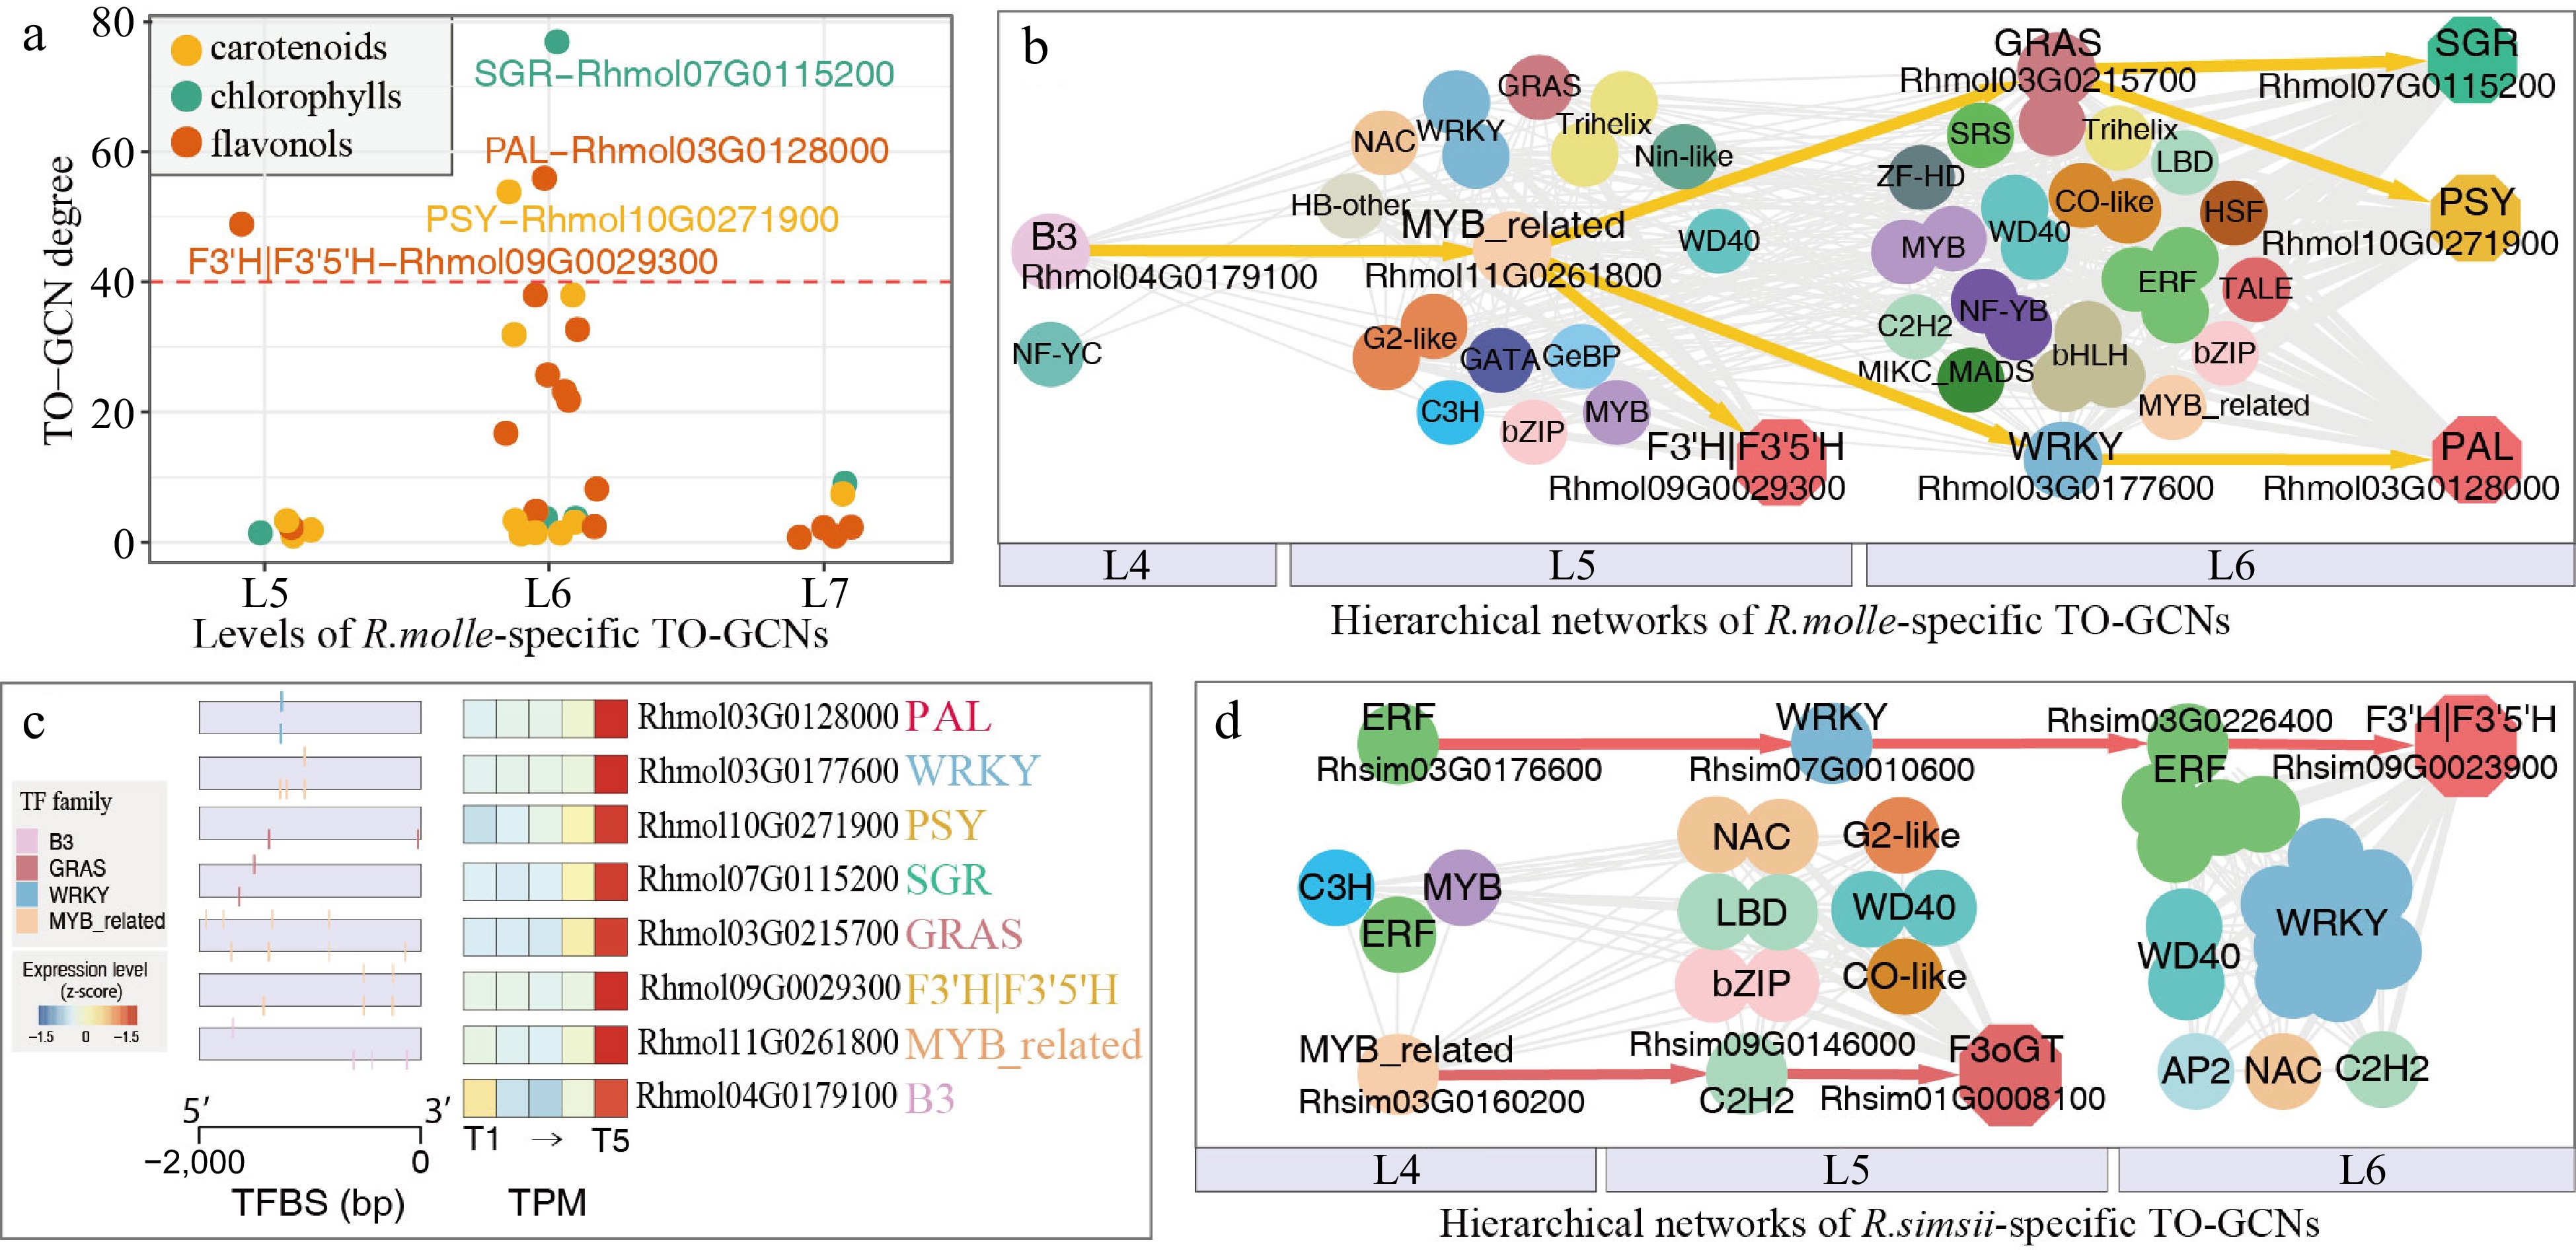
Figure 6.
Resolved hierarchical gene regulation during flower coloration of R. molle and R. simsii. (a) Degree of 34 enzymatic genes of the chlorophyll degradation and carotenoid/flavonol biosynthesis in two subnetworks. The degree cutoff for hub gene is 40. (b) Resolved hierarchical regulations for four hub genes PSY, SGR, PAL and F3'H|F3'5'H in R. molle. (c) Gene expressions (TPM) and TF binding site (TFBS) detected in the 2 kb upstream sequences of four hub genes and four potential regulators in R. molle. (d) Resolved hierarchical regulation for two hub genes F3oGT and F3'H|F3'5'H in R. simsii. (Modified from previous publications[26,31]).
-
Species Data resources R. prattii https://ngdc.cncb.ac.cn/gwh/Assembly/24363/show R. molle v1 www.ncbi.nlm.nih.gov/datasets/genome/GCA_030770705.1 R. molle v2 https://ngdc.cncb.ac.cn/gwh/Assembly/29302/show R. henanense https://ngdc.cncb.ac.cn/gwh/Assembly/22219/show R. ripense https://plantgarden.jp/en/list/t224351/genome R. ovatum http://bioinfor.kib.ac.cn/RPGD/download_genome.html R. griersonianum www.ncbi.nlm.nih.gov/datasets/genome/GCA_018127125.1 R. simsii www.ncbi.nlm.nih.gov/datasets/genome/GCA_014282245.1 R. williamsianum http://bioinfor.kib.ac.cn/RPGD/download_genome.html R. delavayi v1 http://bioinfor.kib.ac.cn/RPGD/download_genome.html R. delavayi v2 http://bioinfor.kib.ac.cn/RPGD/download_genome.html R. vialii https://ngdc.cncb.ac.cn/gwh/Assembly/37538/show R. irroratum http://bioinfor.kib.ac.cn/RPGD/download_genome.html Table 1.
Data resources of 12 genomic projects in Rhododendron.
-
Pigment Type R. simsii R. molle v2 Anthocyanin ALL 125 104 Anthocyanin PD 9 (7.20%) 15 (14.42%) Anthocyanin TD 46 (36.8%) 32 (30.76%) Anthocyanin TD/PD 55 (44.00%) 47 (45.19%) Anthocyanin / flavonol ALL 139 111 Anthocyanin / flavonol PD 11 (7.91%) 17 (15.31%) Anthocyanin / flavonol TD 49 (35.25%) 32 (28.82%) Anthocyanin / flavonol TD/PD 60 (43.16%) 49 (44.14%) Flavonol ALL 112 90 Flavonol PD 11 (9.82%) 14 (15.55%) Flavonol TD 42 (37.5%) 30 (33.33%) Flavonol TD/PD 53 (47.32%) 44 (48.88%) Chlorophyll ALL 54 64 Chlorophyll PD 2 (3.70%) 7 (10.93%) Chlorophyll TD 10 (18.51%) 10 (15.62%) Chlorophyll TD/PD 12 (22.22%) 17 (26.56%) Carotenoid ALL 58 52 Carotenoid PD 4 (6.89%) 4 (7.69%) Carotenoid TD 6 (10.34%) 8 (15.38%) Carotenoid TD/PD 10 (17.24%) 12 (23.07%) ALL, all identified genes; TD, tandem duplicated genes; PD, proximal duplicated genes; TD/PD, tandem or proximal duplicated genes. (Modified from a previous publication[26]). Table 2.
Summary of genes in tandem (TD) or proximal (PD) gene clusters related to pigmentation metabolic pathway.
Figures
(6)
Tables
(2)