-
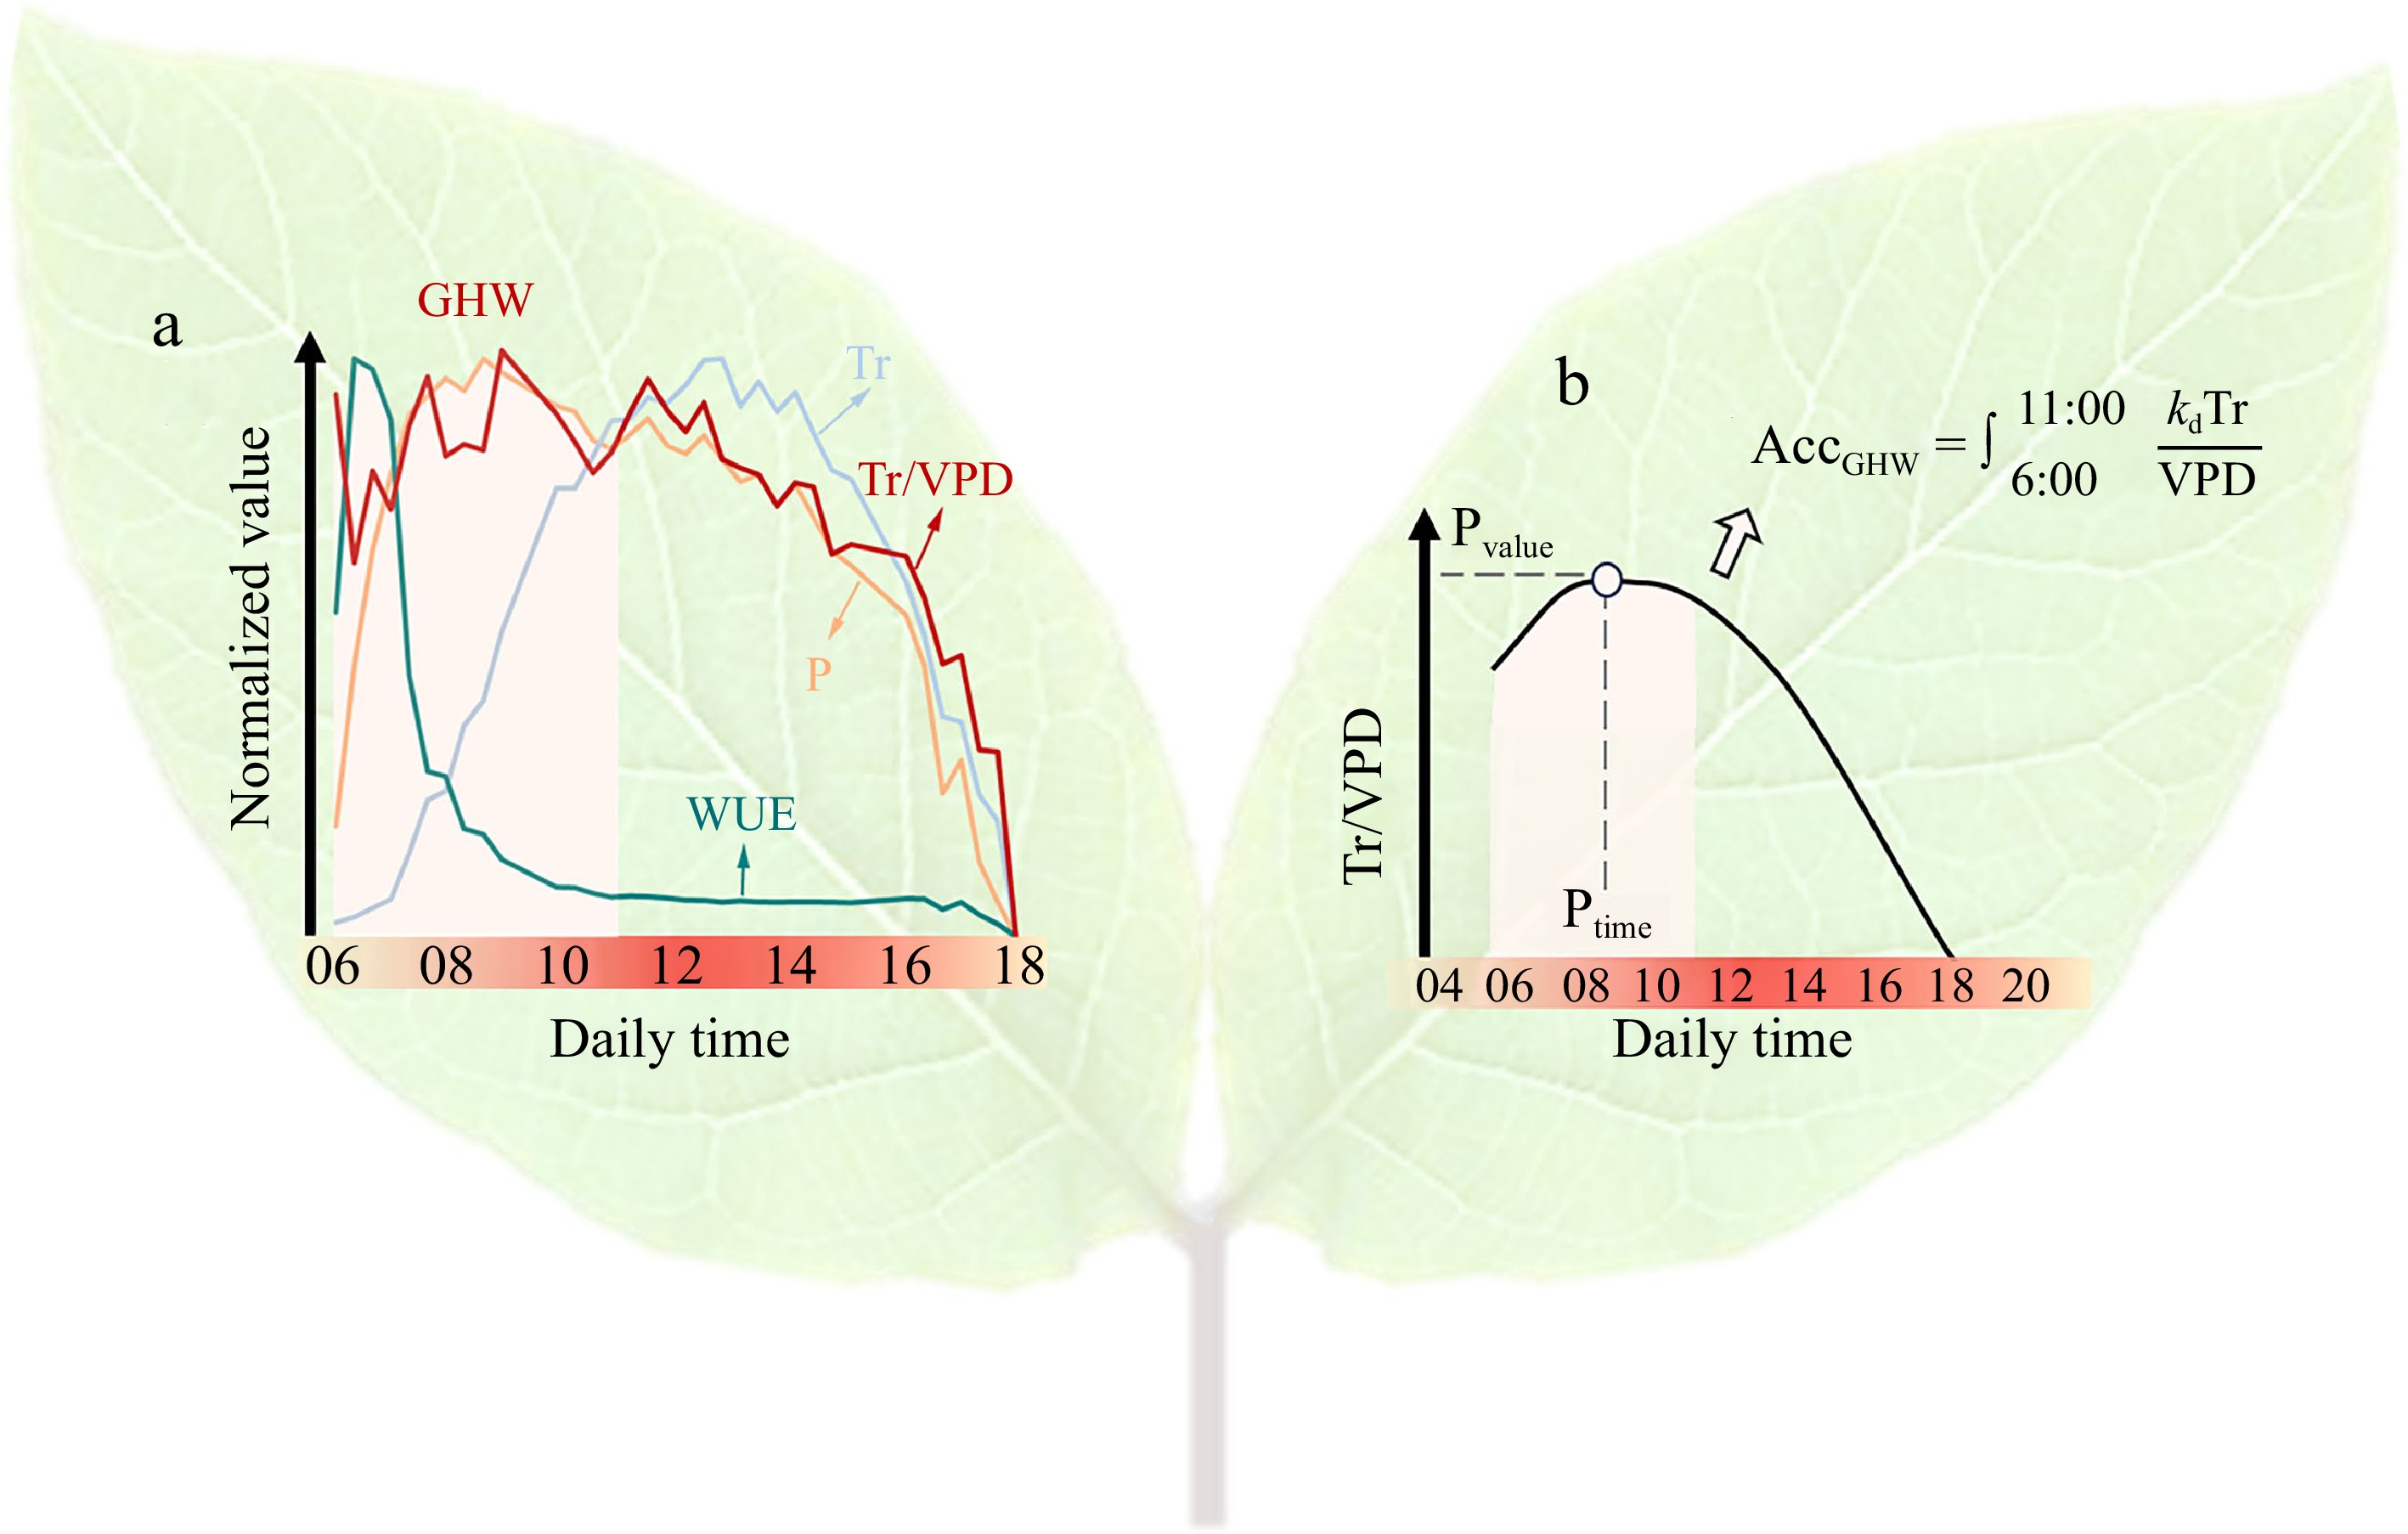
Figure 1.
A diagram illustrating the concept and definition of GHW and its quantitative components. (a) Tr, P, and WUE represent the transpiration rate, photosynthesis rate and water use efficiency measured at the whole-plant scale, respectively. VPD represents the environmental vapor pressure deficit. GHW is defined as the WUE during the 'golden hours', typically ranging from 6:00−11:00, during which WUE is significantly higher compared to other periods. After 11:00, WUE tends to stabilize. (b) Pvalue, Ptime, and AccGHW represent the peak value, peak time, and accumulative value of Tr/VPD during the golden hours, respectively. Kd is a specie-specific parameter. Picture is adapted from Sun et al.[20]. To accurately detect these continuous measurements, the system must precisely differentiate the signals emanating from the plants from environmental noises (see Fig. 2 for explanation).
-

Figure 2.
Refining data accuracy: How the Plantarray system enhances signal-to-noise ratio in lysimetry. This figure illustrates the Plantarray system's advancements (Plantarray 3.0, Plant-DiTech, Rehovot, Israel) in addressing challenges commonly associated with traditional lysimeters for measuring plant transpiration, stomatal conductance and biomass gain separately from evaporation. The system's innovative design and technological integration adeptly tackle difficulties such as distinguishing changes in soil weight attributable to soil moisture versus plant biomass, and accurately tracking non-plant related weight alterations due to soil-surface evaporation and pot-dripping. It also skillfully manages the application of diverse treatments and the maintenance of consistent soil water content for numerous plants concurrently, thereby overcoming the pot size effect and preventing salinity build-up in the soil. Key features of the Plantarray system: (1) Advanced sensing technologies: The Plantarray system employs temperature-compensated lysimeters, each connected to an individual controller with dual irrigation valves per plant. This configuration distinctly separates changes in soil weight caused by water dynamics from those due to biomass gain. Being a non-data logger system with short cables and an integrated analog-to-digital solution adjacent to each lysimeter, it ensures swift response times, significantly enhancing measurement accuracy. (2) Controlled drainage and multi-dripper system: Positioned in a controlled drainage green bath and supplied with several drippers, each plant's setup in the Plantarray system precisely monitors every water droplet entering and exiting through dripping or evaporation. This precision enables accurate real transpiration calculations and maintains consistent soil moisture levels, while effectively differentiating plant biomass from other elements. (3) Effective feedback control to handle variations: The Plantarray system's distinctive configuration efficiently addresses challenges such as salinity gradients and soil water content variations. Its carefully considered design also reduces the influence of pot size, promoting more consistent and controlled experimental conditions. (4) Environmental sensors and data analysis: Equipped with a suite of soil and environmental sensors and an advanced data analysis framework, the Plantarray system adjusts to changes in plant biomass and ambient conditions. This comprehensive setup normalizes data for plant size differences and varying environmental conditions, facilitating precise, comparable measurements across different plants and scenarios. For an in-depth understanding of the operational principles and effectiveness of the Plantarray system, see Gosa et al.[14].
-

Figure 3.
A schematic overview illustrating the practical procedures for leveraging GHW traits in breeding. Measurements of environmental parameters [e.g., air temperature (Tair) and relative humidity (RH)], transpiration rate (Tr), and net photosynthesis rate (Pn) are taken directly or inferred through high-throughput phenotyping platforms, such as spectrum-based, lysimeter-based, or gas exchange-based platforms. GHW traits include parameters related to Tr/VPD or Pn during the gold-hour WUE period (06:00−11:00). KASP: Kompetitive allele-specific PCR. GWAS: genome-wide association mapping. FM: functional mapping, a method to estimate mathematical parameters that describe the developmental mechanisms of trait formation and expression for each quantitative trait locus (QTL). MAS: marker-assisted selection. The superior genotypes possess favorable GHW traits, as reflected by optimized Pvalue, Ptime, and AccGHW. In making this figure, some images were adapted from some references: gas exchange[32], whole-genome resequencing[33], KASP[34], GWAS[35], FM[27], MAS[36].
Figures
(3)
Tables
(0)