-
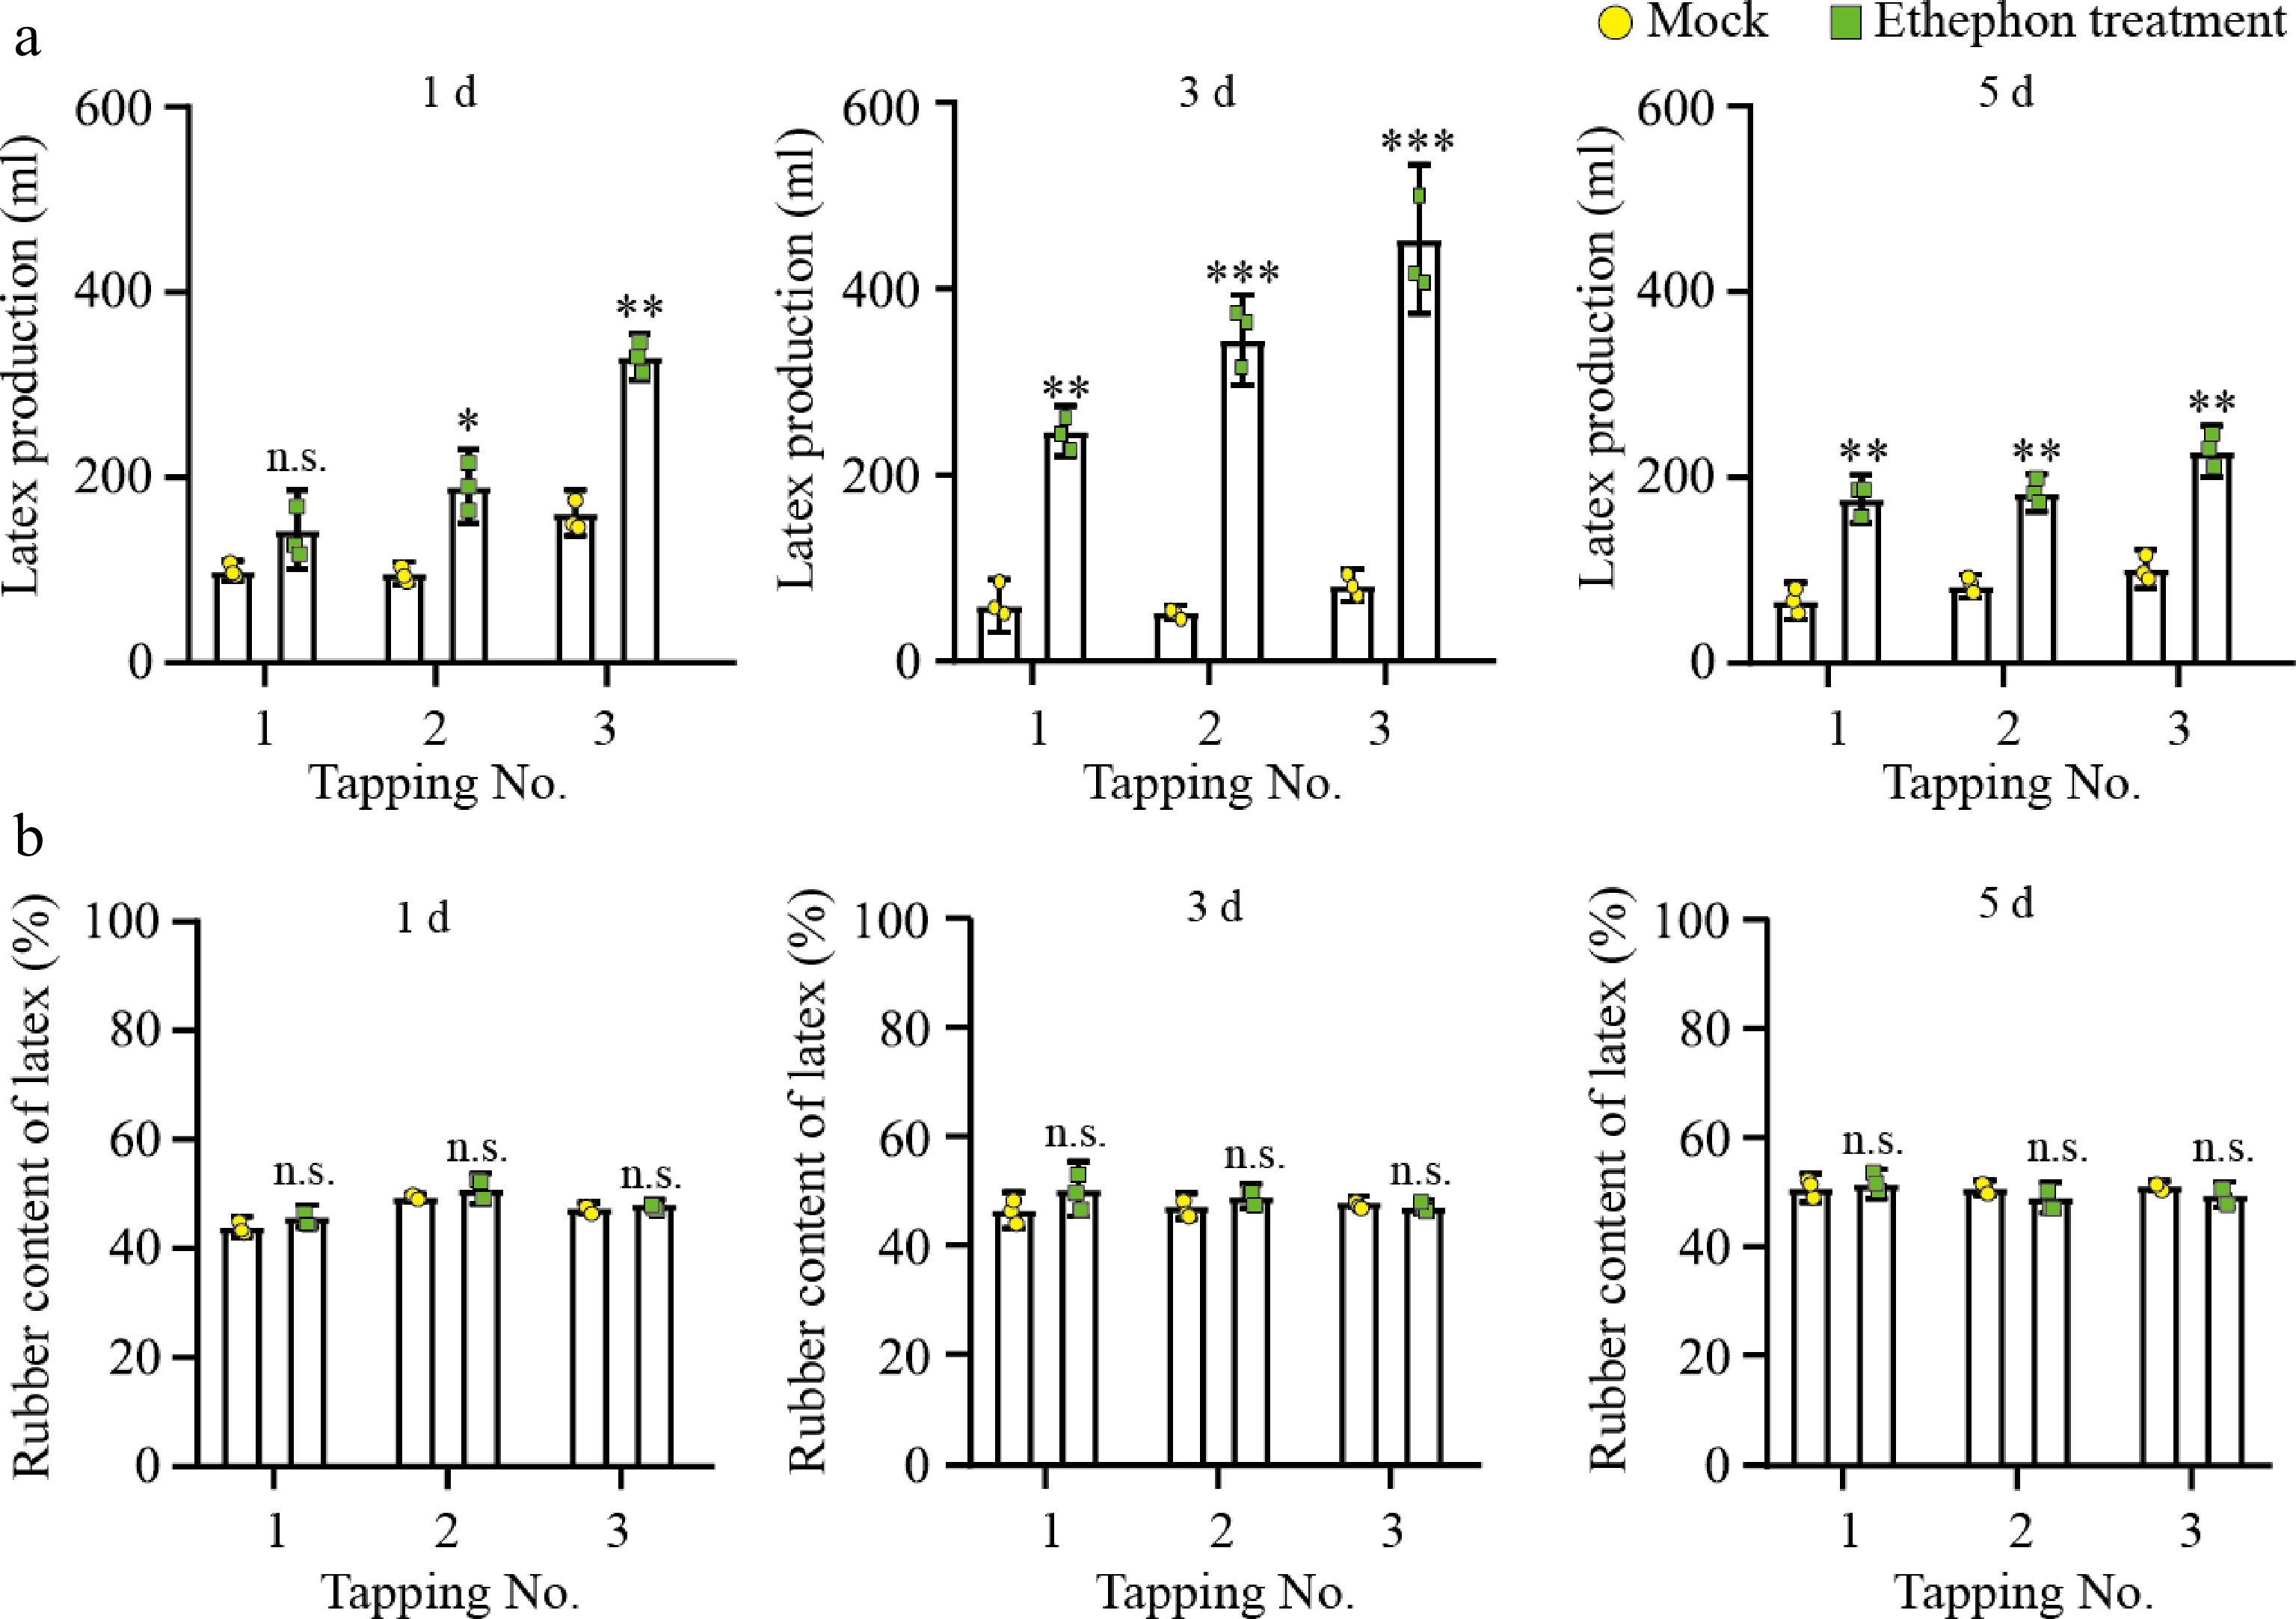
Figure 1.
(a) Latex production and (b) rubber content from ethephon-treated rubber trees. Significant difference was indicated by the asterisks above the bars (n.s. represents no significance, * p ≤ 0.05, ** p ≤ 0.01, *** p ≤ 0.001). 1 d, 3 d, 5 d represent 0.5% ethephon treatment on the 1st, 3rd, and 5th days before tapping. Tapping No. represents tapping number.
-
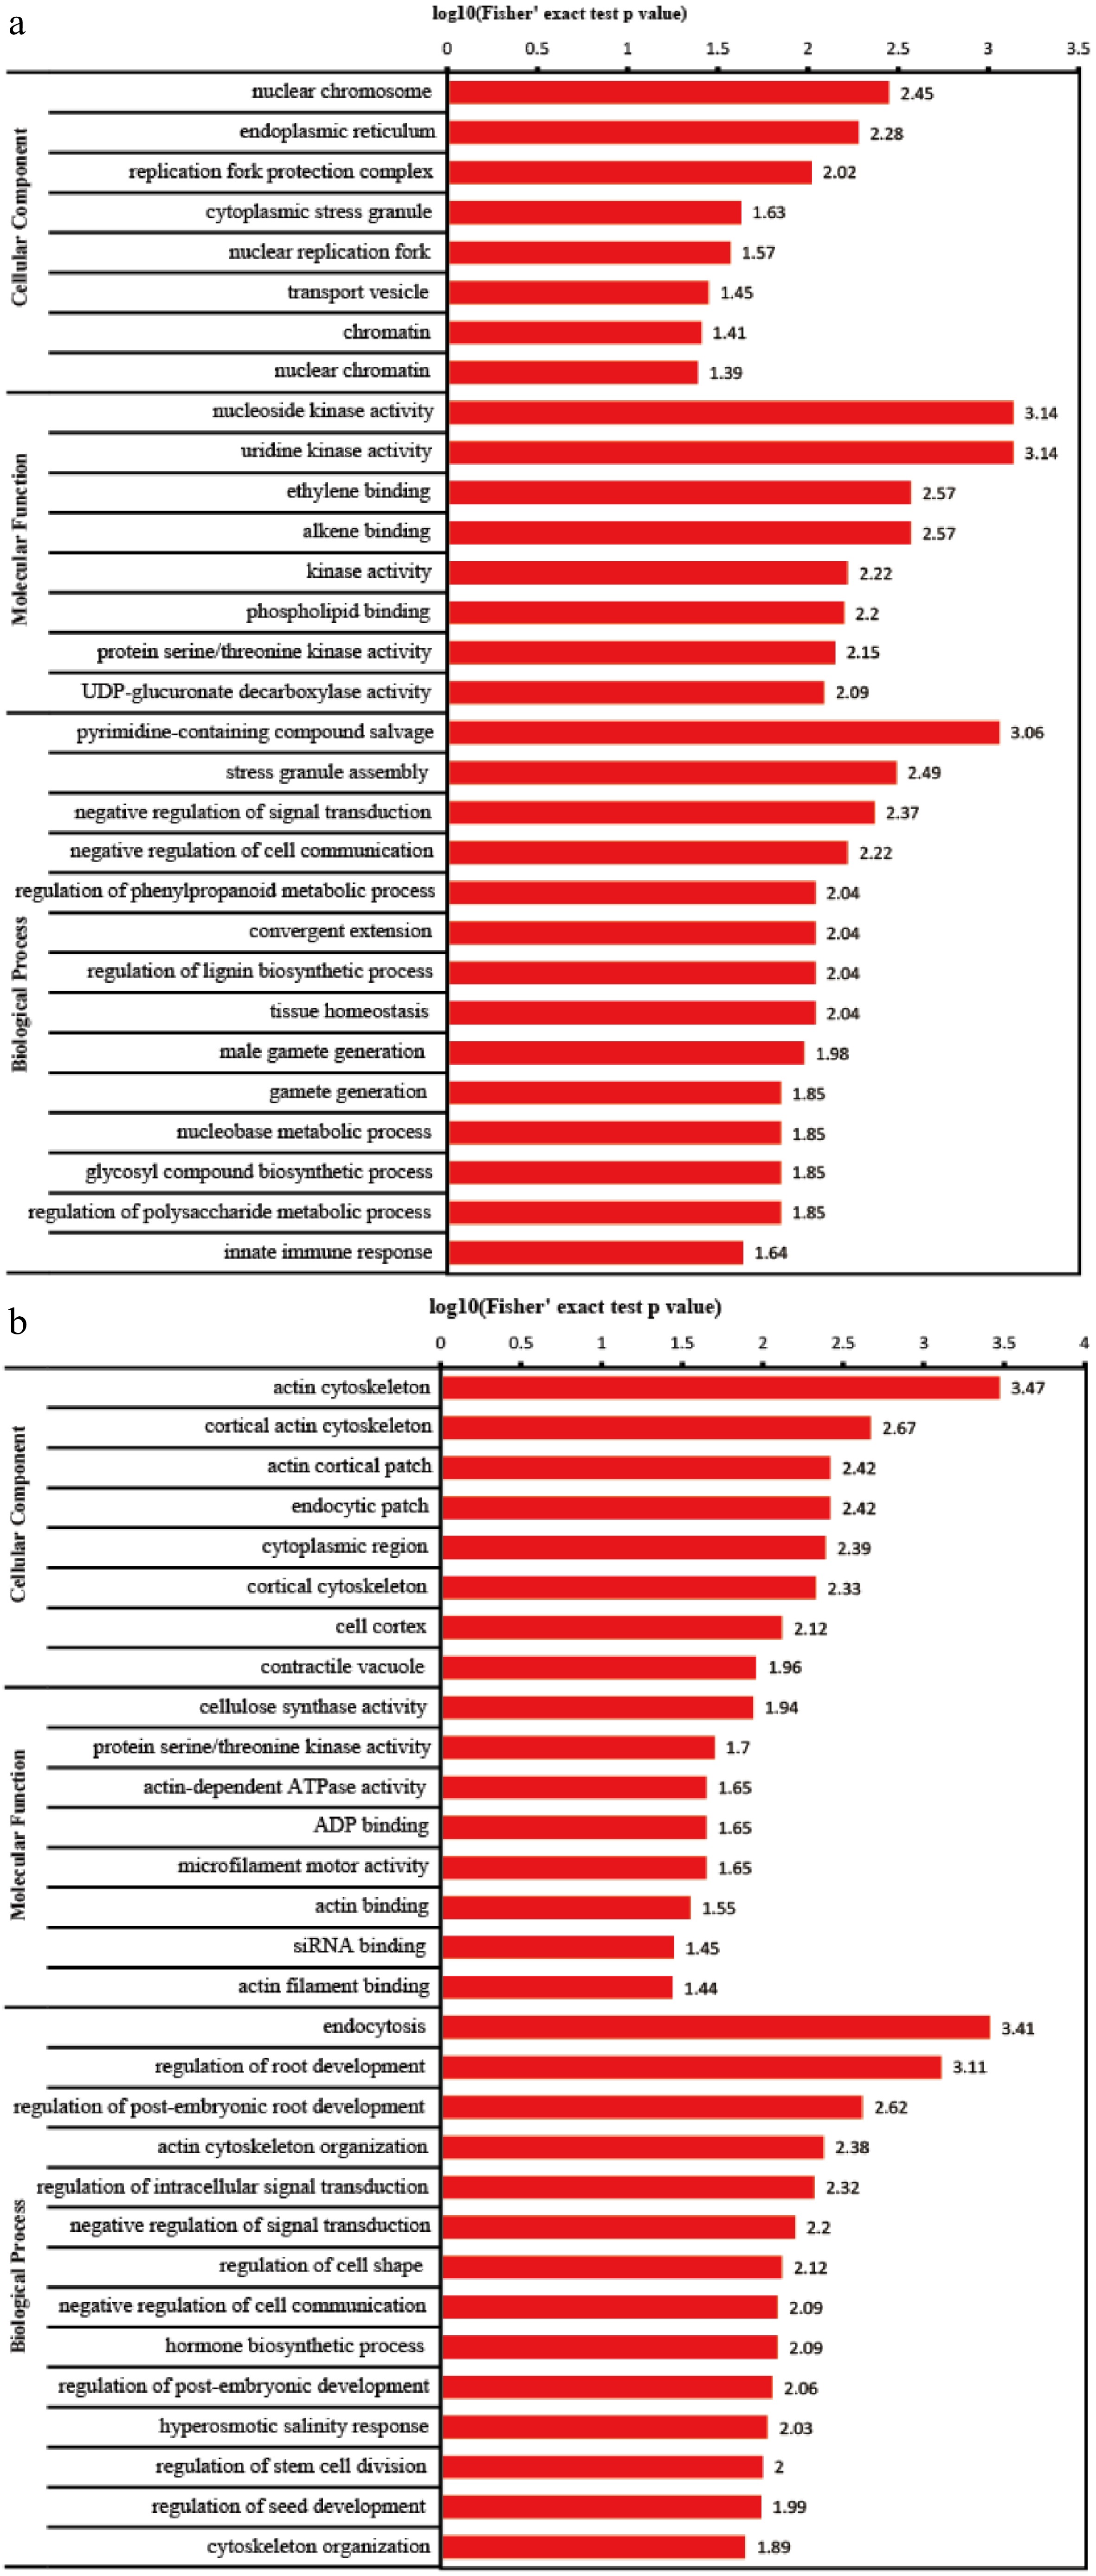
Figure 2.
Top 30 GO categories assigned to the (a) upregulated and (b) downregulated DEPs.
-
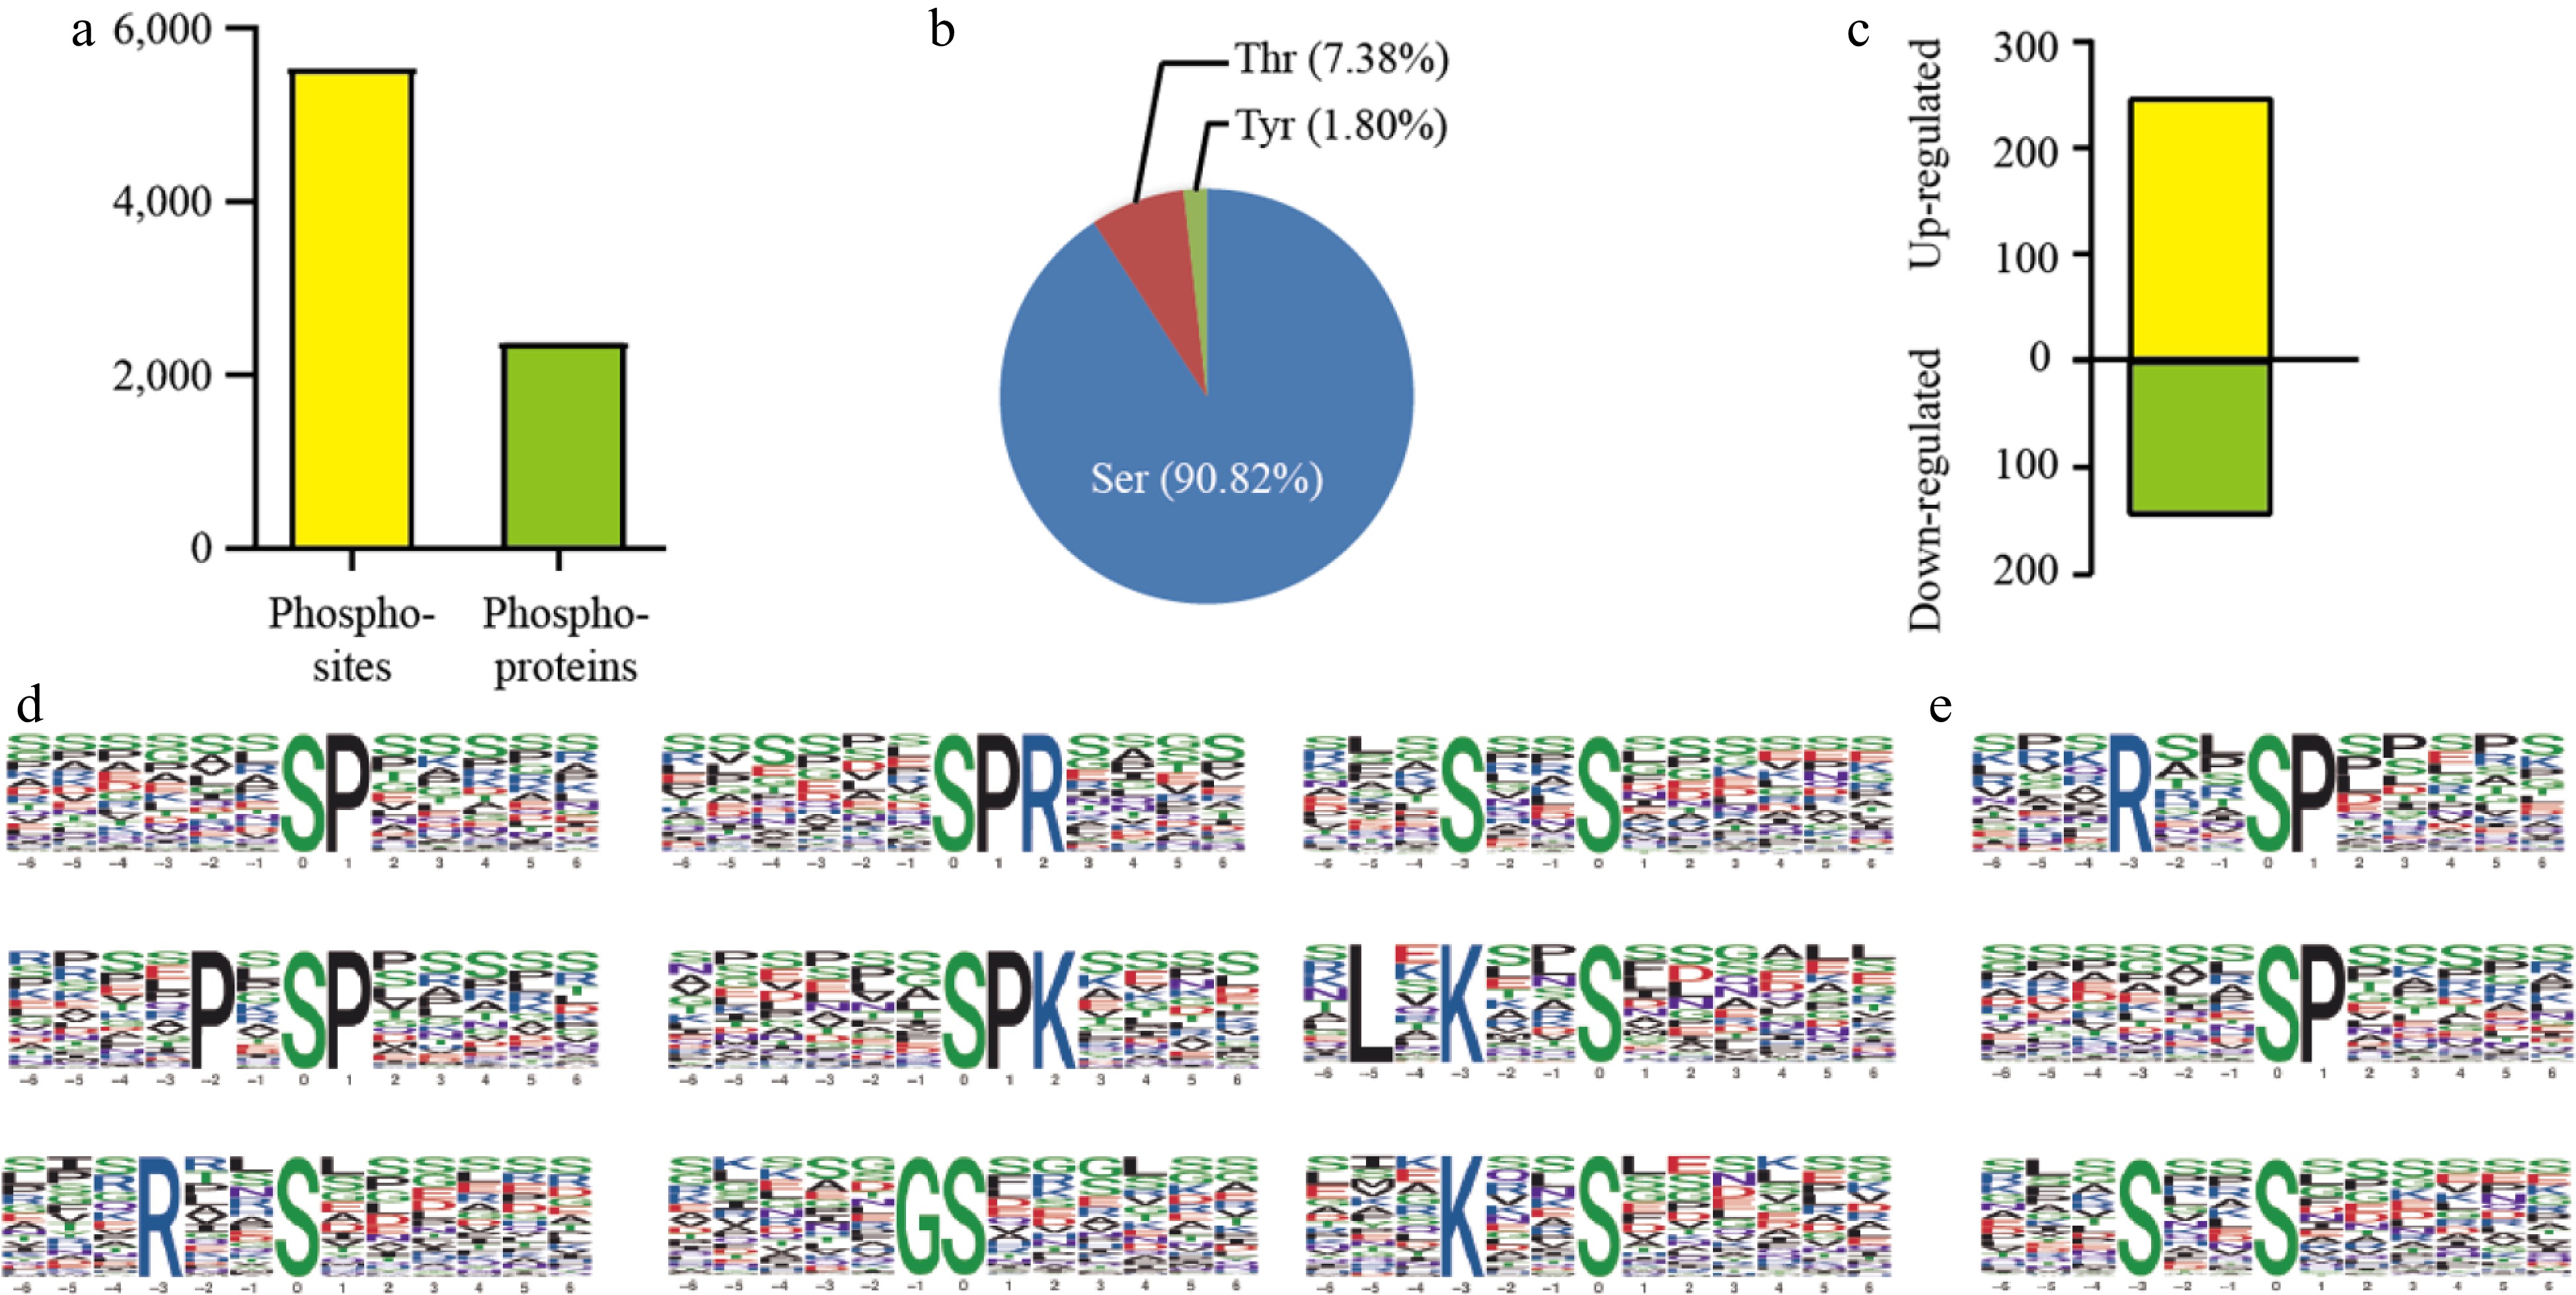
Figure 3.
Mass spectrometry analysis of phosphoproteins. (a) Statistical results of phosphoproteome identification. (b) Distribution of phosphorylated amino acids. (c) Differential enriched phosphoproteins identification. (d) Motif analysis of 246 upregulated phosphopeptides. (e) Motif analysis of 143 downregulated phosphopeptides.
-
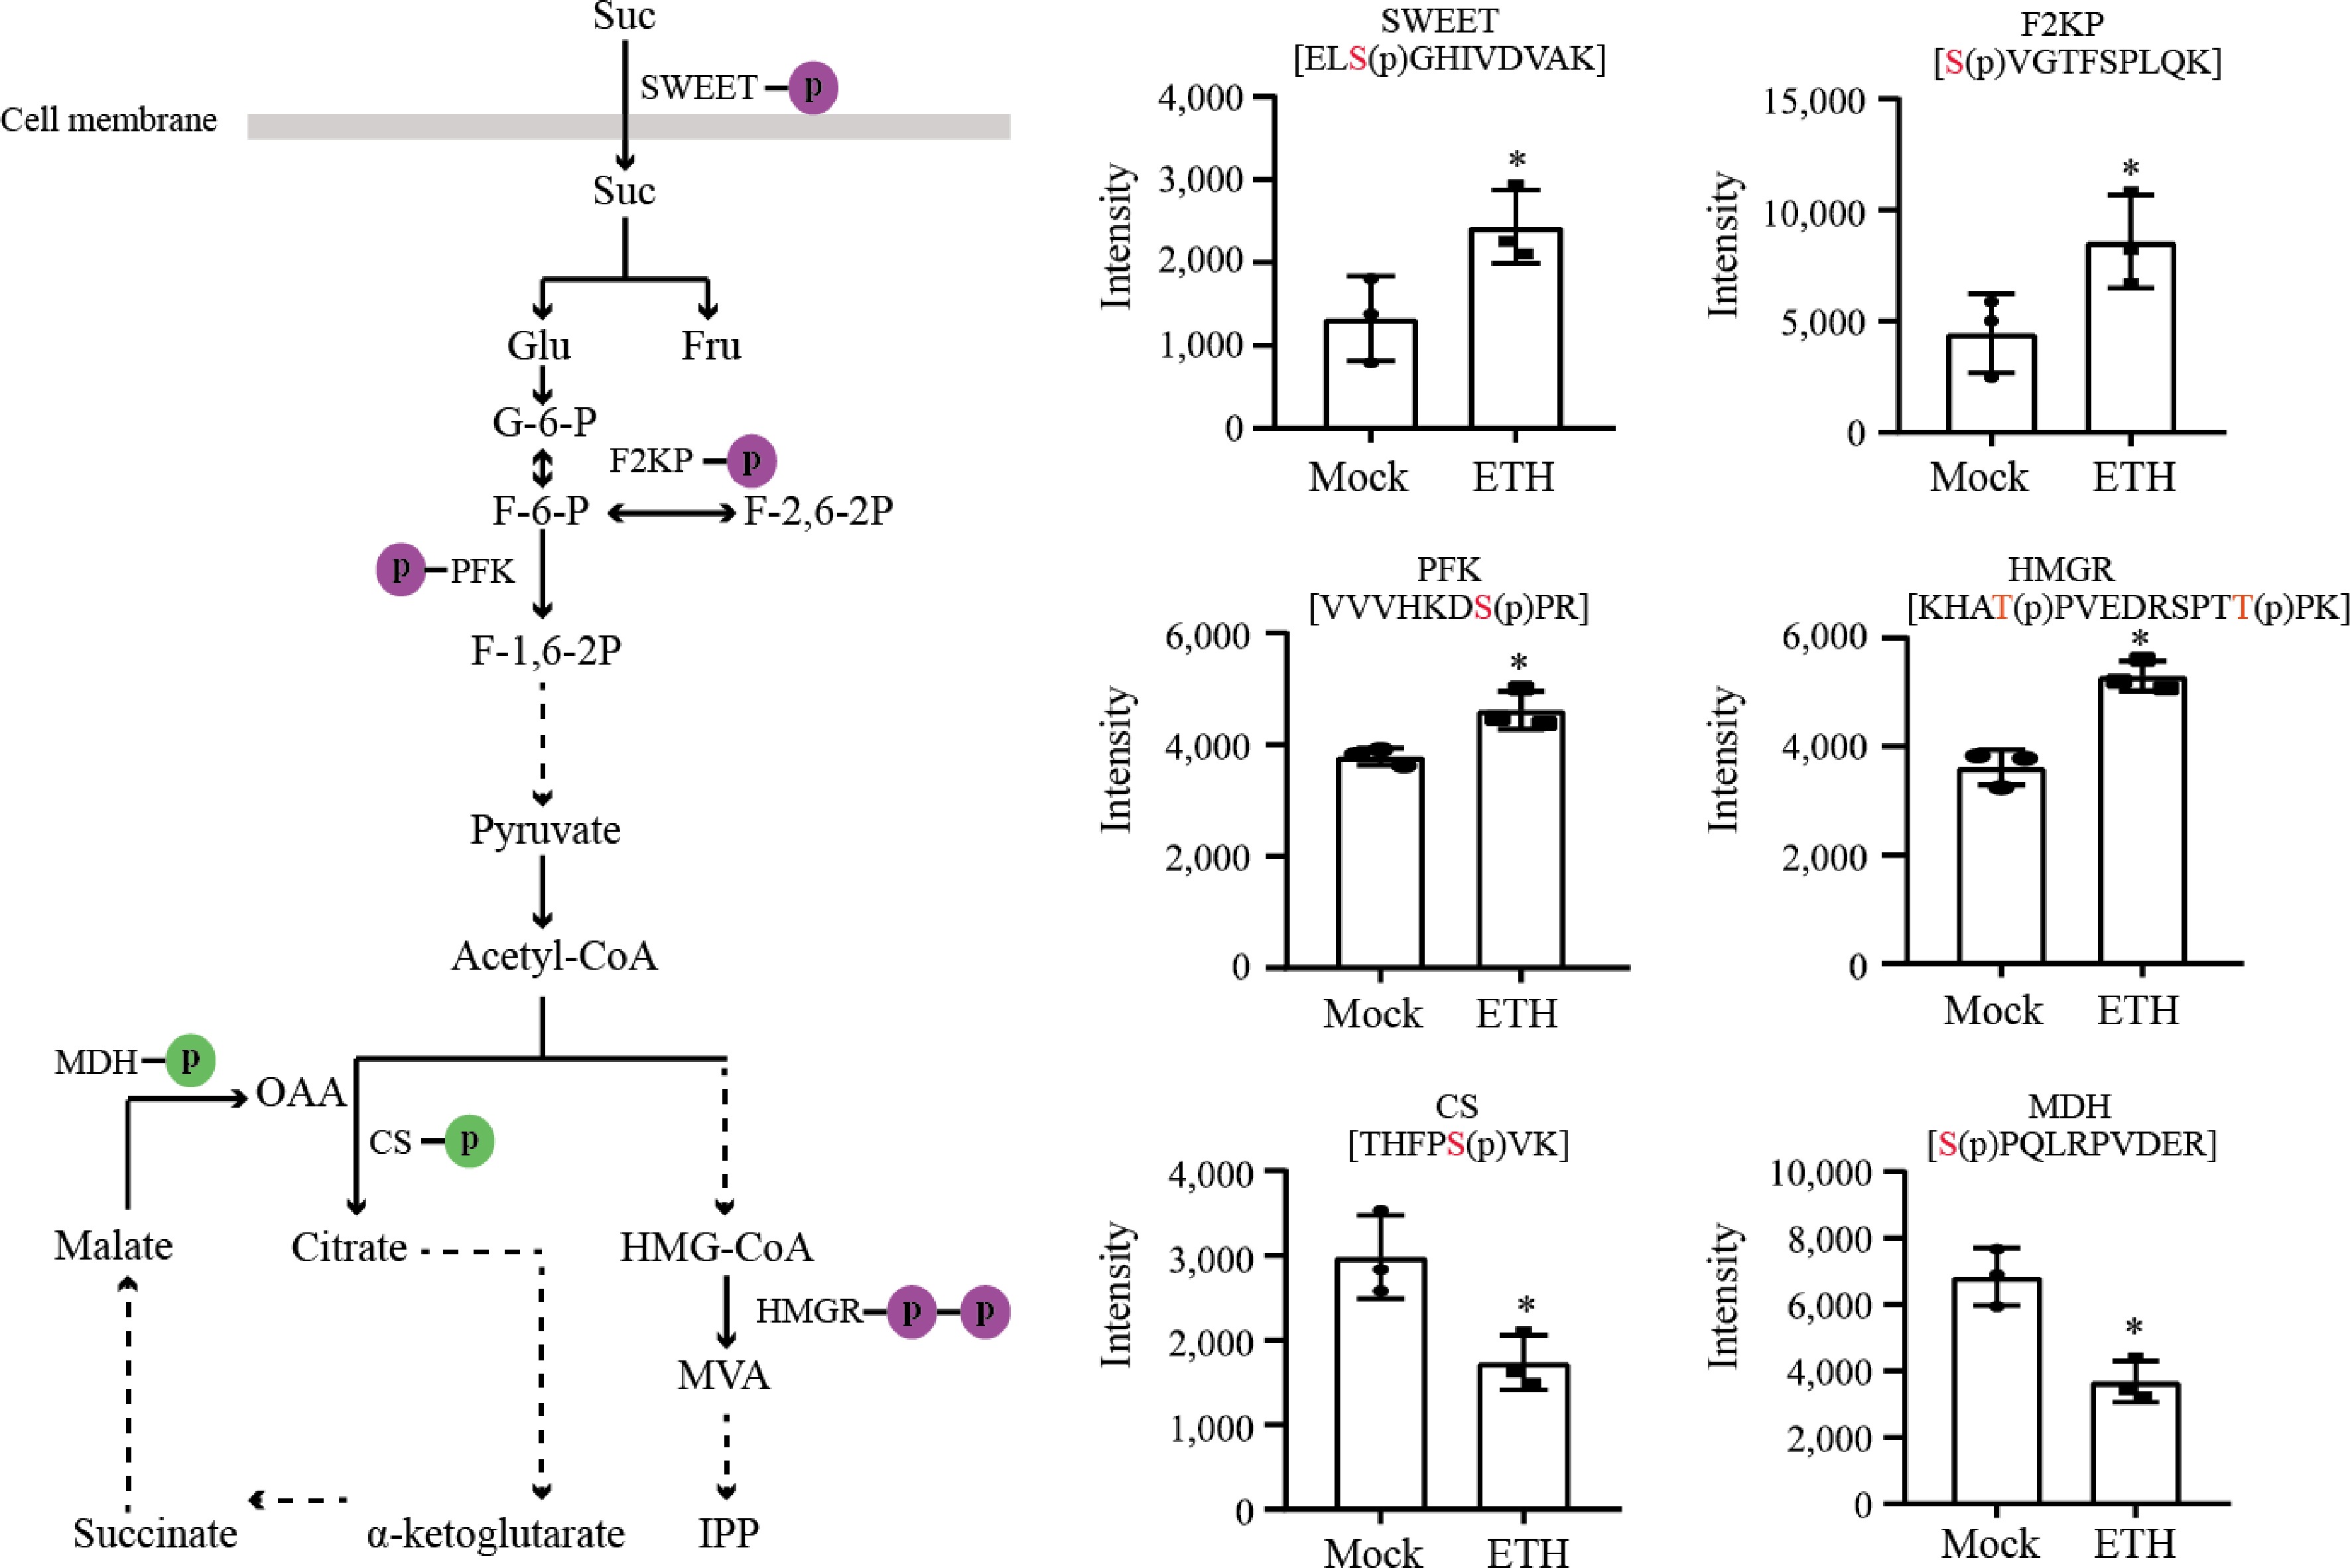
Figure 4.
Protein phosphorylation related to carbohydrate metabolism and IPP pathway. The purple circles represent phosphorylation and the green circles represent dephosphorylation. PFK, phosphofructokinase; F2KP, fructose-2,6-bisphosphatase; CS, citrate synthase; MDH, malate dehydrogenase; HMGR, hydroxymethylglutaryl-CoA reductase.
-
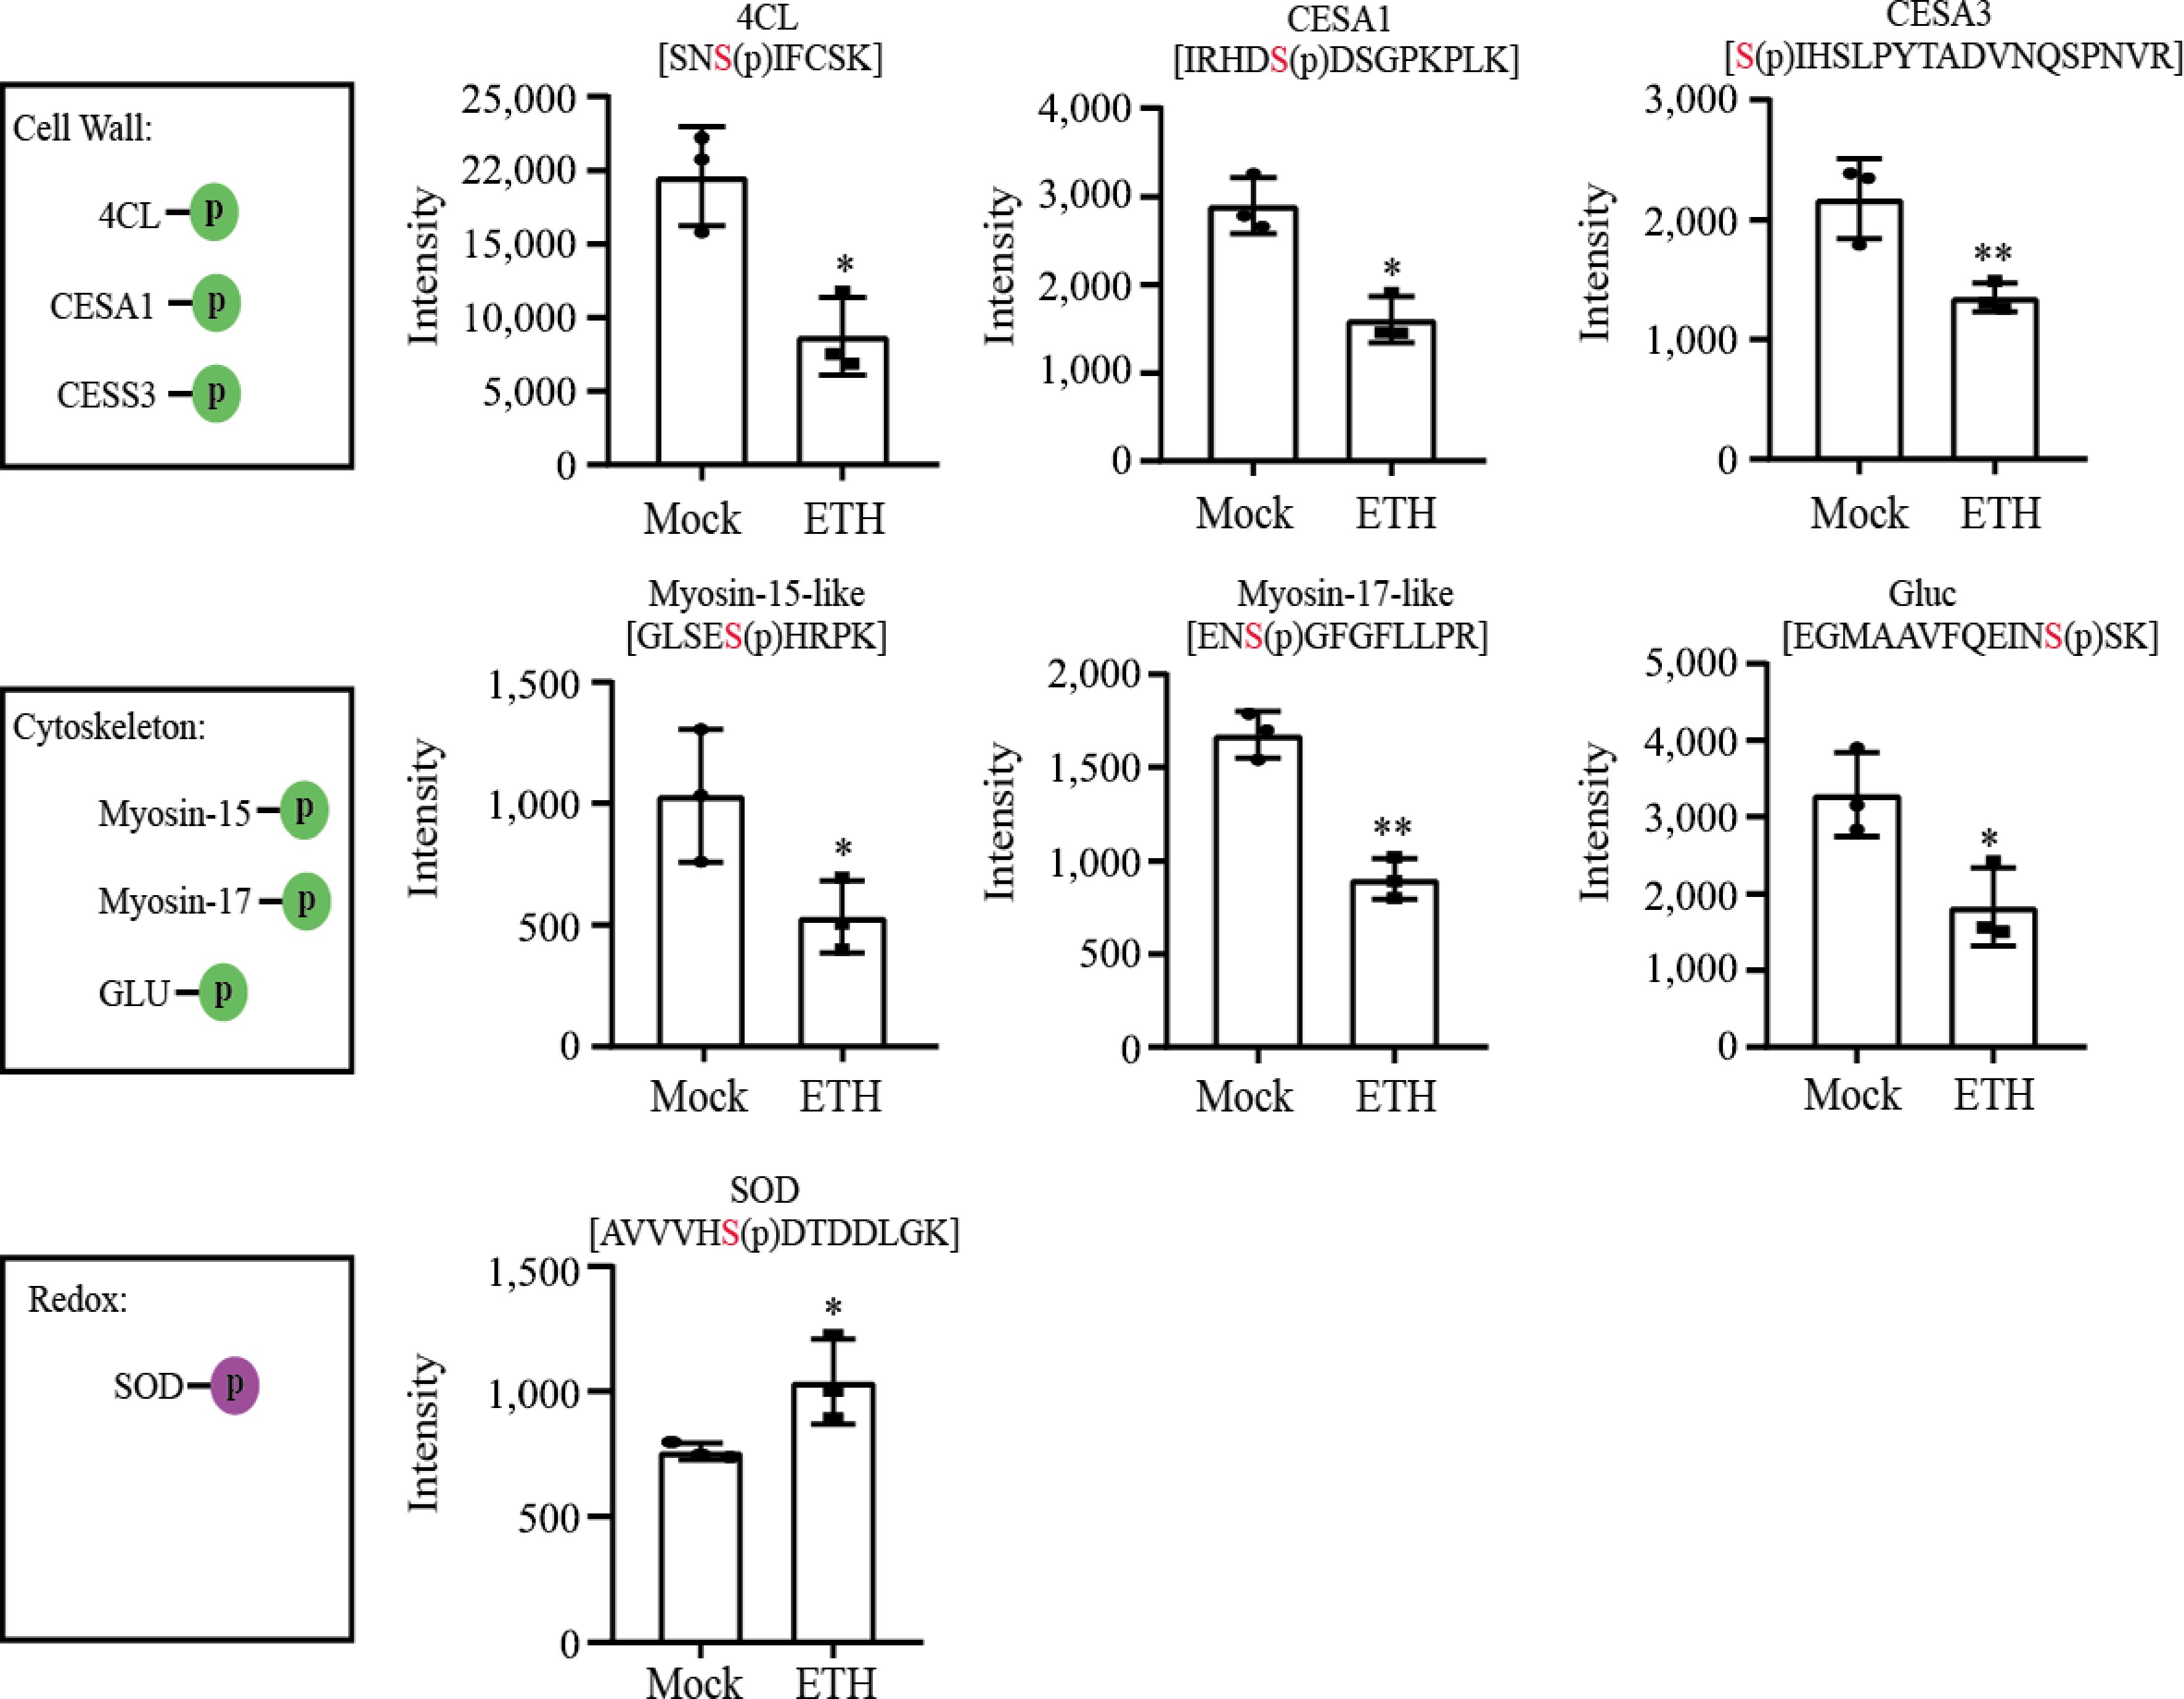
Figure 5.
Protein phosphorylation related to latex flow. The purple circle represents phosphorylation and the green circles represent dephosphorylation. CESA, Cellulose synthase, 4CL, 4-coumarate-CoA ligase; Gluc, glucan endo-1,3-beta-glucosidase; SOD, superoxide dismutase.
Figures
(5)
Tables
(0)