-
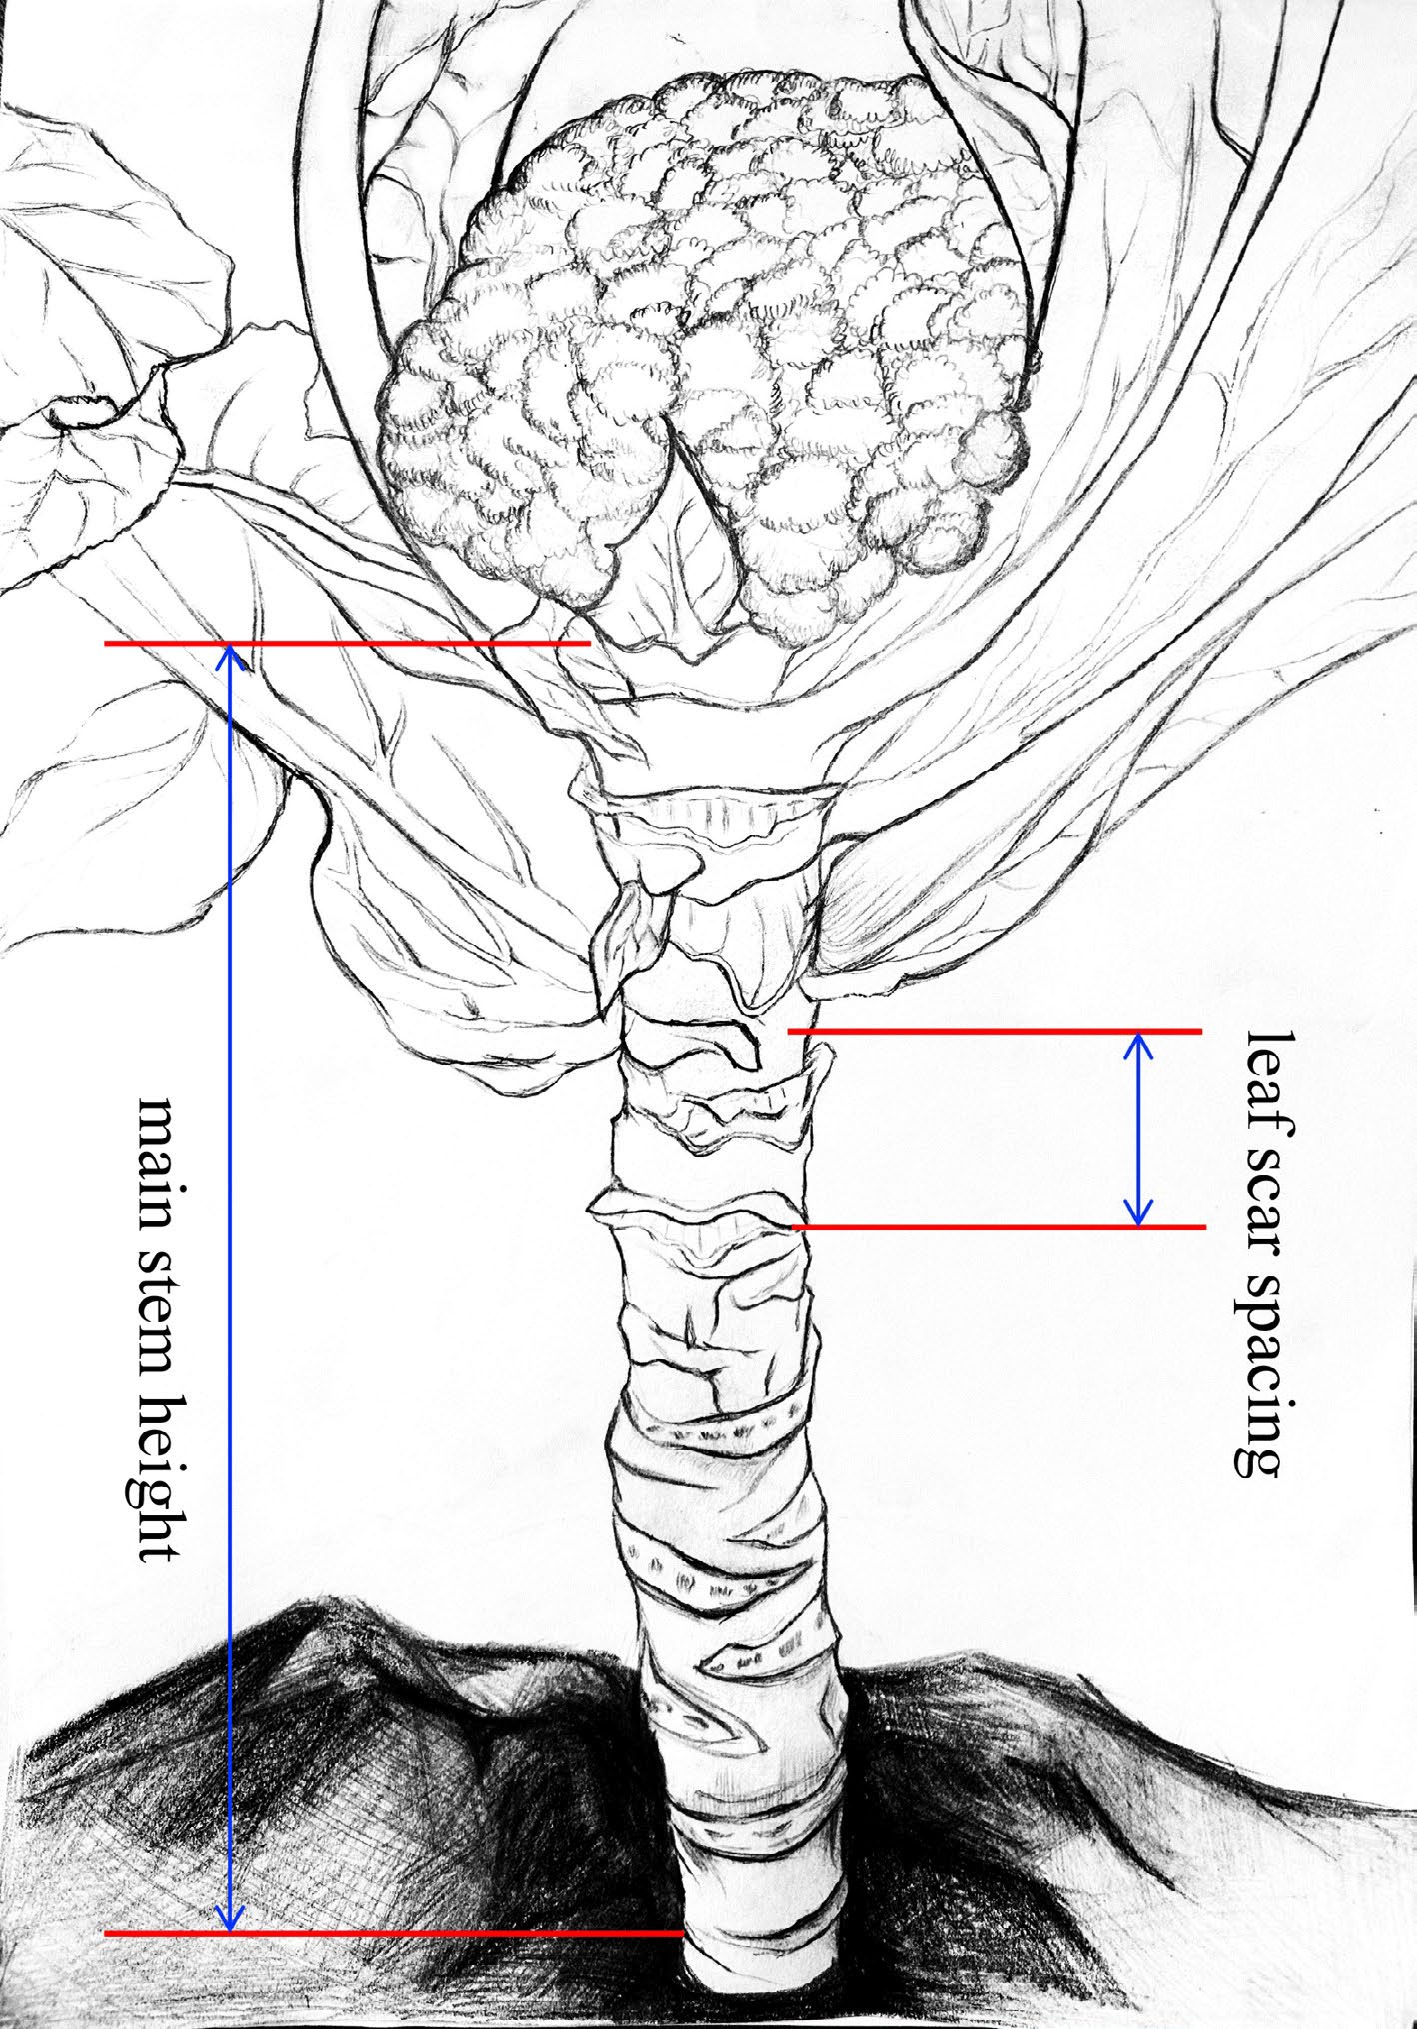
Figure 1.
Measurement criterias for the traits of main stem height (MSH) and leaf scar spacing (LSS). MSH, the length of the main stem from the first true leaf scar to the bottom of the curd or buds. LSS, the distance between the first and third leaf scars in the middle of the main stem.
-
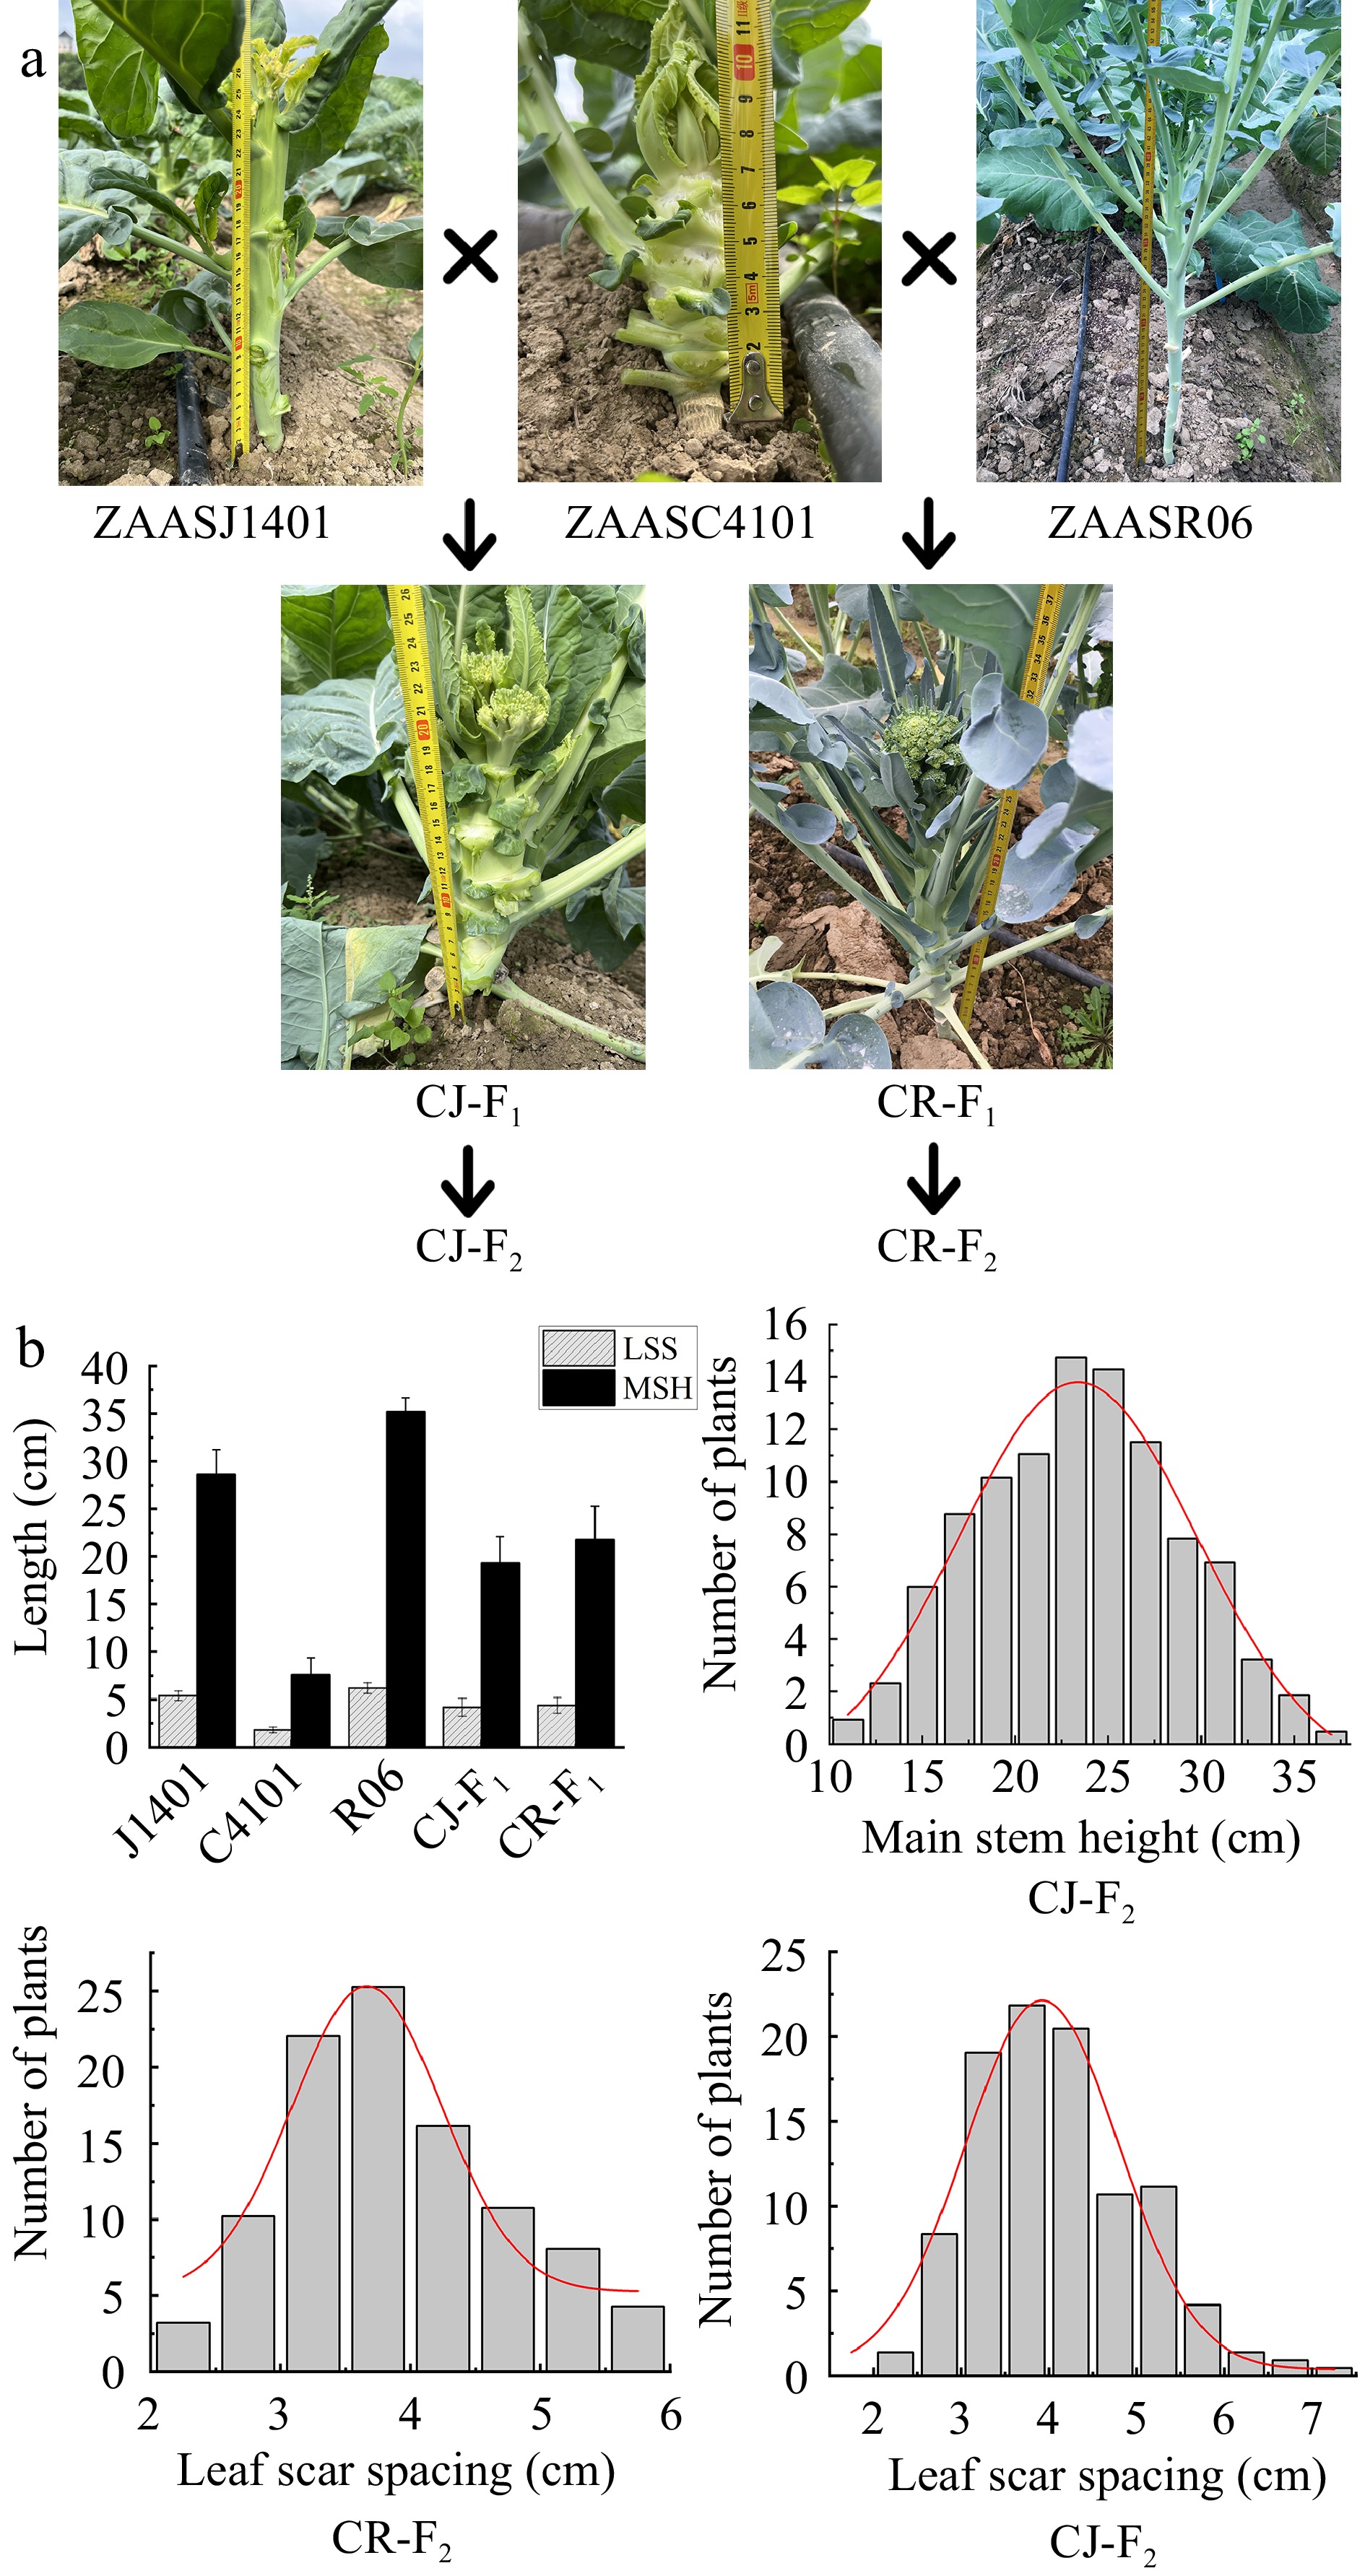
Figure 2.
The MSH and LSS phenotypes of the parents and their F2 populations. (a) The MSH and LSS phenotypes of ZAASC4101 (female parent, cauliflower with short MSH), ZAASJ1401 (male parent, Chinese kale with high MSH), ZAASR06 (male parent, broccoli landraces with high MSH) and their F1 hybrids (CJ-F1 and CR-F1). (b) Frequency distribution of MSH and LSS of the F2 individuals in the CJ-F2 population and LSS of the F2 individuals in the CR-F2 population.
-
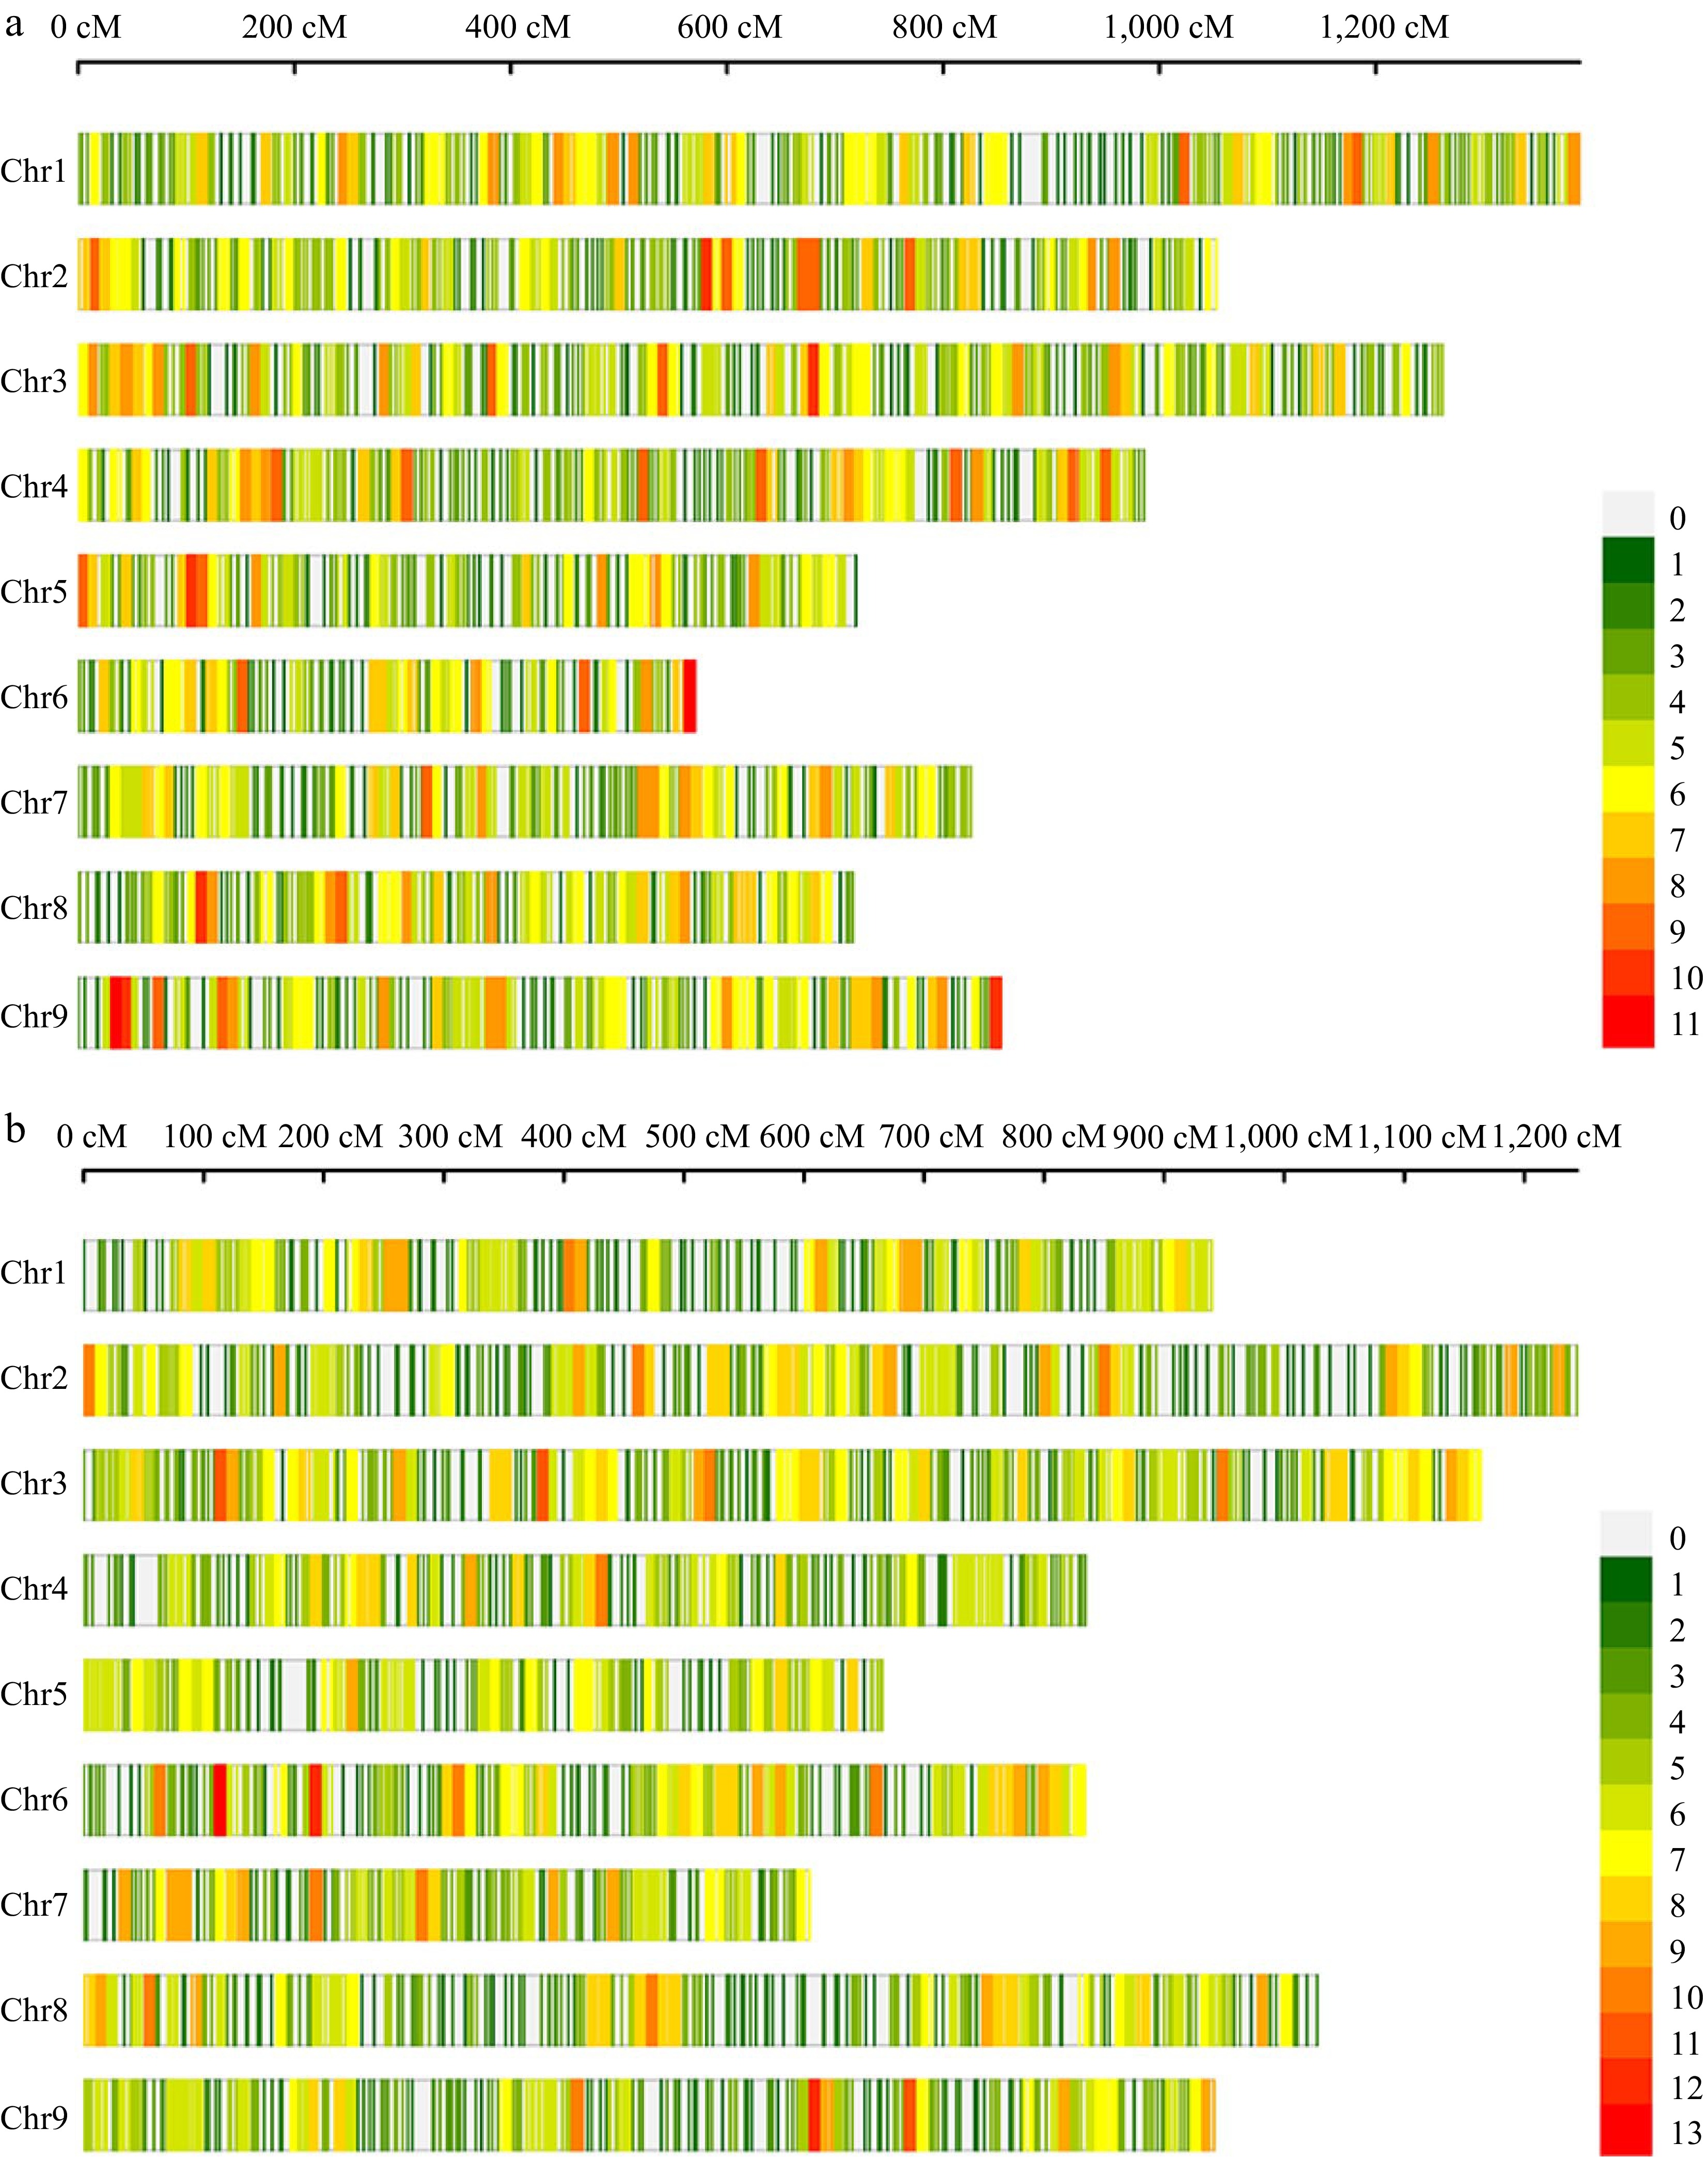
Figure 3.
High-density genetic maps constructed using a 10K chip for populations CJ-F2 and CR-F2. (a) The distribution of SNP markers on chromosomes in the CJ-F2 population. (b) The distribution of SNP markers on chromosomes in the CR-F2 population. The color represents the number of markers in the 10 cM interval.
-
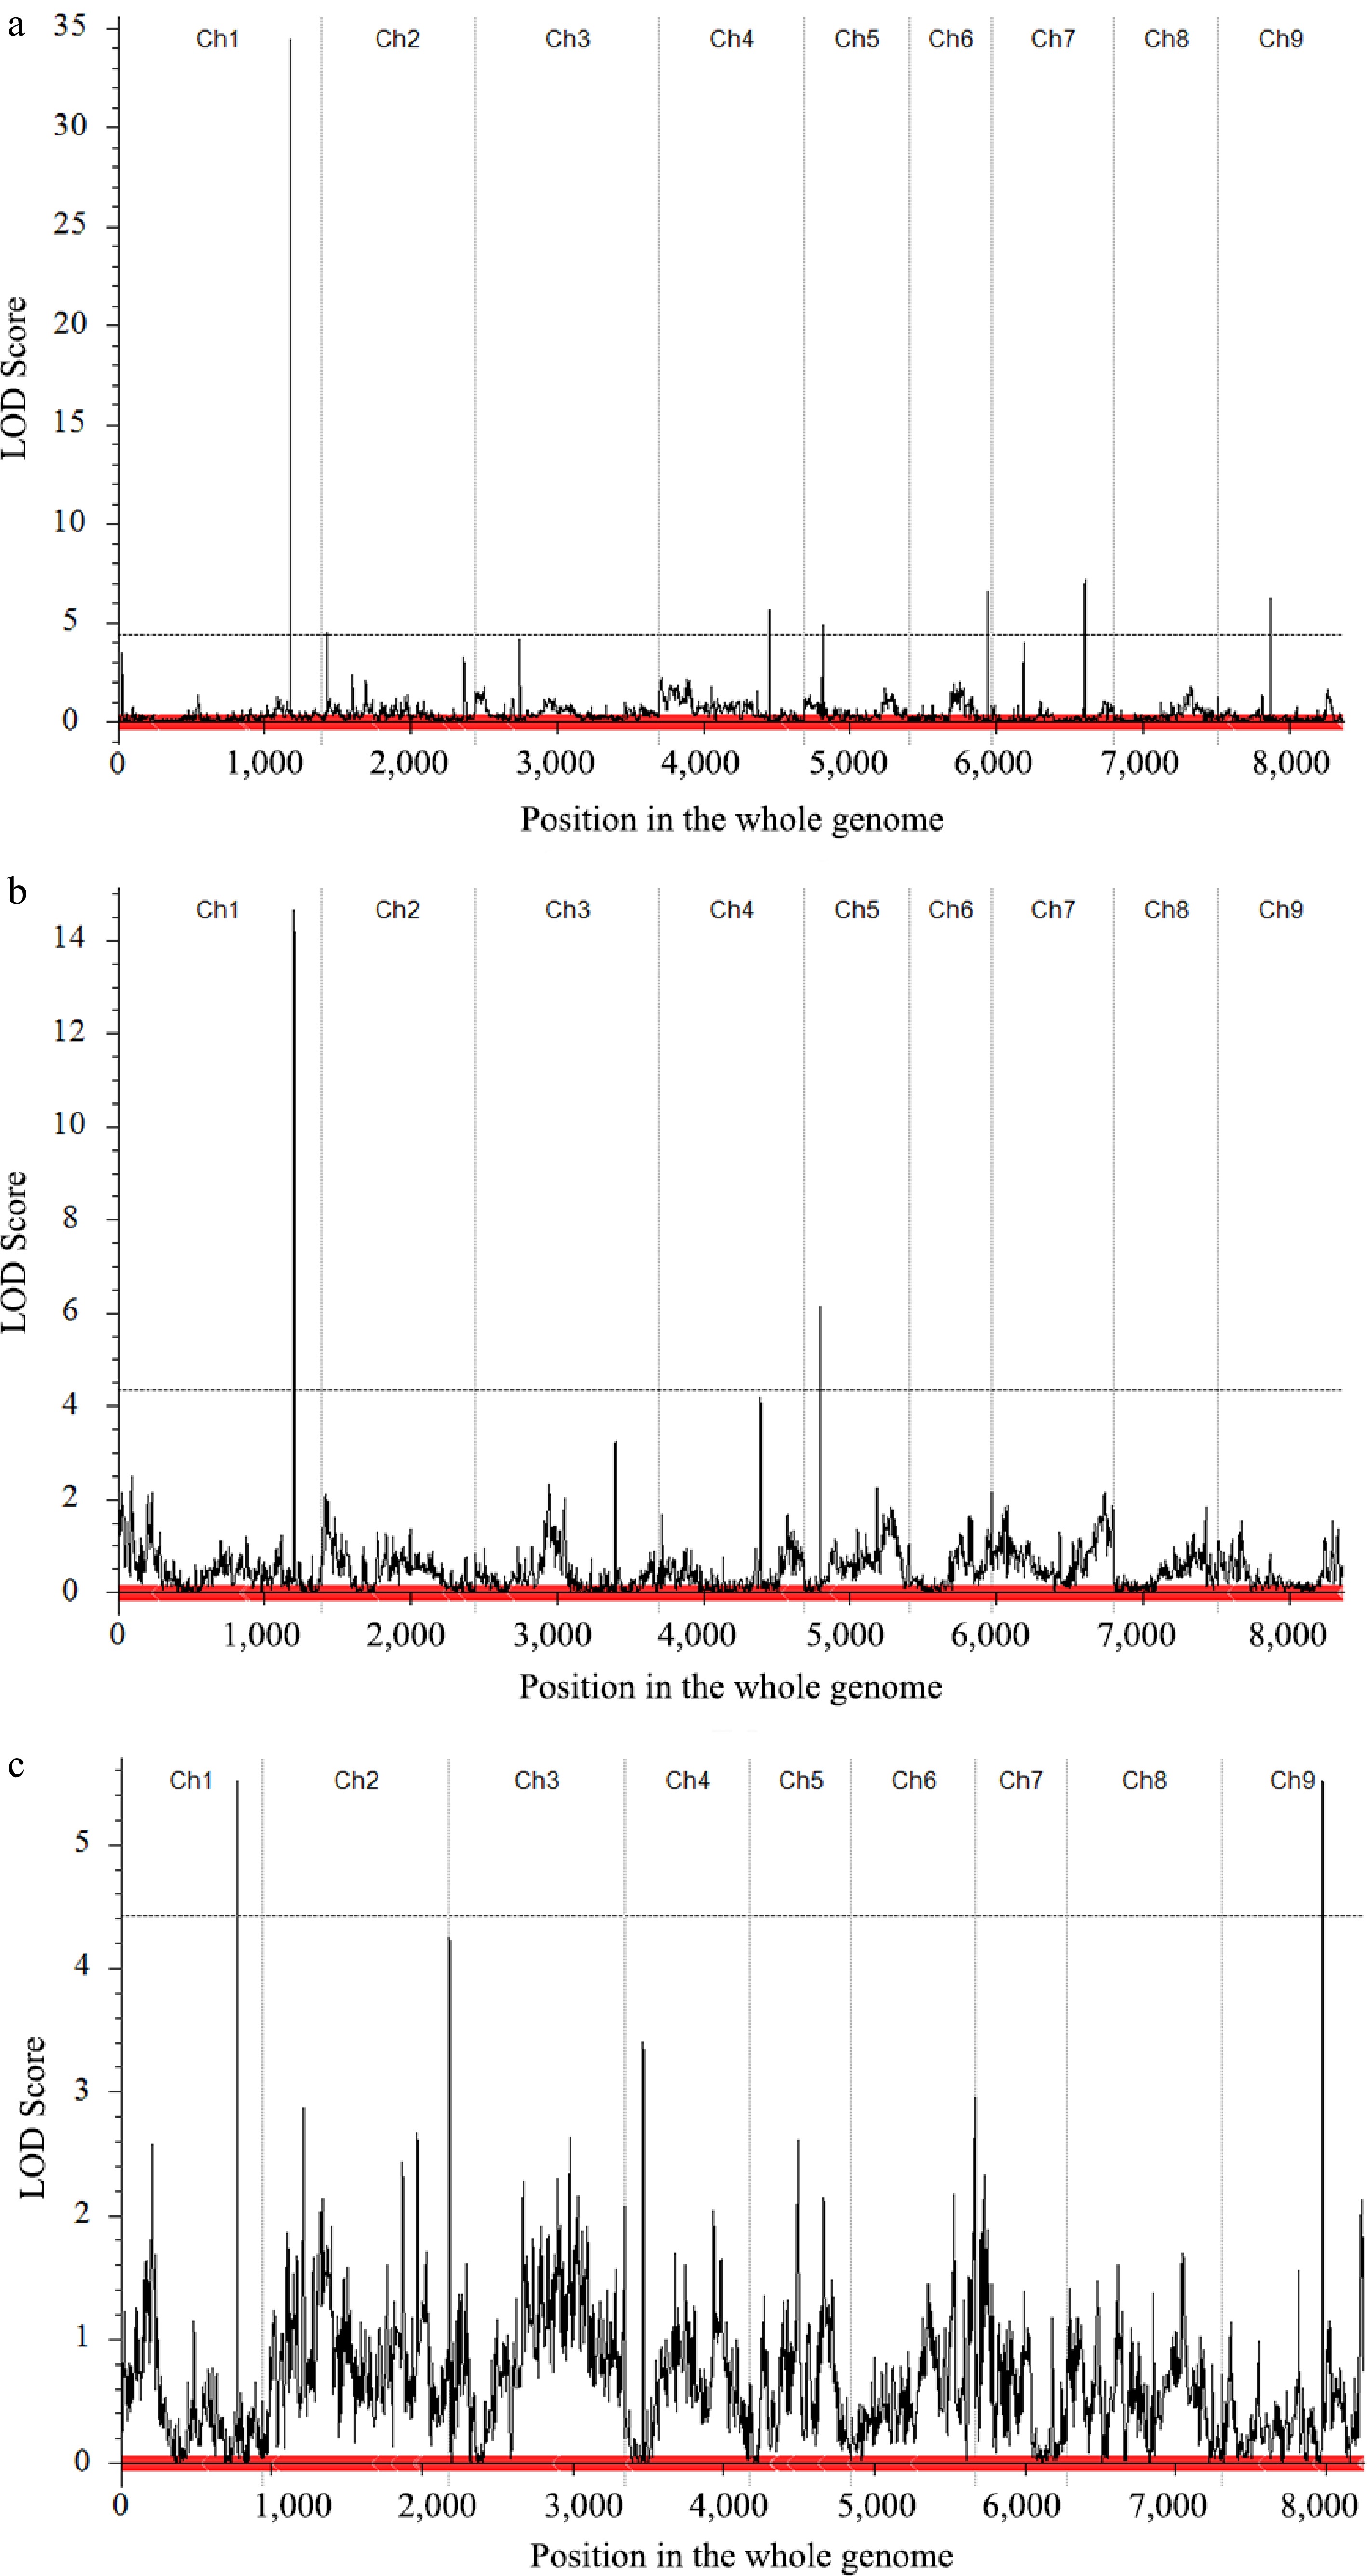
Figure 4.
Quantitative trait locus (QTL) mapping and co-localization of the curd setting height-related traits. (a) Main QTL on C01 of MSH trait in CJ-F2 population. (b) Main QTL on C01 of LSS trait in CJ-F2 population. (c) Main QTL on C01 of LSS trait in CR-F2 population.
-
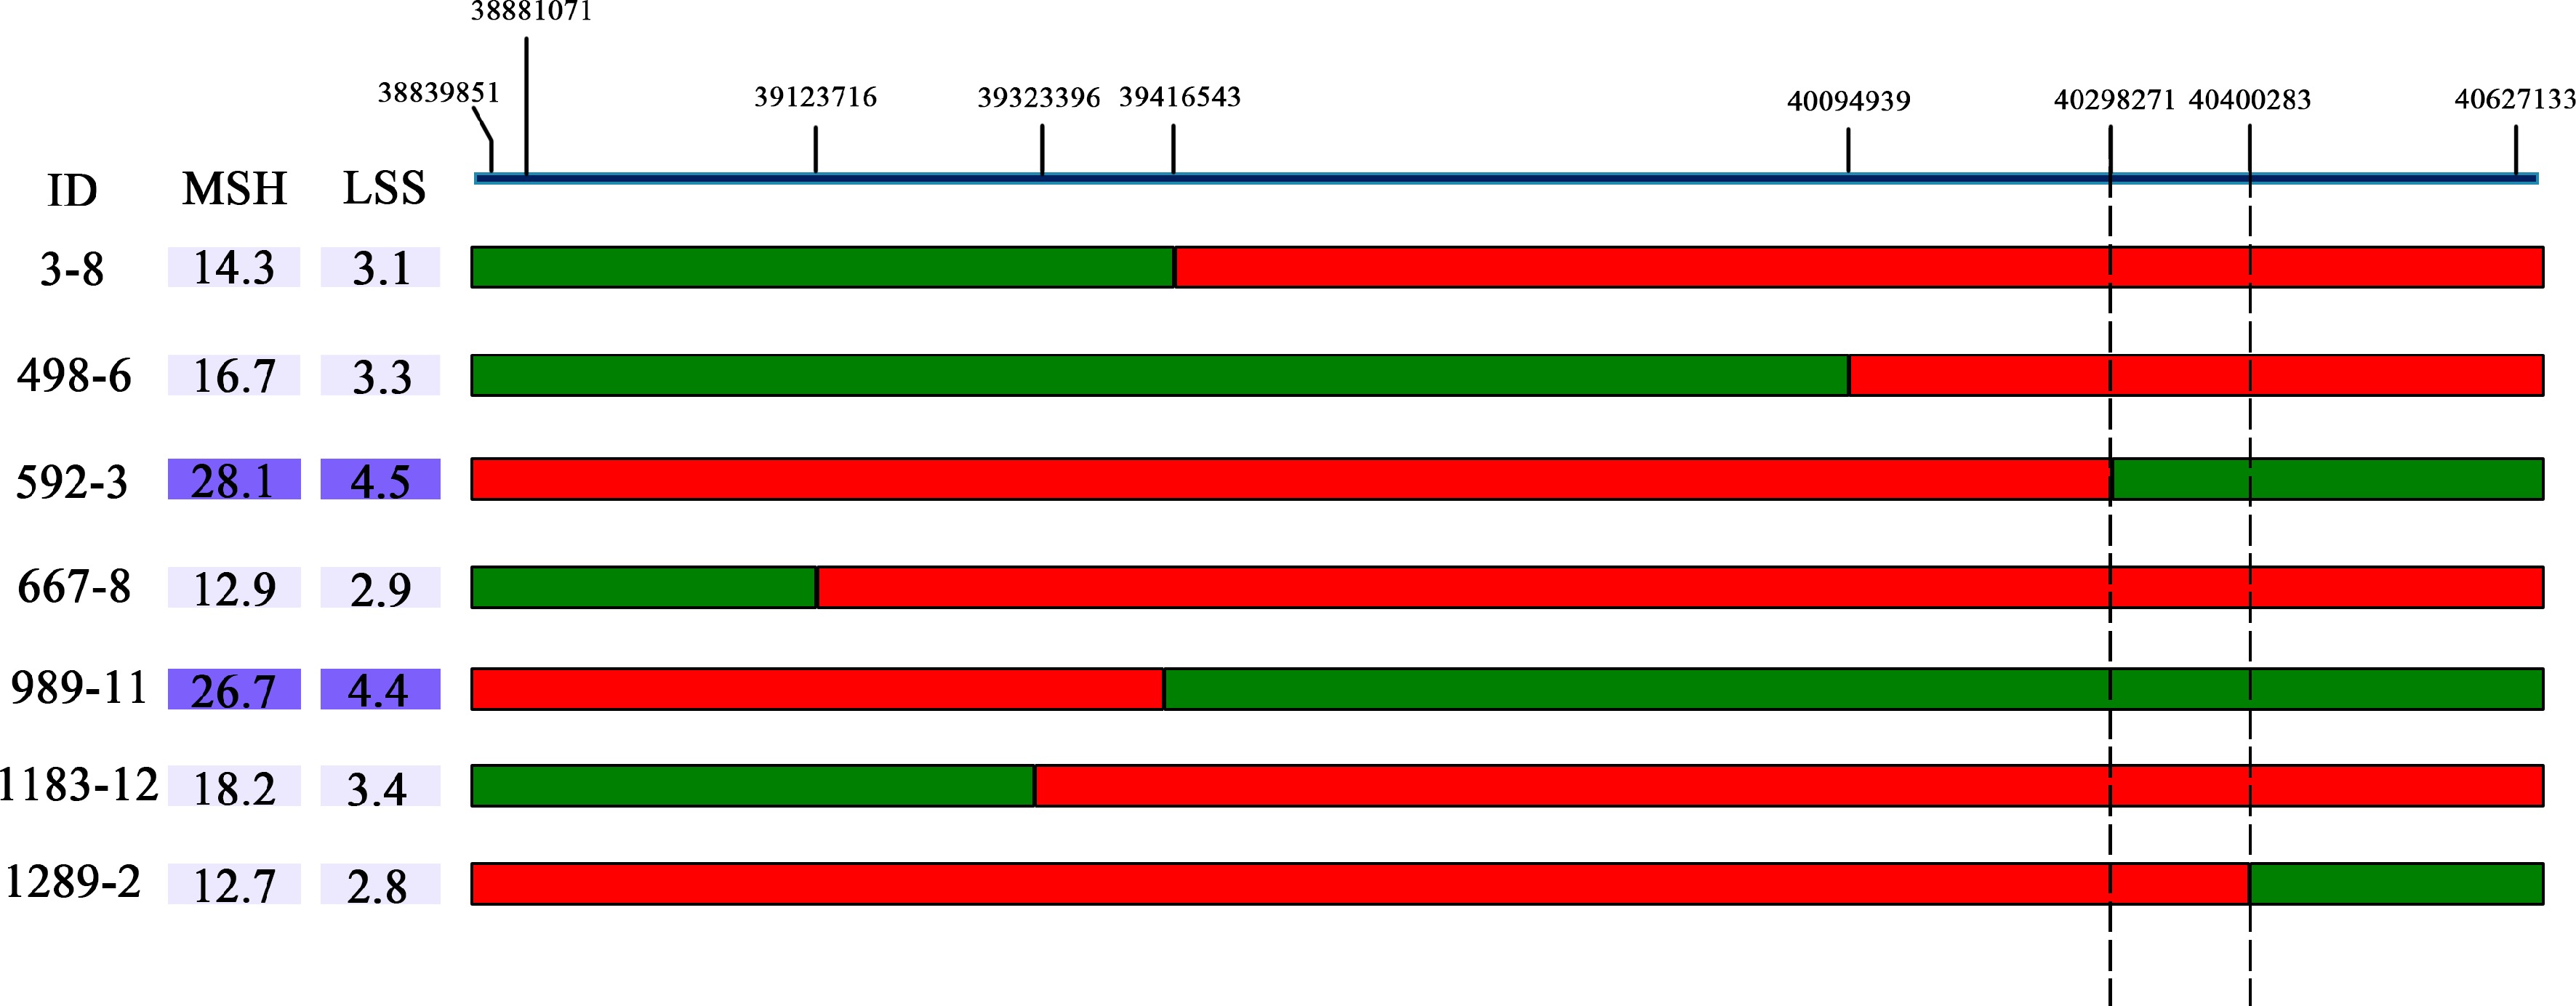
Figure 5.
The BocDWARF1 locus was fine-mapped in the 102 kb region between 40,298,271 bp and 40,400,283 bp. The green bars indicate homozygous segments from ZAASJ1401 with high MSH and red bars indicate homozygous segments from ZAASC4101 with short MSH. The ID indicates the name of recombinants from the F4 population.
-
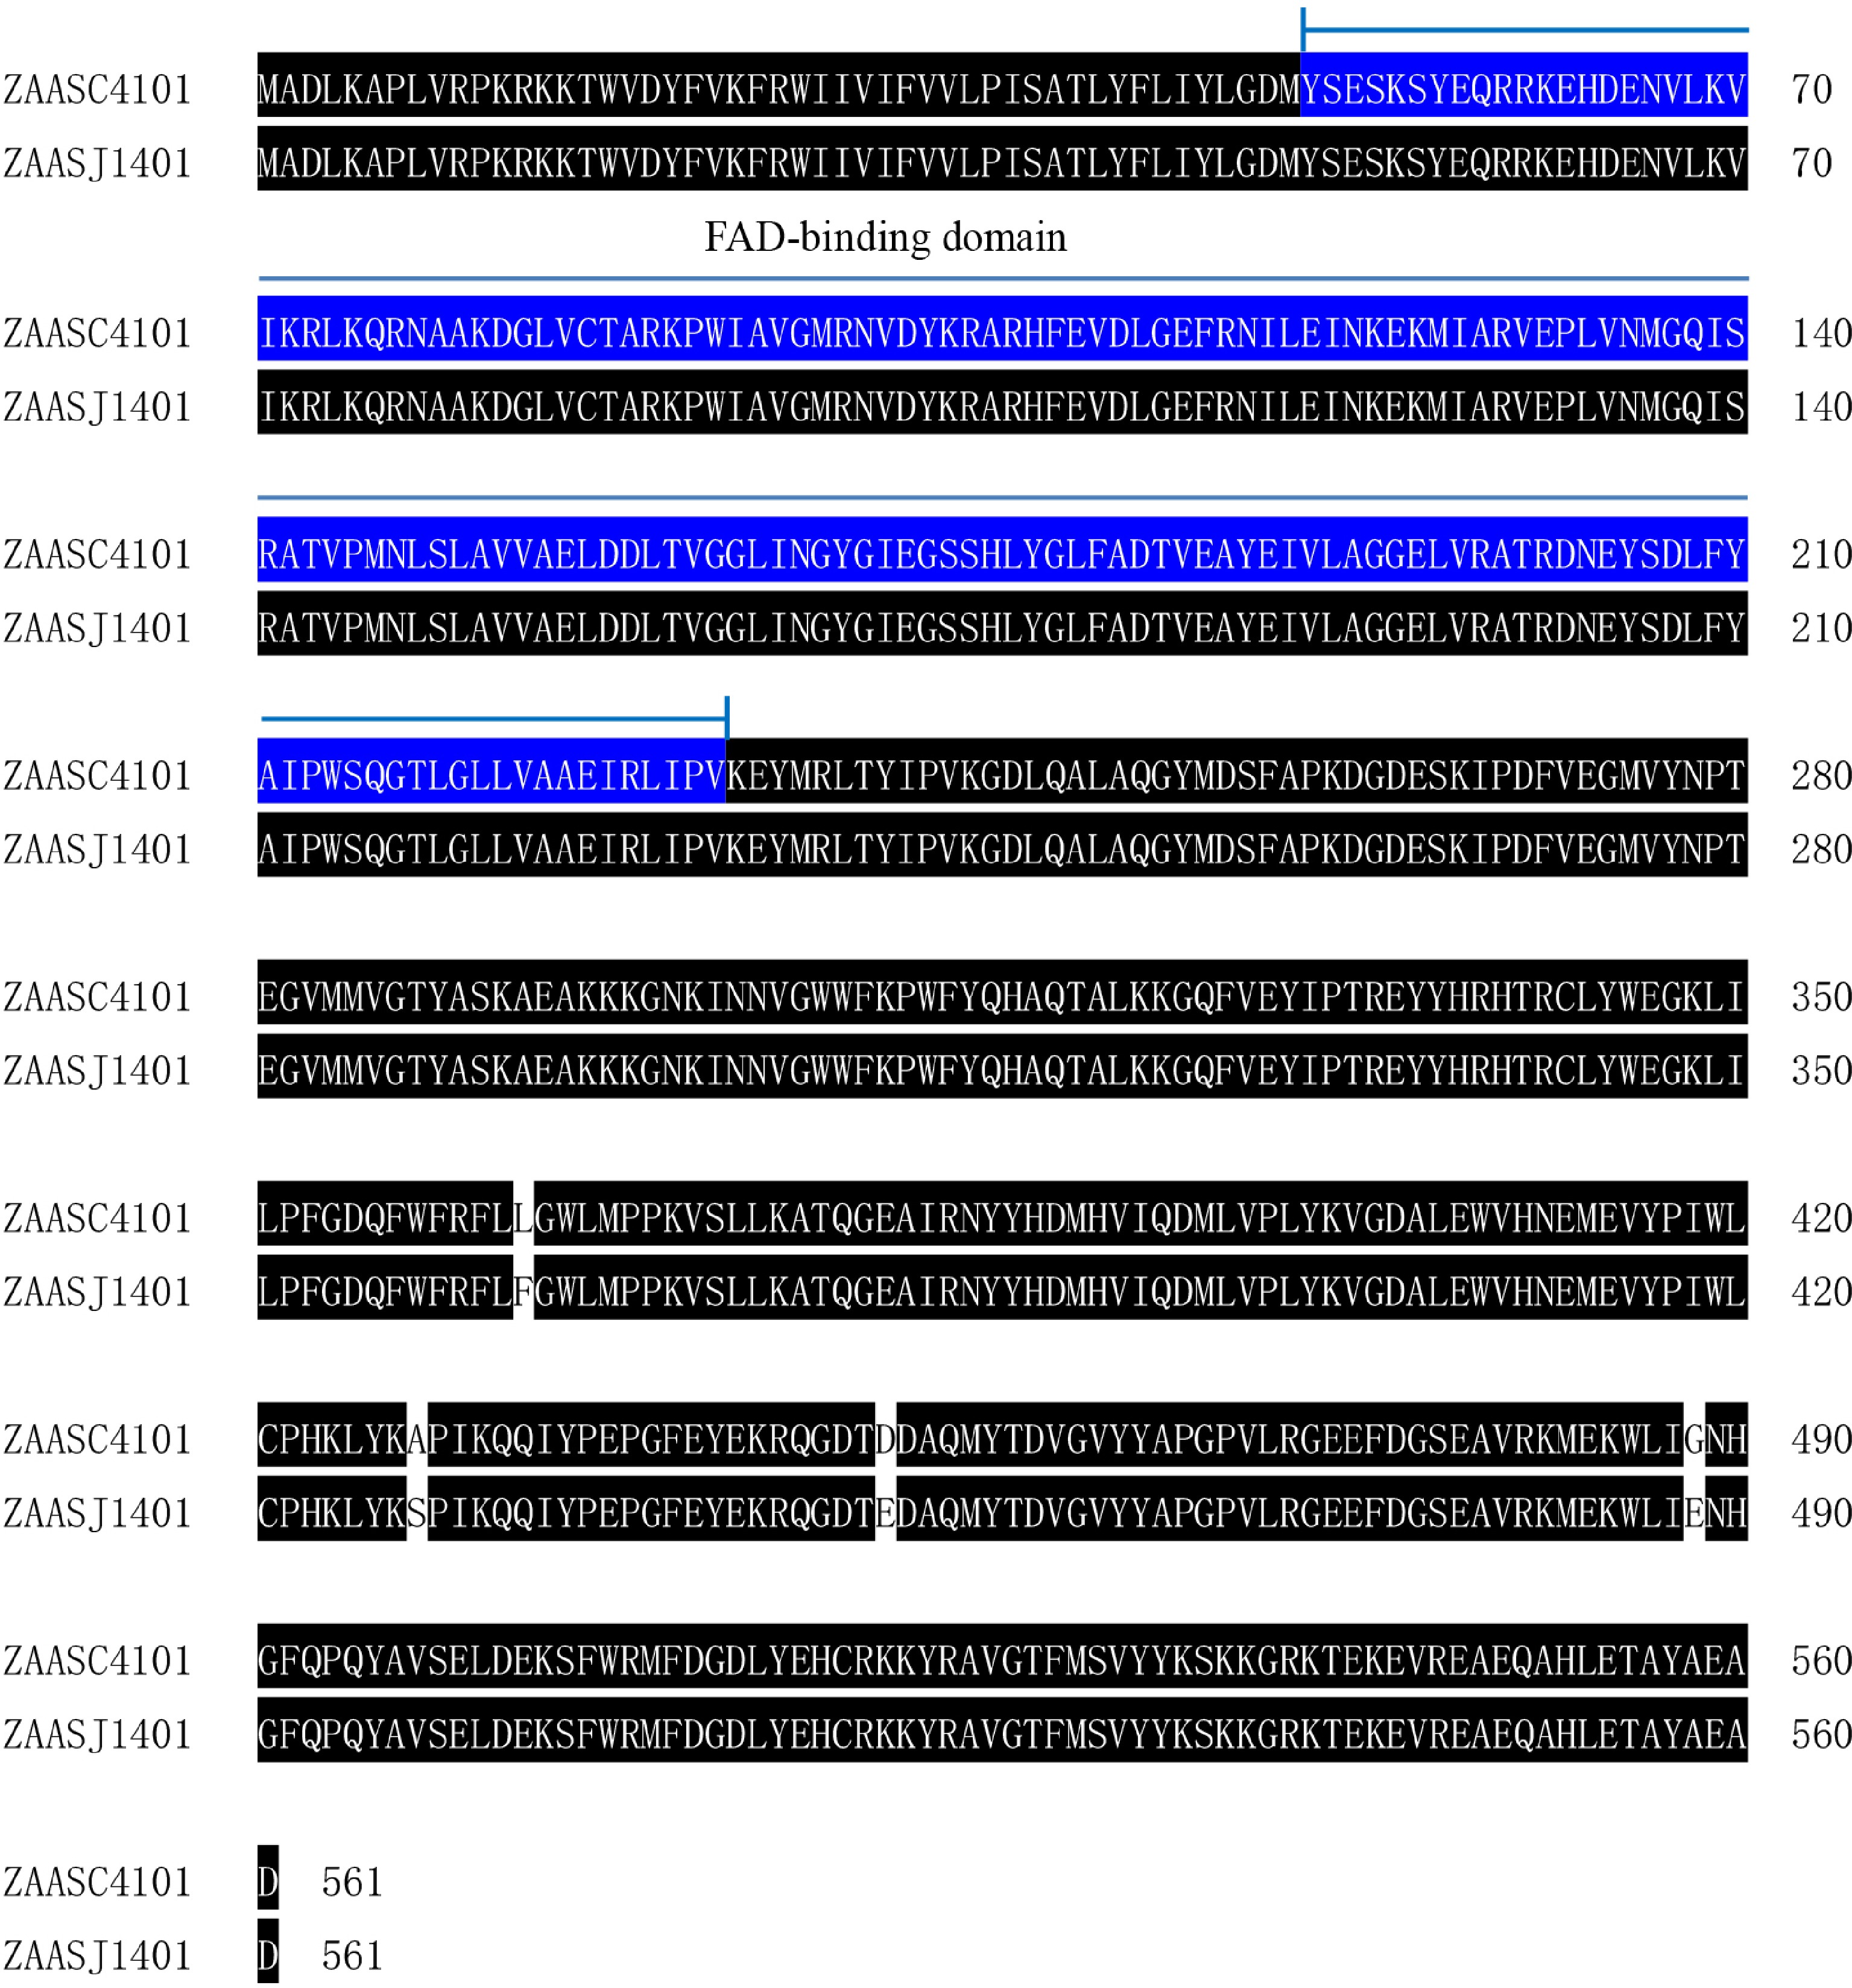
Figure 6.
Amino acid sequence differences of BolC1t04399H between parental lines. The blue background indicates the conservative FAD binding domain. There are a total of four non synonymous SNPs causing amino acid differences.
-
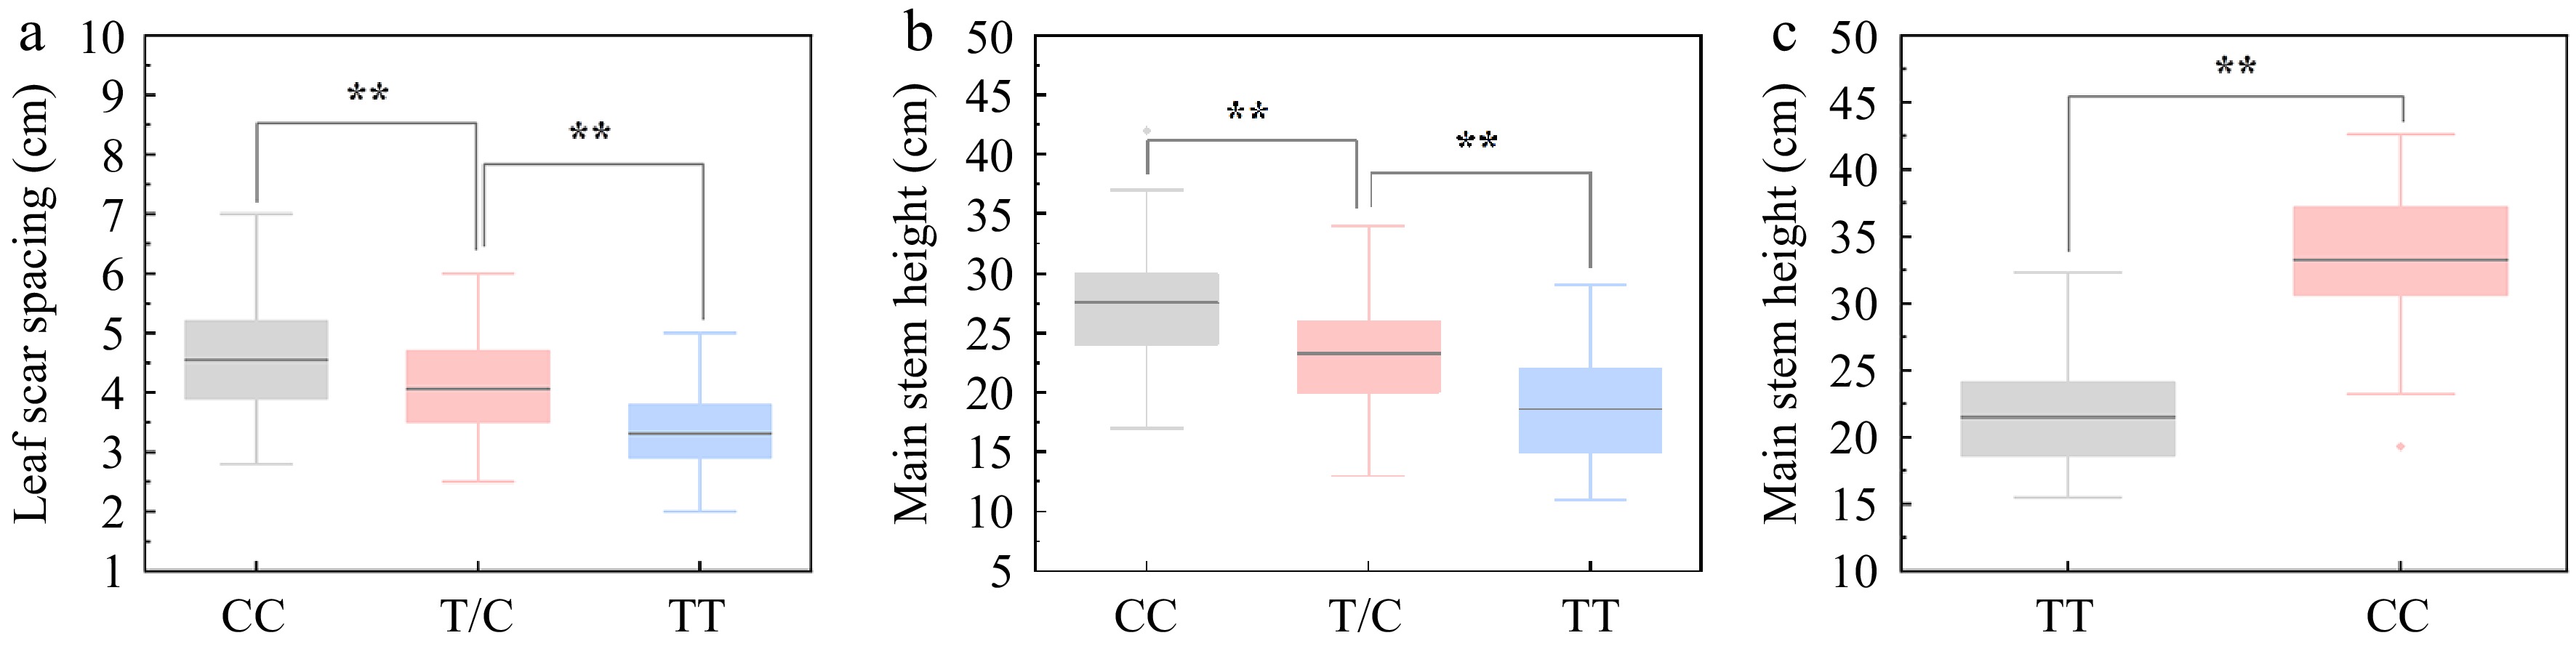
Figure 7.
Association between the genotypes at SNP40298271 locus and curd setting height (CSH) variation. (a), (b) Association analysis between genotypes at SNP40298271 locus (CC, TC and TT) and leaf scar spacing (LSS)/main stem height (MSH) in 218 individuals of CJ-F2 population. (c) Association analysis between genotypes at SNP40298271 locus (CC and TT) and MSH in 38 germplasm accessions.
-
Trait Populationa Parents F1 F2 populations Female Male Meanb ± SDc Ranged Mean ± SD Skewnesse Kurtosisf MSH CJ 7.62 ± 1.79 28.61 ± 3.03 19.37 ± 3.97 11.00−37.00 22.96 ± 5.46 0.067 −0.49 CR 7.62 ± 1.79 35.22 ± 2.92 21.81 ± 3.64 / / / / LSS CJ 1.79 ± 0.29 5.47 ± 0.49 4.23 ± 0.64 2.00−7.00 3.98 ± 0.94 0.56 0.21 CR 1.79 ± 0.29 6.21 ± 0.55 4.41 ± 0.62 2.10−5.90 3.82 ± 0.82 0.34 −0.43 a Population: CJ, ♀ZAASC4101 × ♂ZAASJ1401; CR, ♀ZAASC4101 × ♂ZAASCR06. b Mean (cm): The average value of phenotypic data from ten. c SD: Standard deviation of the phenotypic trait. d Range: The interval of phenotypic data of two F2 populations. e Skewness: Skewness of the phenotypic trait. f Kurtosis: Kurtosis of the phenotypic trait. Table 1.
Statistical analysis of MSH and LSS for the F2 population and their parents.
-
Trait Population Identified QTL Chr.a Position CIb (cM) Physical interval (kb) LODc PVE (%)d Add.e MSH CJ-F2 qCJMSH.C01-1 C01 1,182 1,181.5−1,182.5 40,144−40,154 32.80 32.99 −4.37 qCJMSH.C02-1 C02 44 41.5−45.5 4,282−4,552 4.47 3.05 −1.35 qCJMSH.C04-1 C04 752 748.5−752.5 52,941−52,862 6.50 3.90 −1.43 qCJMSH.C05-1 C05 130 127.5−130.5 9,370−9,580 4.97 3.76 −1.51 qCJMSH.C06-1 C06 536 535.5−538.5 43,467−43,548 7.33 4.63 −1.73 qCJMSH.C07-1 C07 637 627.5−637.5 47,752−47,545 7.09 5.03 1.79 qCJMSH.C09-1 C09 360 355.5−360.5 19,188−19,188 5.21 4.37 −1.44 LSS CJ-F2 qCJLSS.C01-1 C01 1,205 1,181.5−1,183.5 40,144−40,277 14.66 23.48 −0.57 qCJLSS.C05-1 C05 110 203.5−211.5 6,824−7,020 6.13 8.96 −0.40 CR-F2 qCRLSS.C01-1 C01 777 774.5−779.5 38,823−40,682 5.52 10.02 −0.40 qCRLSS.C09-1 C09 669 664.5−674.5 49,244−49,346 5.52 9.97 −0.40 a Chromosome. b Confidence interval. c Logarithm of odds. d Phenotypic variation explained by the identified QTL. e Phenotypic variation explained by additive effect. Table 2.
Summary of the identified QTLs detected.
Figures
(7)
Tables
(2)