-
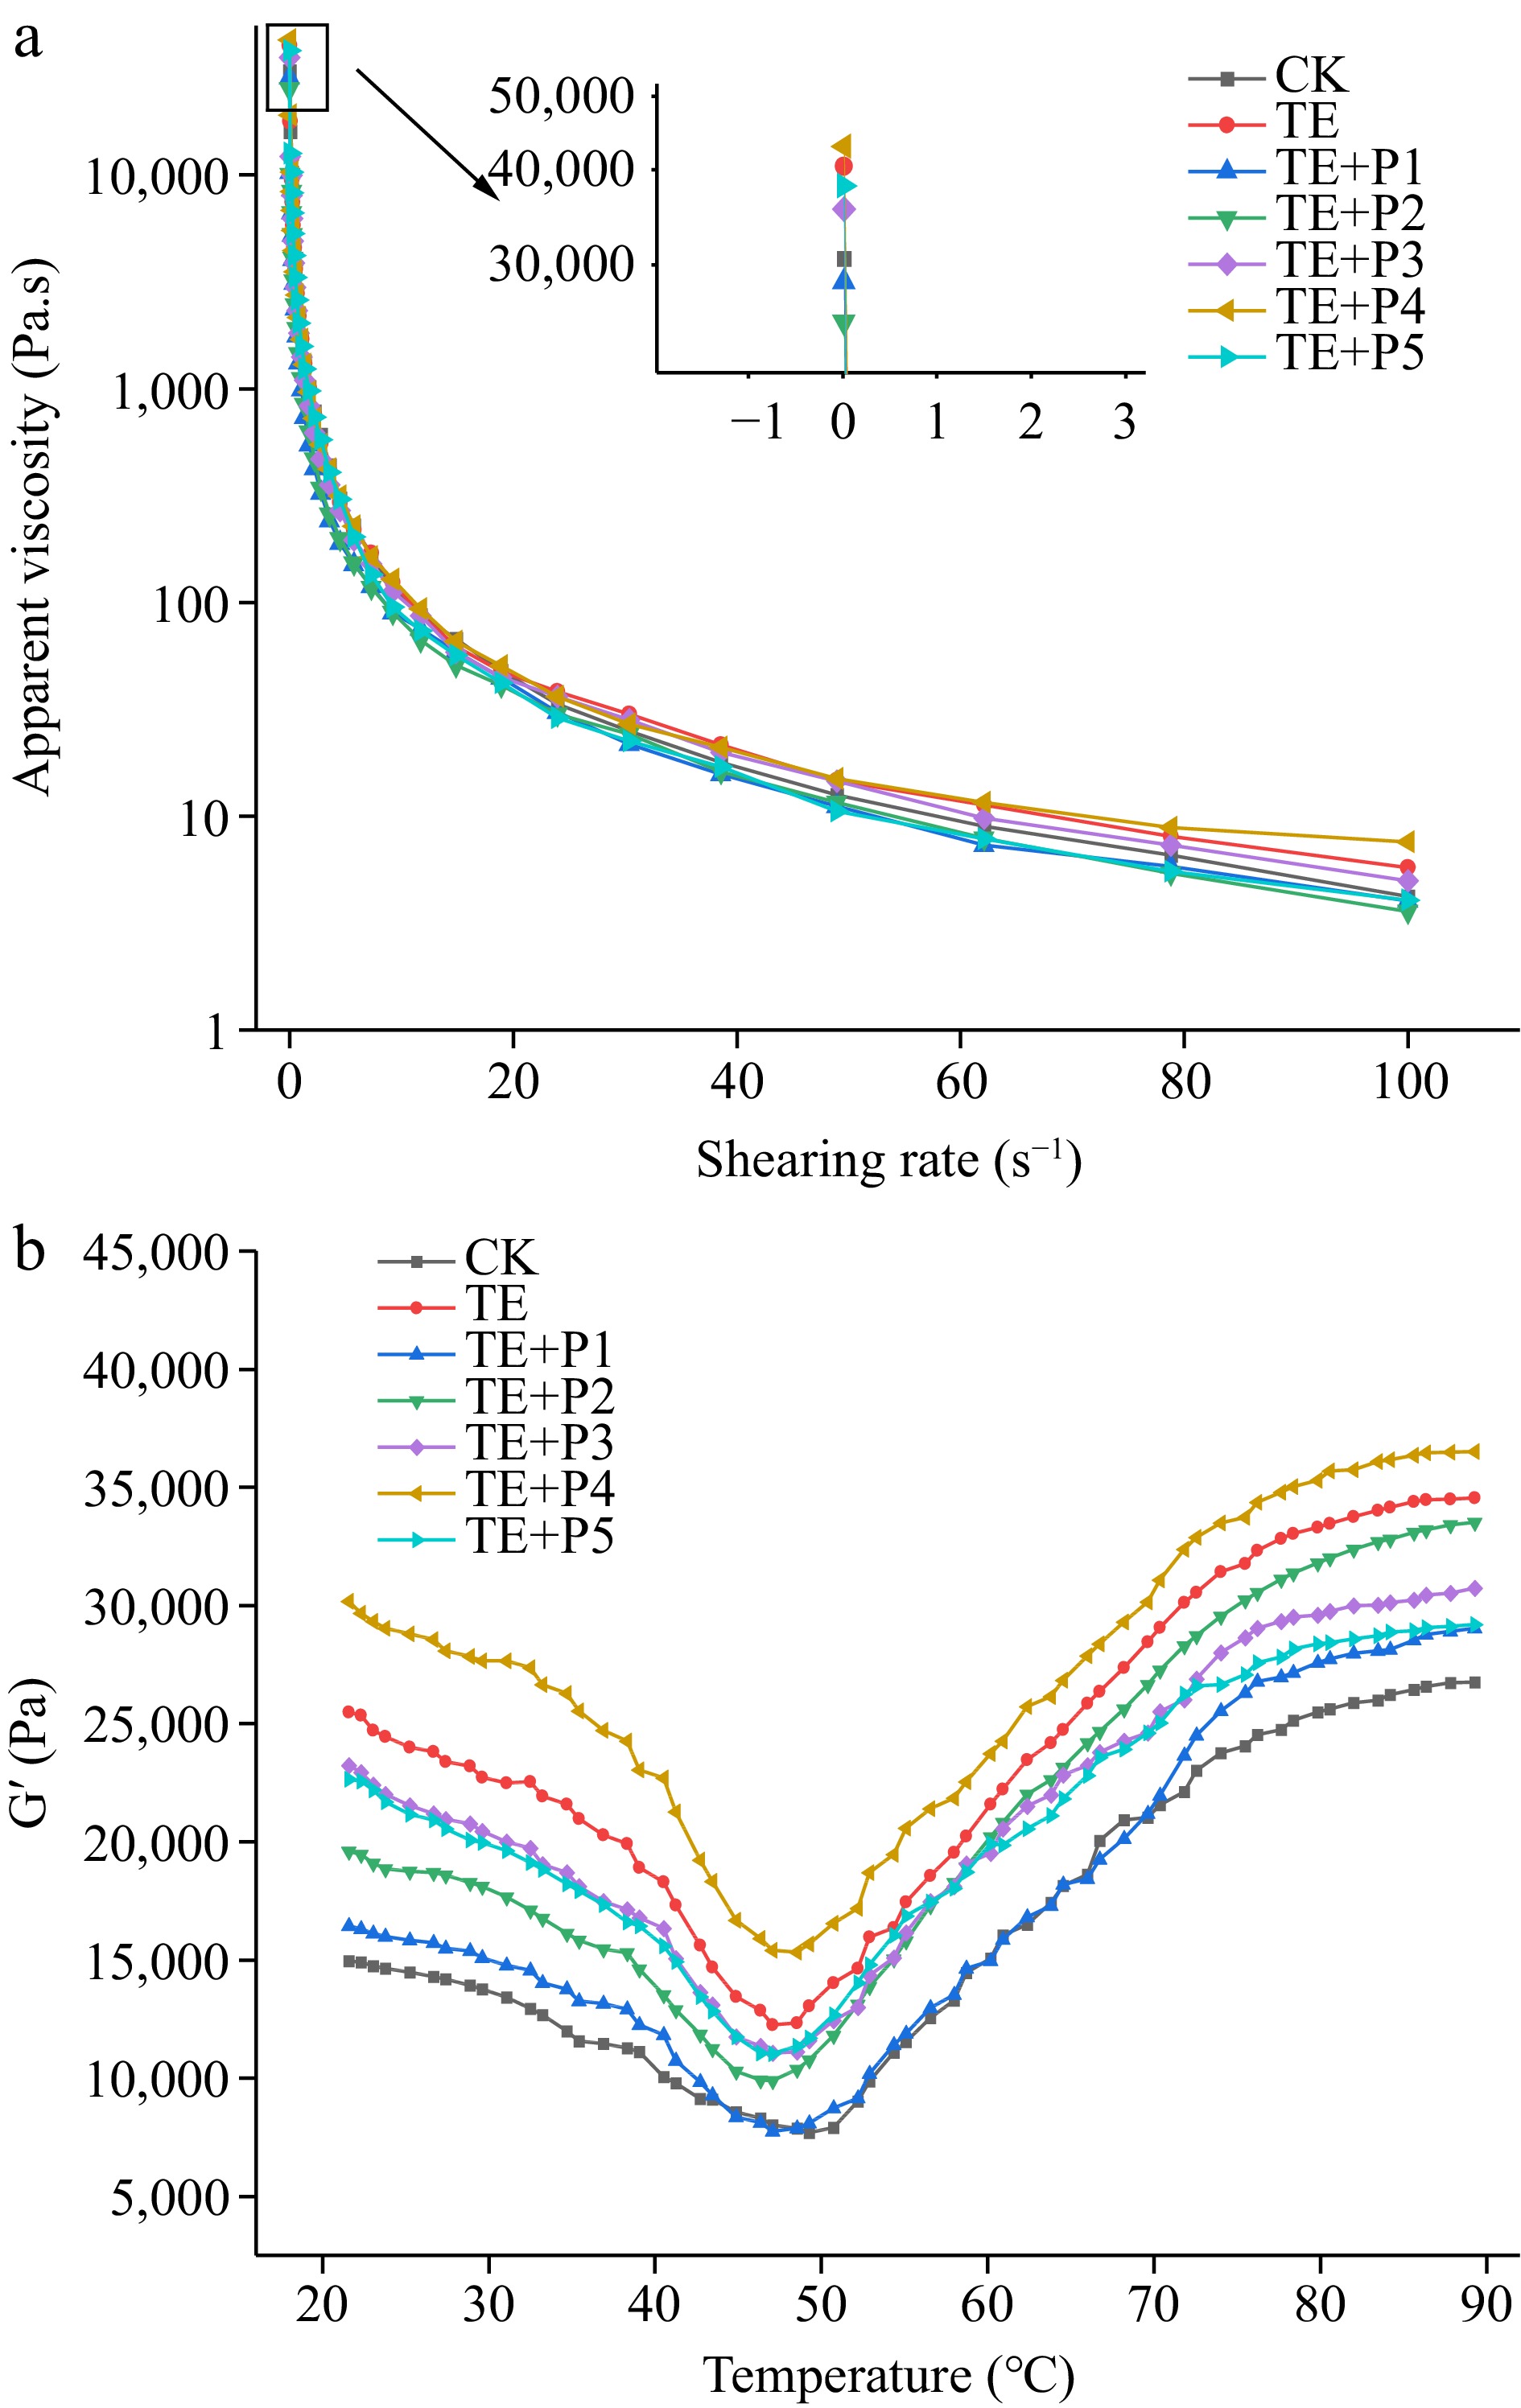
Figure 1.
Effect of different treatments on rheological properties of surimi.
-
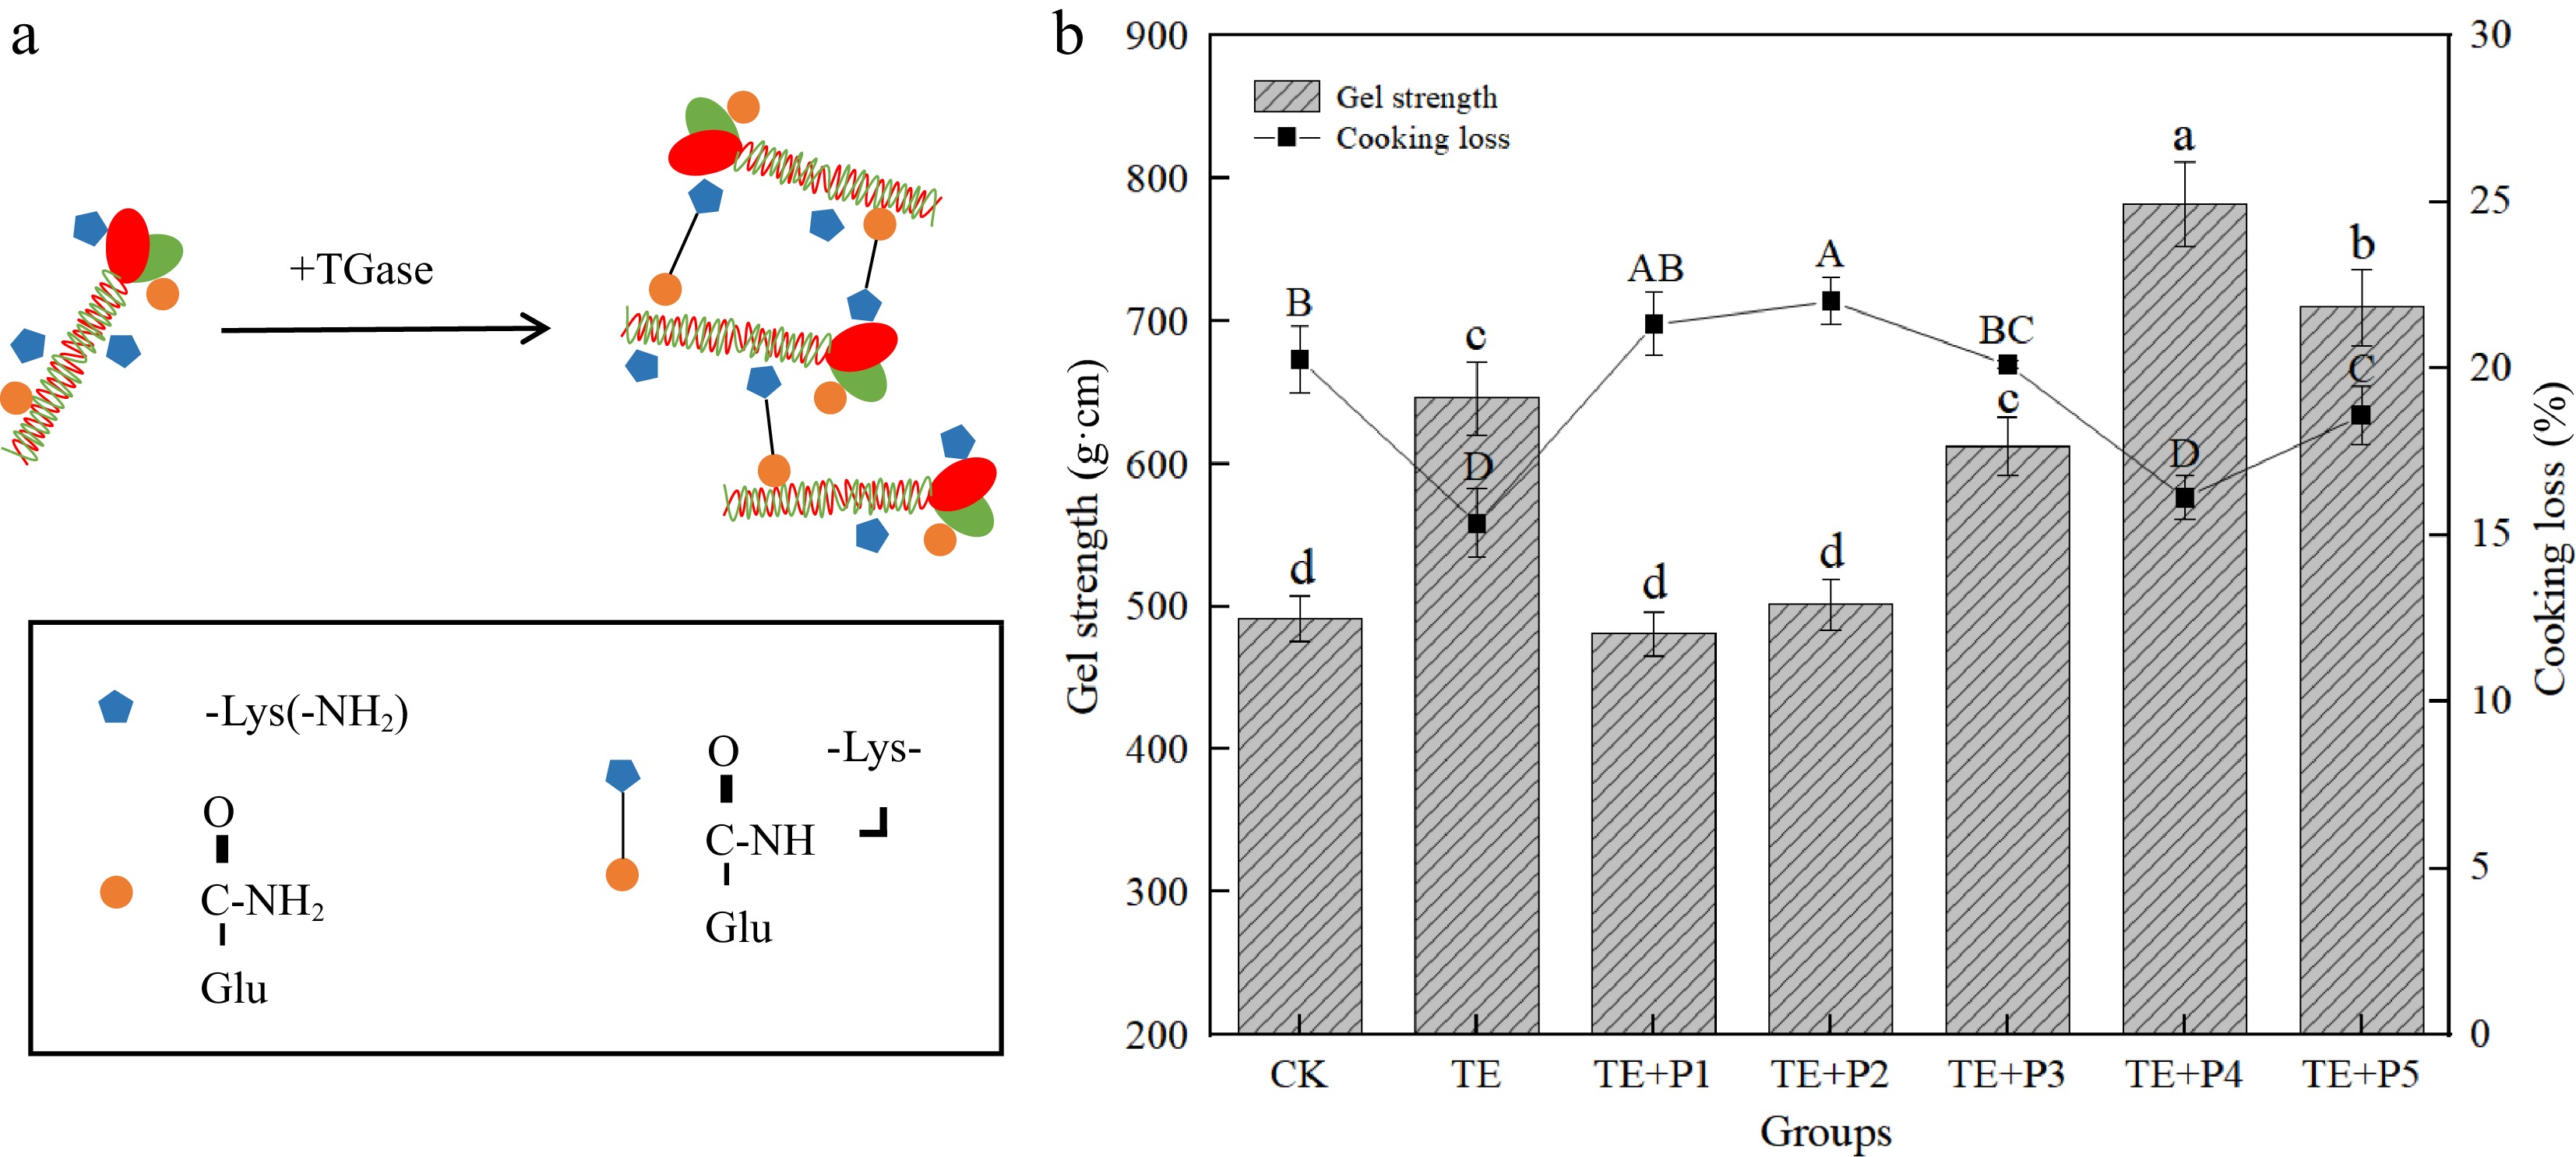
Figure 2.
(a) Catalytic reaction of glutamine transaminase and (b) effect of different treatments on gel strength and cooking loss of surimi gel. a−d/A−D: values with different lowercase letters indicate significant difference (p < 0.05).
-
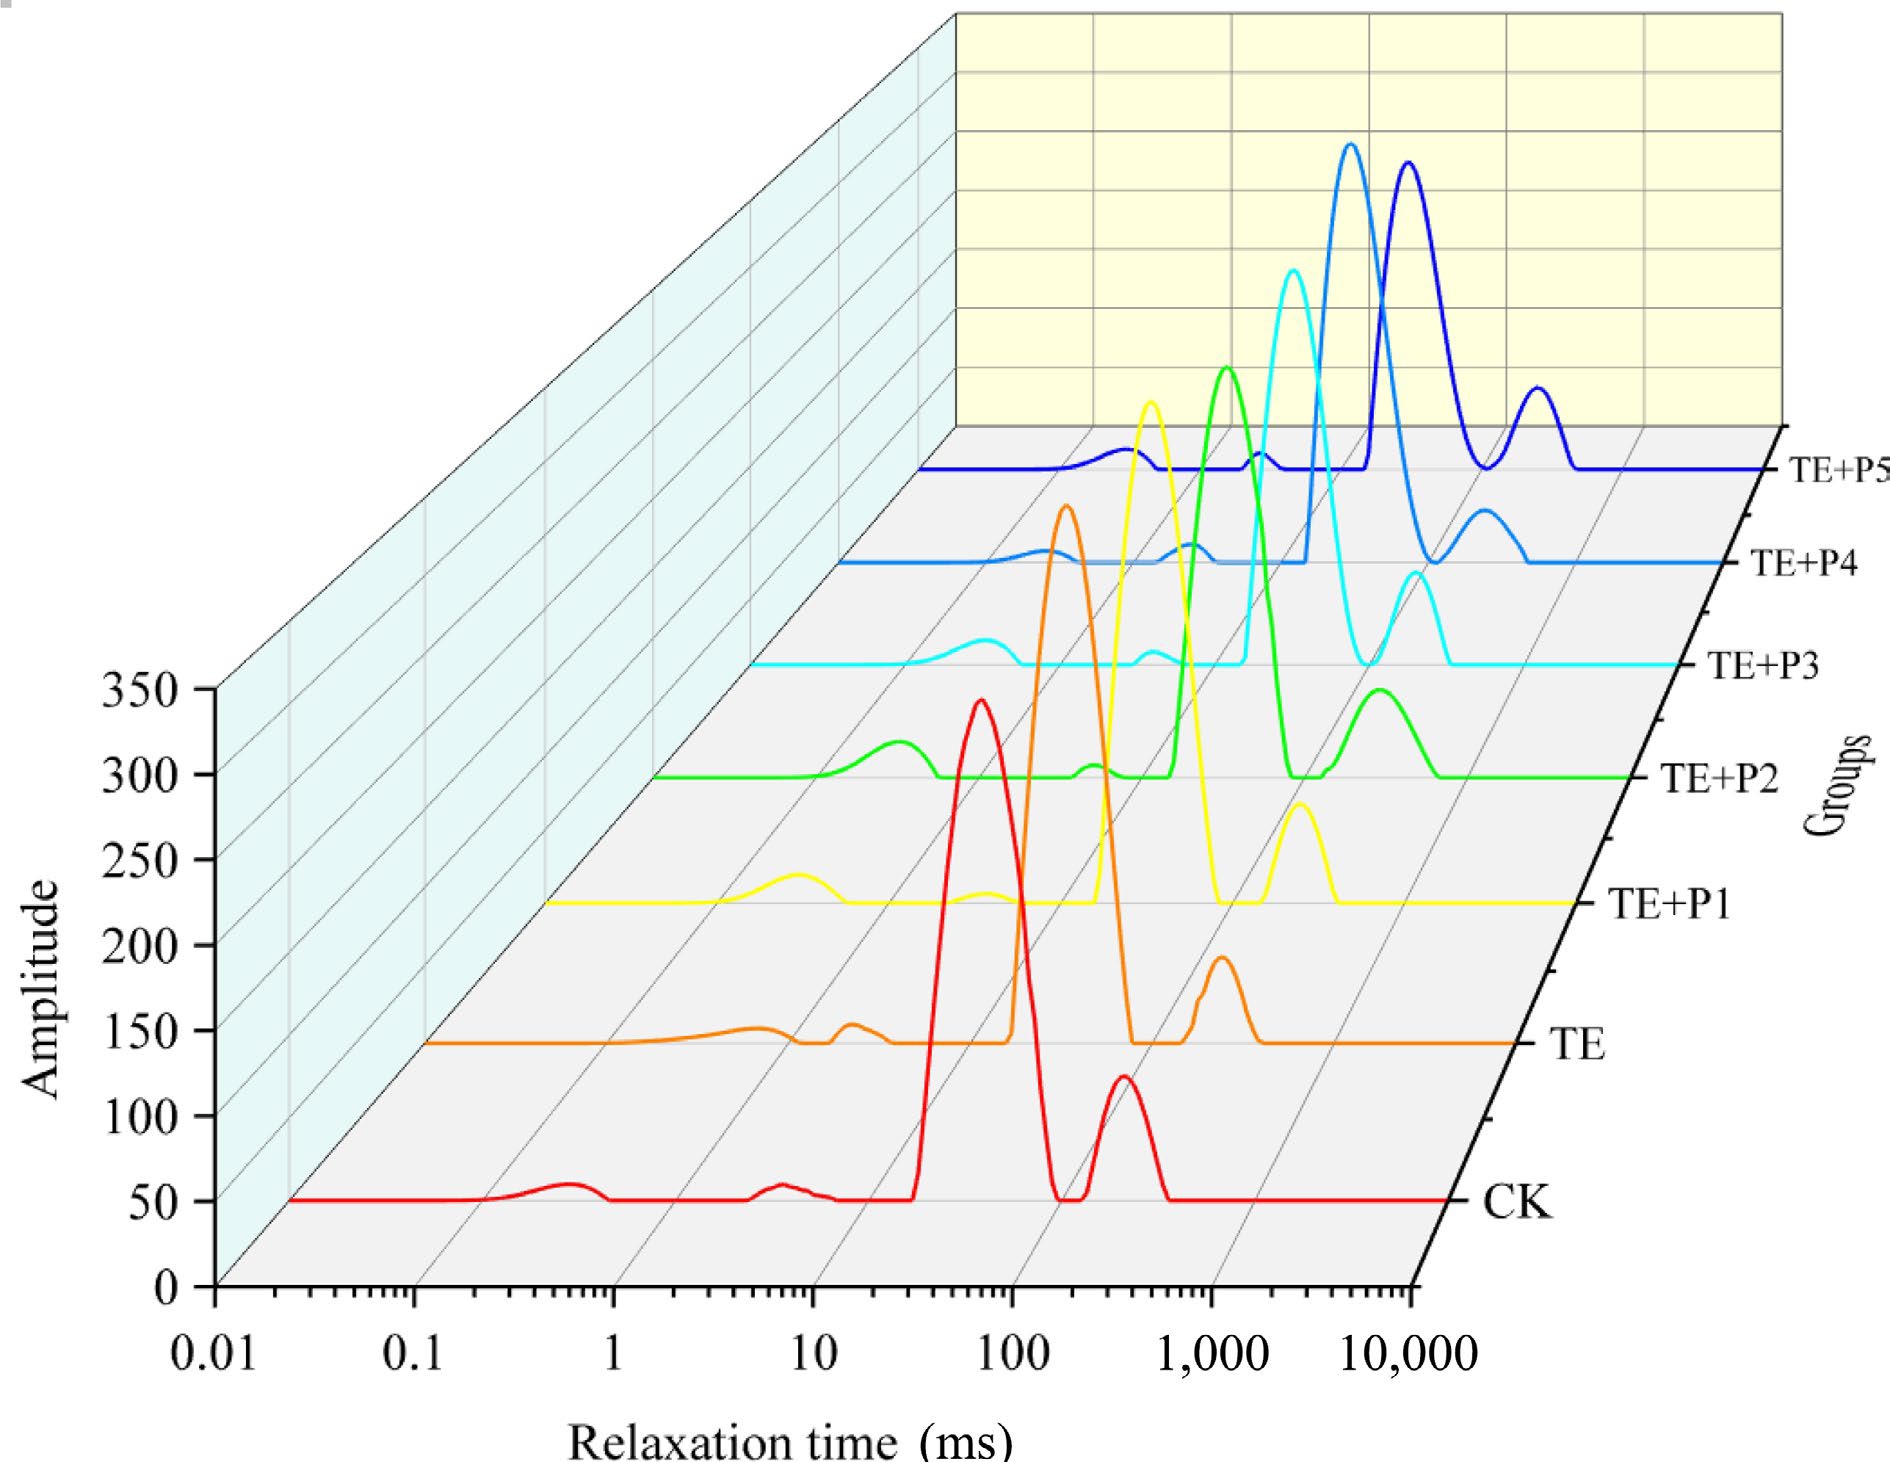
Figure 3.
Effect of different treatments on the transverse relaxation time T2 of surimi gel.
-
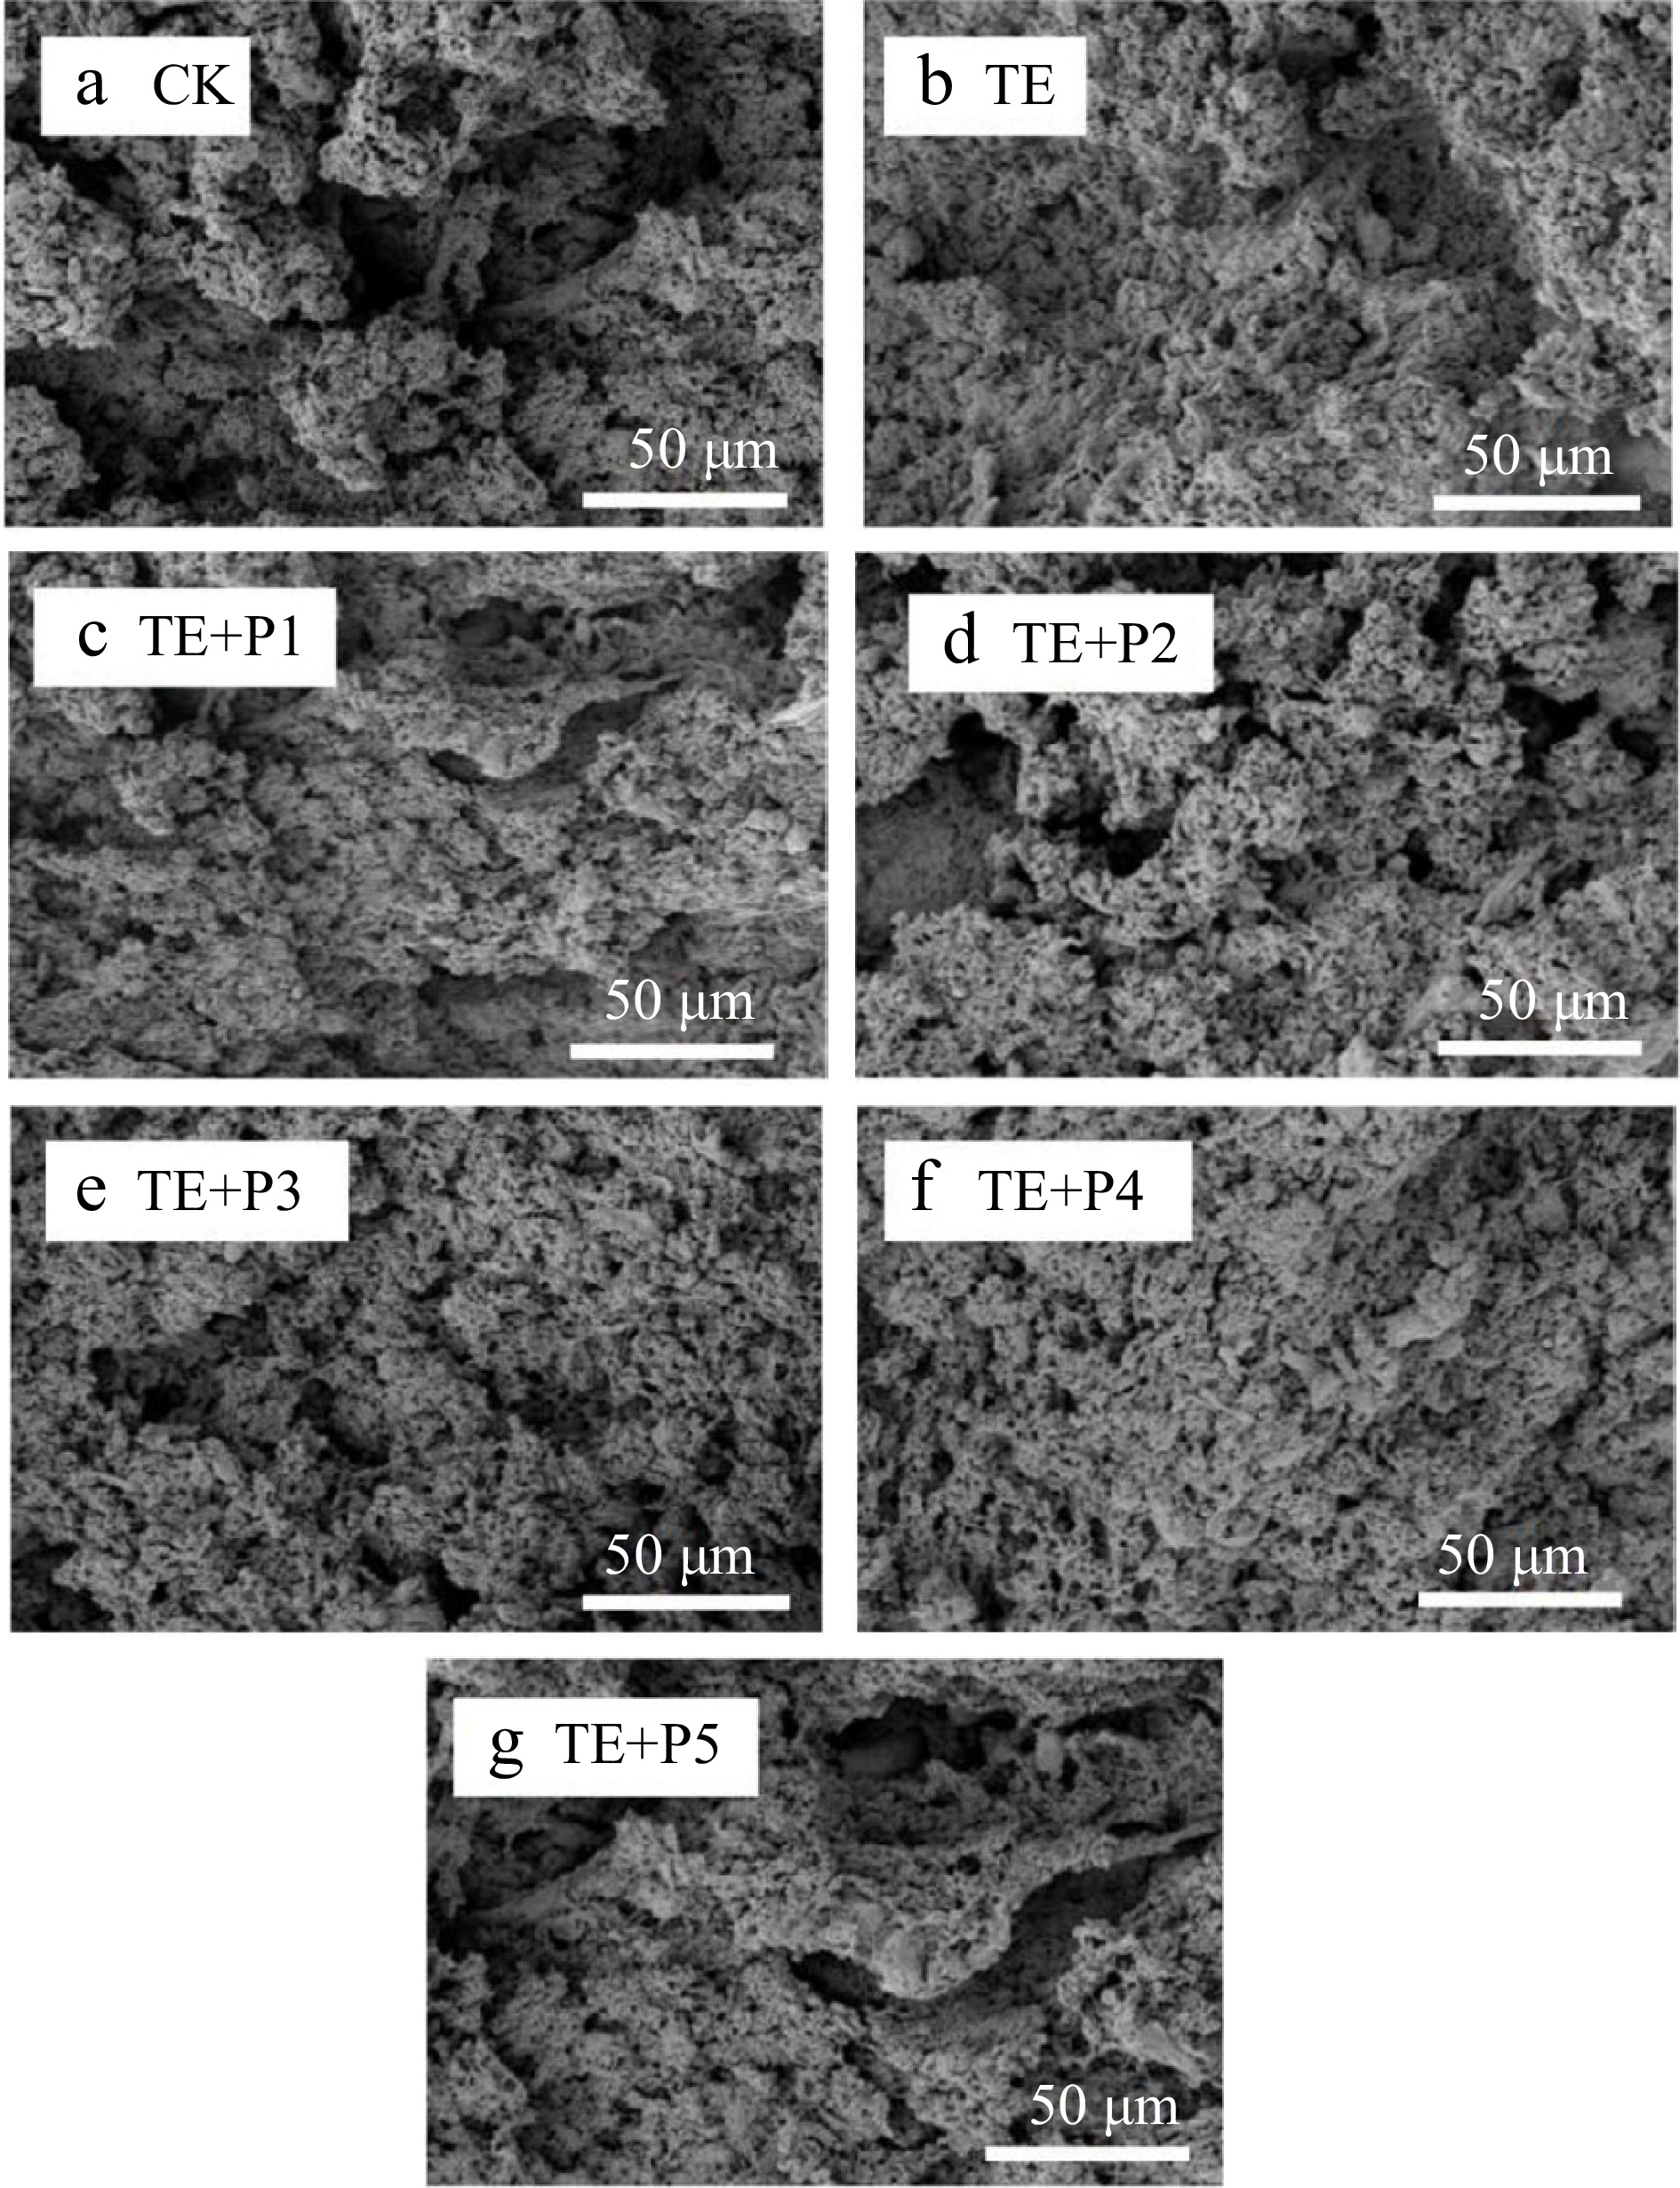
Figure 4.
Effect of different treatments on the microstructure of surimi.
-
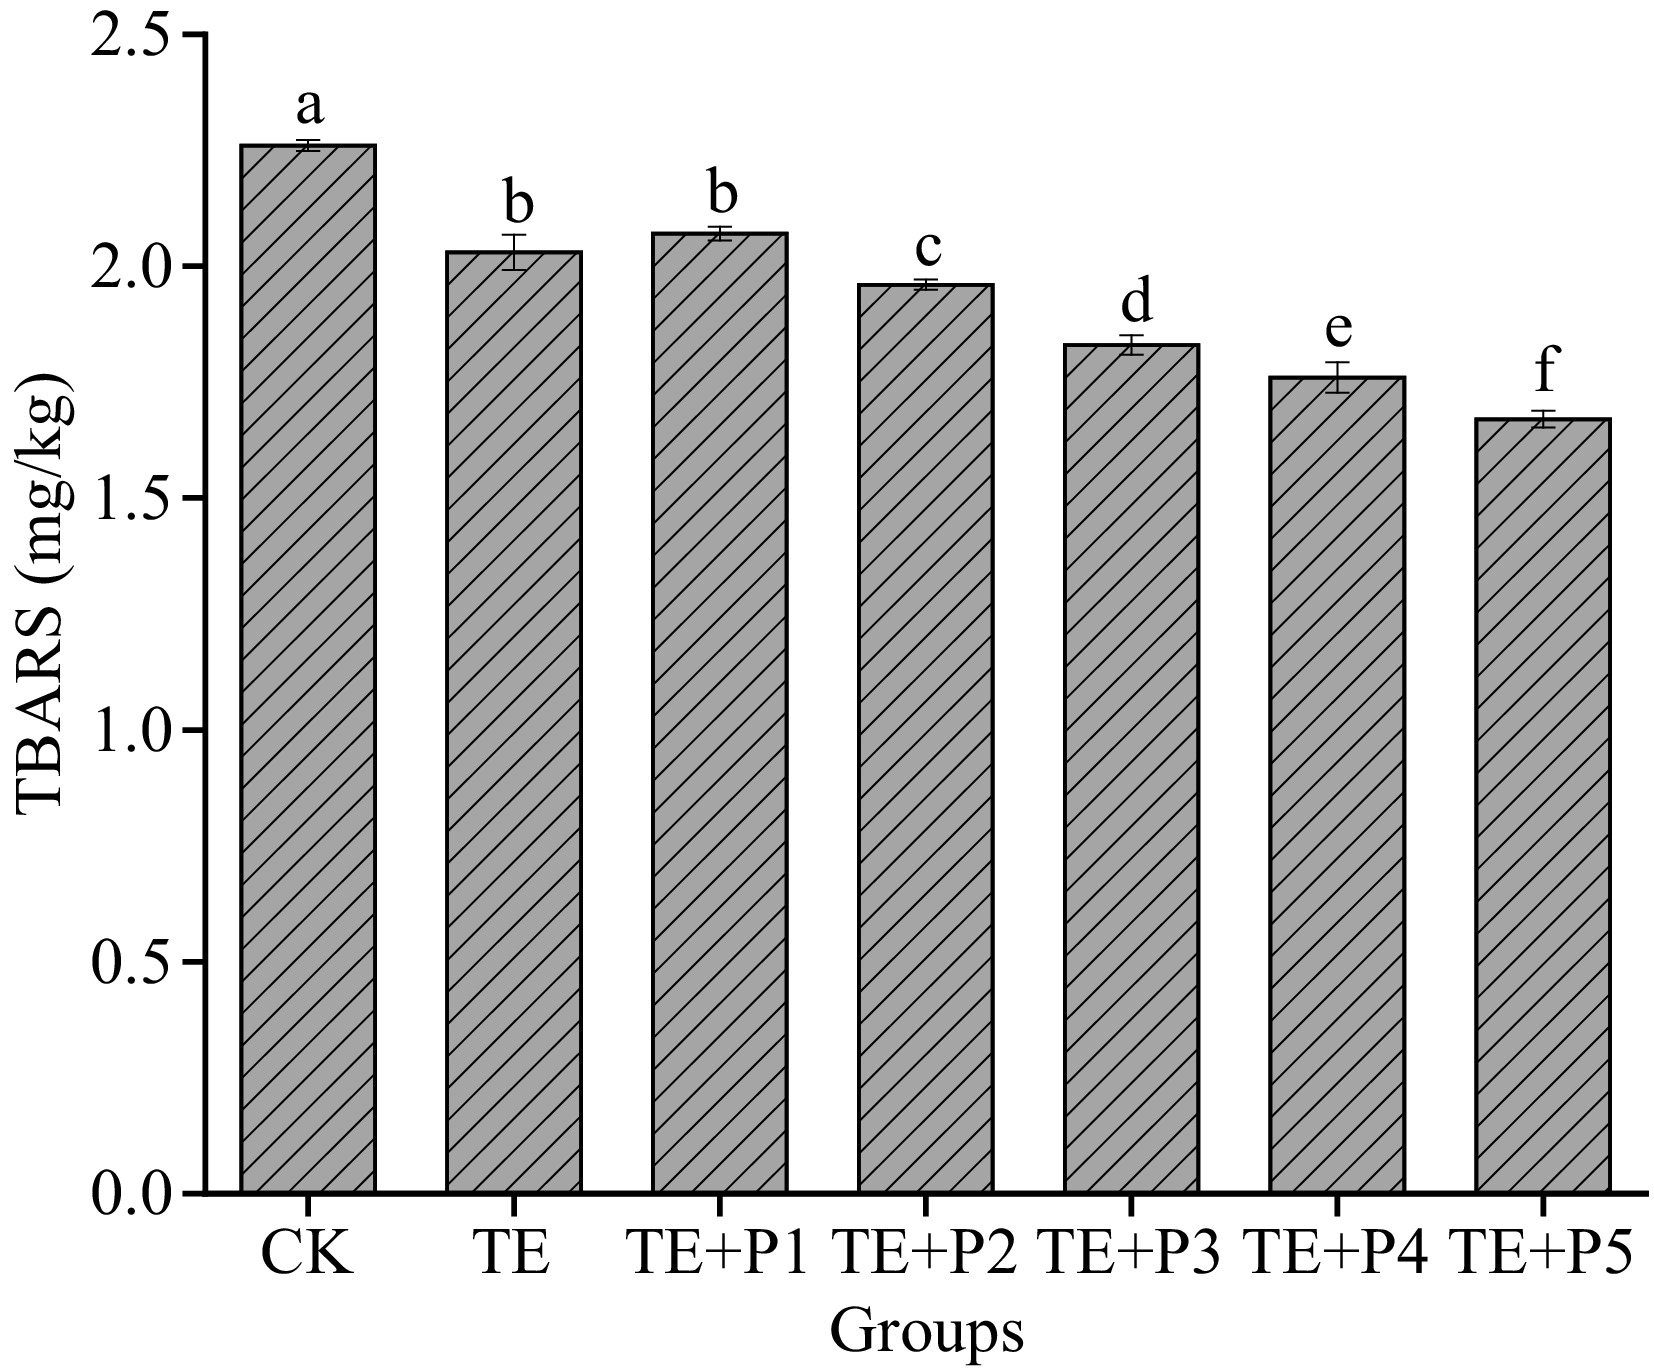
Figure 5.
Effect of different treatments on TBARS values of surimi gel. a−f: values with different lowercase letters indicate significant difference (p < 0.05).
-
Groups Surimi
(g)TGase
(w/w, %)Egg white
Protein
(w/w, %)ε-PL
(w/w, %)NaCl
(w/w, %)CK 300 − − − 0.5 TE 300 0.4 7.0 − 0.5 TE + P1 300 0.4 7.0 0.005 0.5 TE + P2 300 0.4 7.0 0.01 0.5 TE + P3 300 0.4 7.0 0.02 0.5 TE + P4 300 0.4 7.0 0.04 0.5 TE + P5 300 0.4 7.0 0.06 0.5 Table 1.
Surimi samples with different treatments.
-
Groups Hardness (g) Springiness Cohesiveness Chewiness (g) Resilience CK 811.40 ± 45.28de 0.81 ± 0.01a 0.53 ± 0.02b 498.36 ± 21.58c 0.21 ± 0.01e TE 1105.80 ± 61.83c 0.83 ± 0.01a 0.56 ± 0.01b 510.40 ± 26.04c 0.24 ± 0.00bcd TE + P1 736.01 ± 18.49e 0.80 ± 0.03a 0.61 ± 0.00a 348.78 ± 18.36d 0.23 ± 0.01cde TE + P2 777.45 ± 39.61de 0.80 ± 0.01a 0.60 ± 0.02a 307.03 ± 12.97e 0.22 ± 0.00de TE + P3 869.66 ± 45.82d 0.83 ± 0.02a 0.63 ± 0.01a 485.06 ± 22.73c 0.28 ± 0.00a TE + P4 1492.80 ± 77.13a 0.83 ± 0.01a 0.60 ± 0.01a 721.74 ± 31.55a 0.26 ± 0.01ab TE + P5 1314.60 ± 84.10b 0.81 ± 0.00a 0.60 ± 0.02a 652.36 ± 30.24b 0.25 ± 0.01bc Different lowercase letters in the same column indicated significant differences (p < 0.05). Table 2.
Effect of different treatments on the textural properties of surimi gels.
-
Groups L* a* b* Whiteness CK 72.49 ± 0.82e −0.92 ± 0.01e 10.42 ± 0.33d 70.56 ± 0.65d TE 77.82 ± 0.34ab −0.23 ± 0.02c 12.29 ± 0.29bc 74.64 ± 0.26ab TE + P1 78.39 ± 0.40a −0.14 ± 0.01a 12.46 ± 0.12ab 75.05 ± 0.41a TE + P2 78.42 ± 0.43a −0.17 ± 0.0b 12.46 ± 0.15ab 75.07 ± 0.32a TE + P3 77.48 ± 0.16b −0.18 ± 0.02b 12.37 ± 0.09abc 74.31 ± 0.11b TE + P4 76.34 ± 0.05c −0.22 ± 0.01c 12.73 ± 0.02a 73.13 ± 0.04c TE + P5 75.48 ± 0.18d −0.26 ± 0.01d 12.01 ± 0.14c 72.70 ± 0.19c Different lowercase letters in the same column indicated significant differences (p < 0.05). Table 3.
Effect of different treatments on the color of surimi gels.
-
Groups P21 (%) P22 (%) P23 (%) P24 (%) CK 2.175 ± 0.186c 1.198 ± 0.012e 82.863 ± 0.691bc 13.764 ± 0.091a TE 1.938 ± 0.095d 2.166 ± 0.043a 85.144 ± 1.336a 10.752 ± 0.033e TE + P1 2.705 ± 0.067b 1.414 ± 0.009d 83.435 ± 1.616b 12.446 ± 0.105c TE + P2 3.005 ± 0.003a 1.845 ± 0.056b 82.874 ± 1.739bc 12.276 ± 0.108c TE + P3 3.107 ± 0.063a 1.715 ± 0.033c 83.950 ± 1.587ab 11.228 ± 0.086d TE + P4 1.770 ± 0.018d 2.099 ± 0.059a 85.021 ± 1.756a 11.110 ± 0.144d TE + P5 3.121 ± 0.007a 1.758 ± 0.107bc 82.136 ± 1.091c 12.985 ± 0.018b Different lowercase letters in the same column indicated significant differences (p < 0.05). Table 4.
Effect of different treatments on the transverse relaxation time T2 of surimi gel.
Figures
(5)
Tables
(4)