-
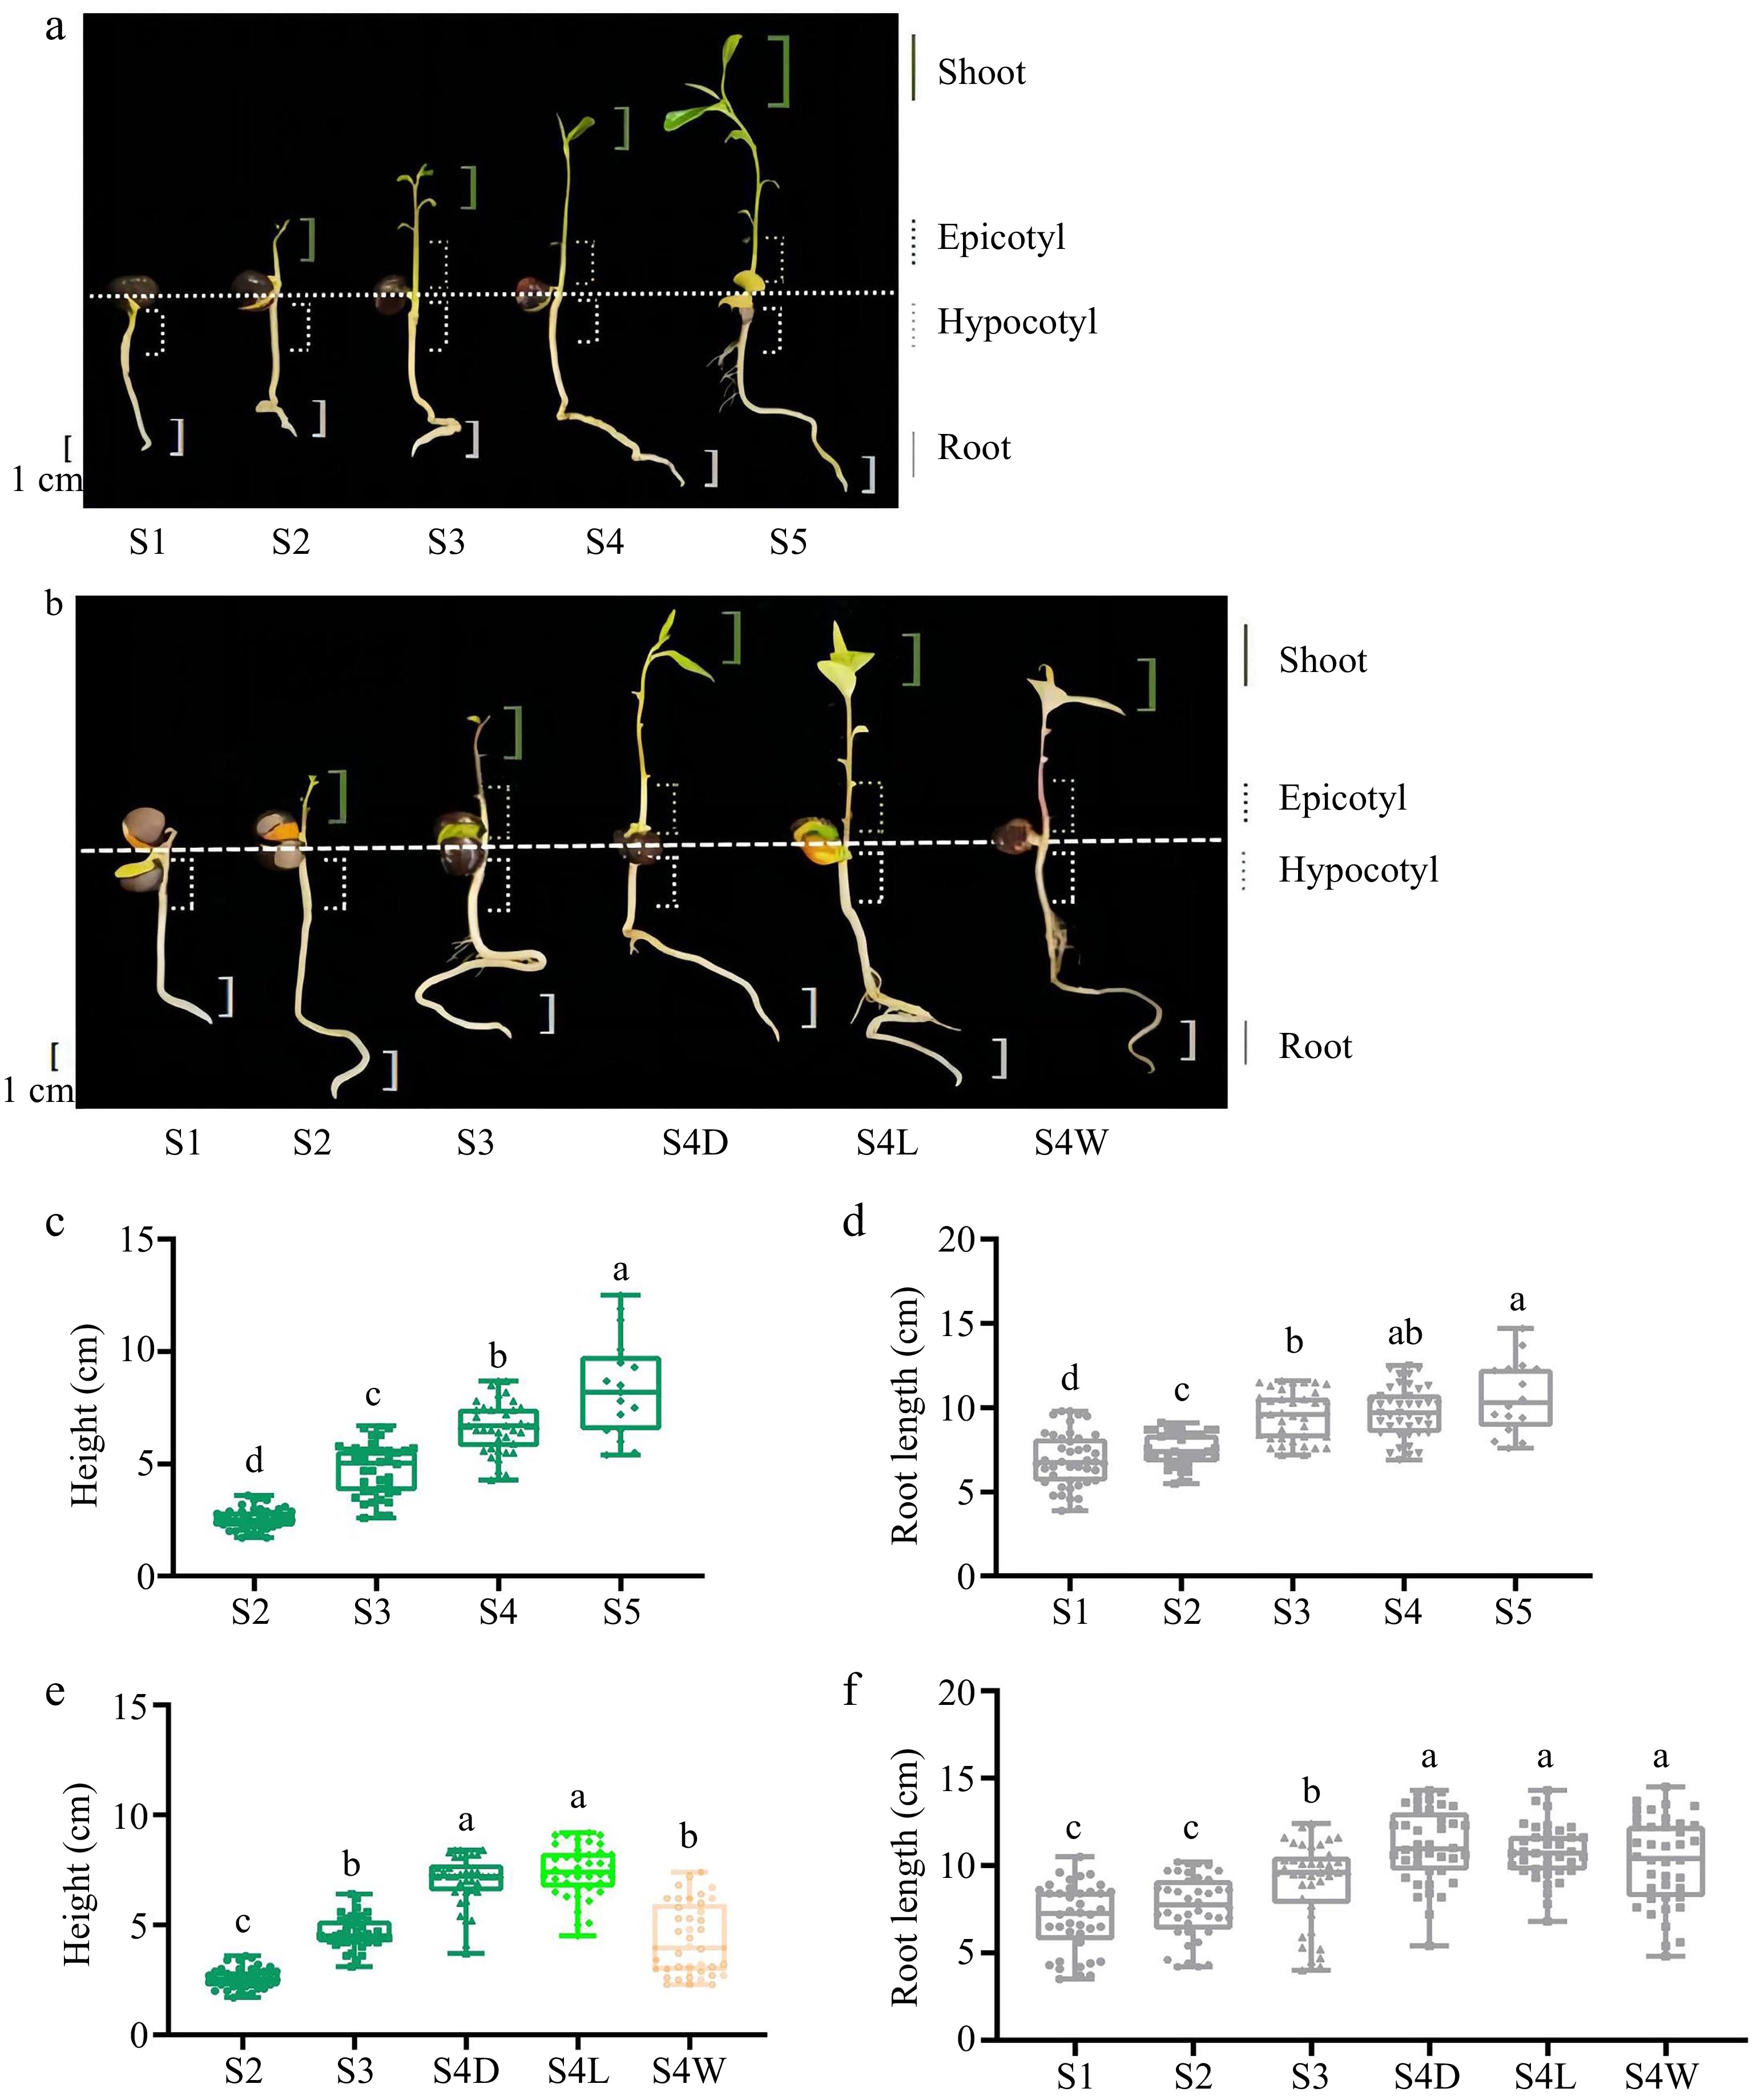
Figure 1.
Growth phenotype and physiological indexes of tea seedlings in different stages. (a), (b) Pictures of tea seedlings of 'MKDY' and 'HK' at different growth stages, and the parts of experimental materials taken from different tissues are marked in the figures. (c), (d) Plant height and root length of 'MKDY' tea seedlings. (e), (f) Plant height and root length of 'HK' tea seedlings in different stages.
-
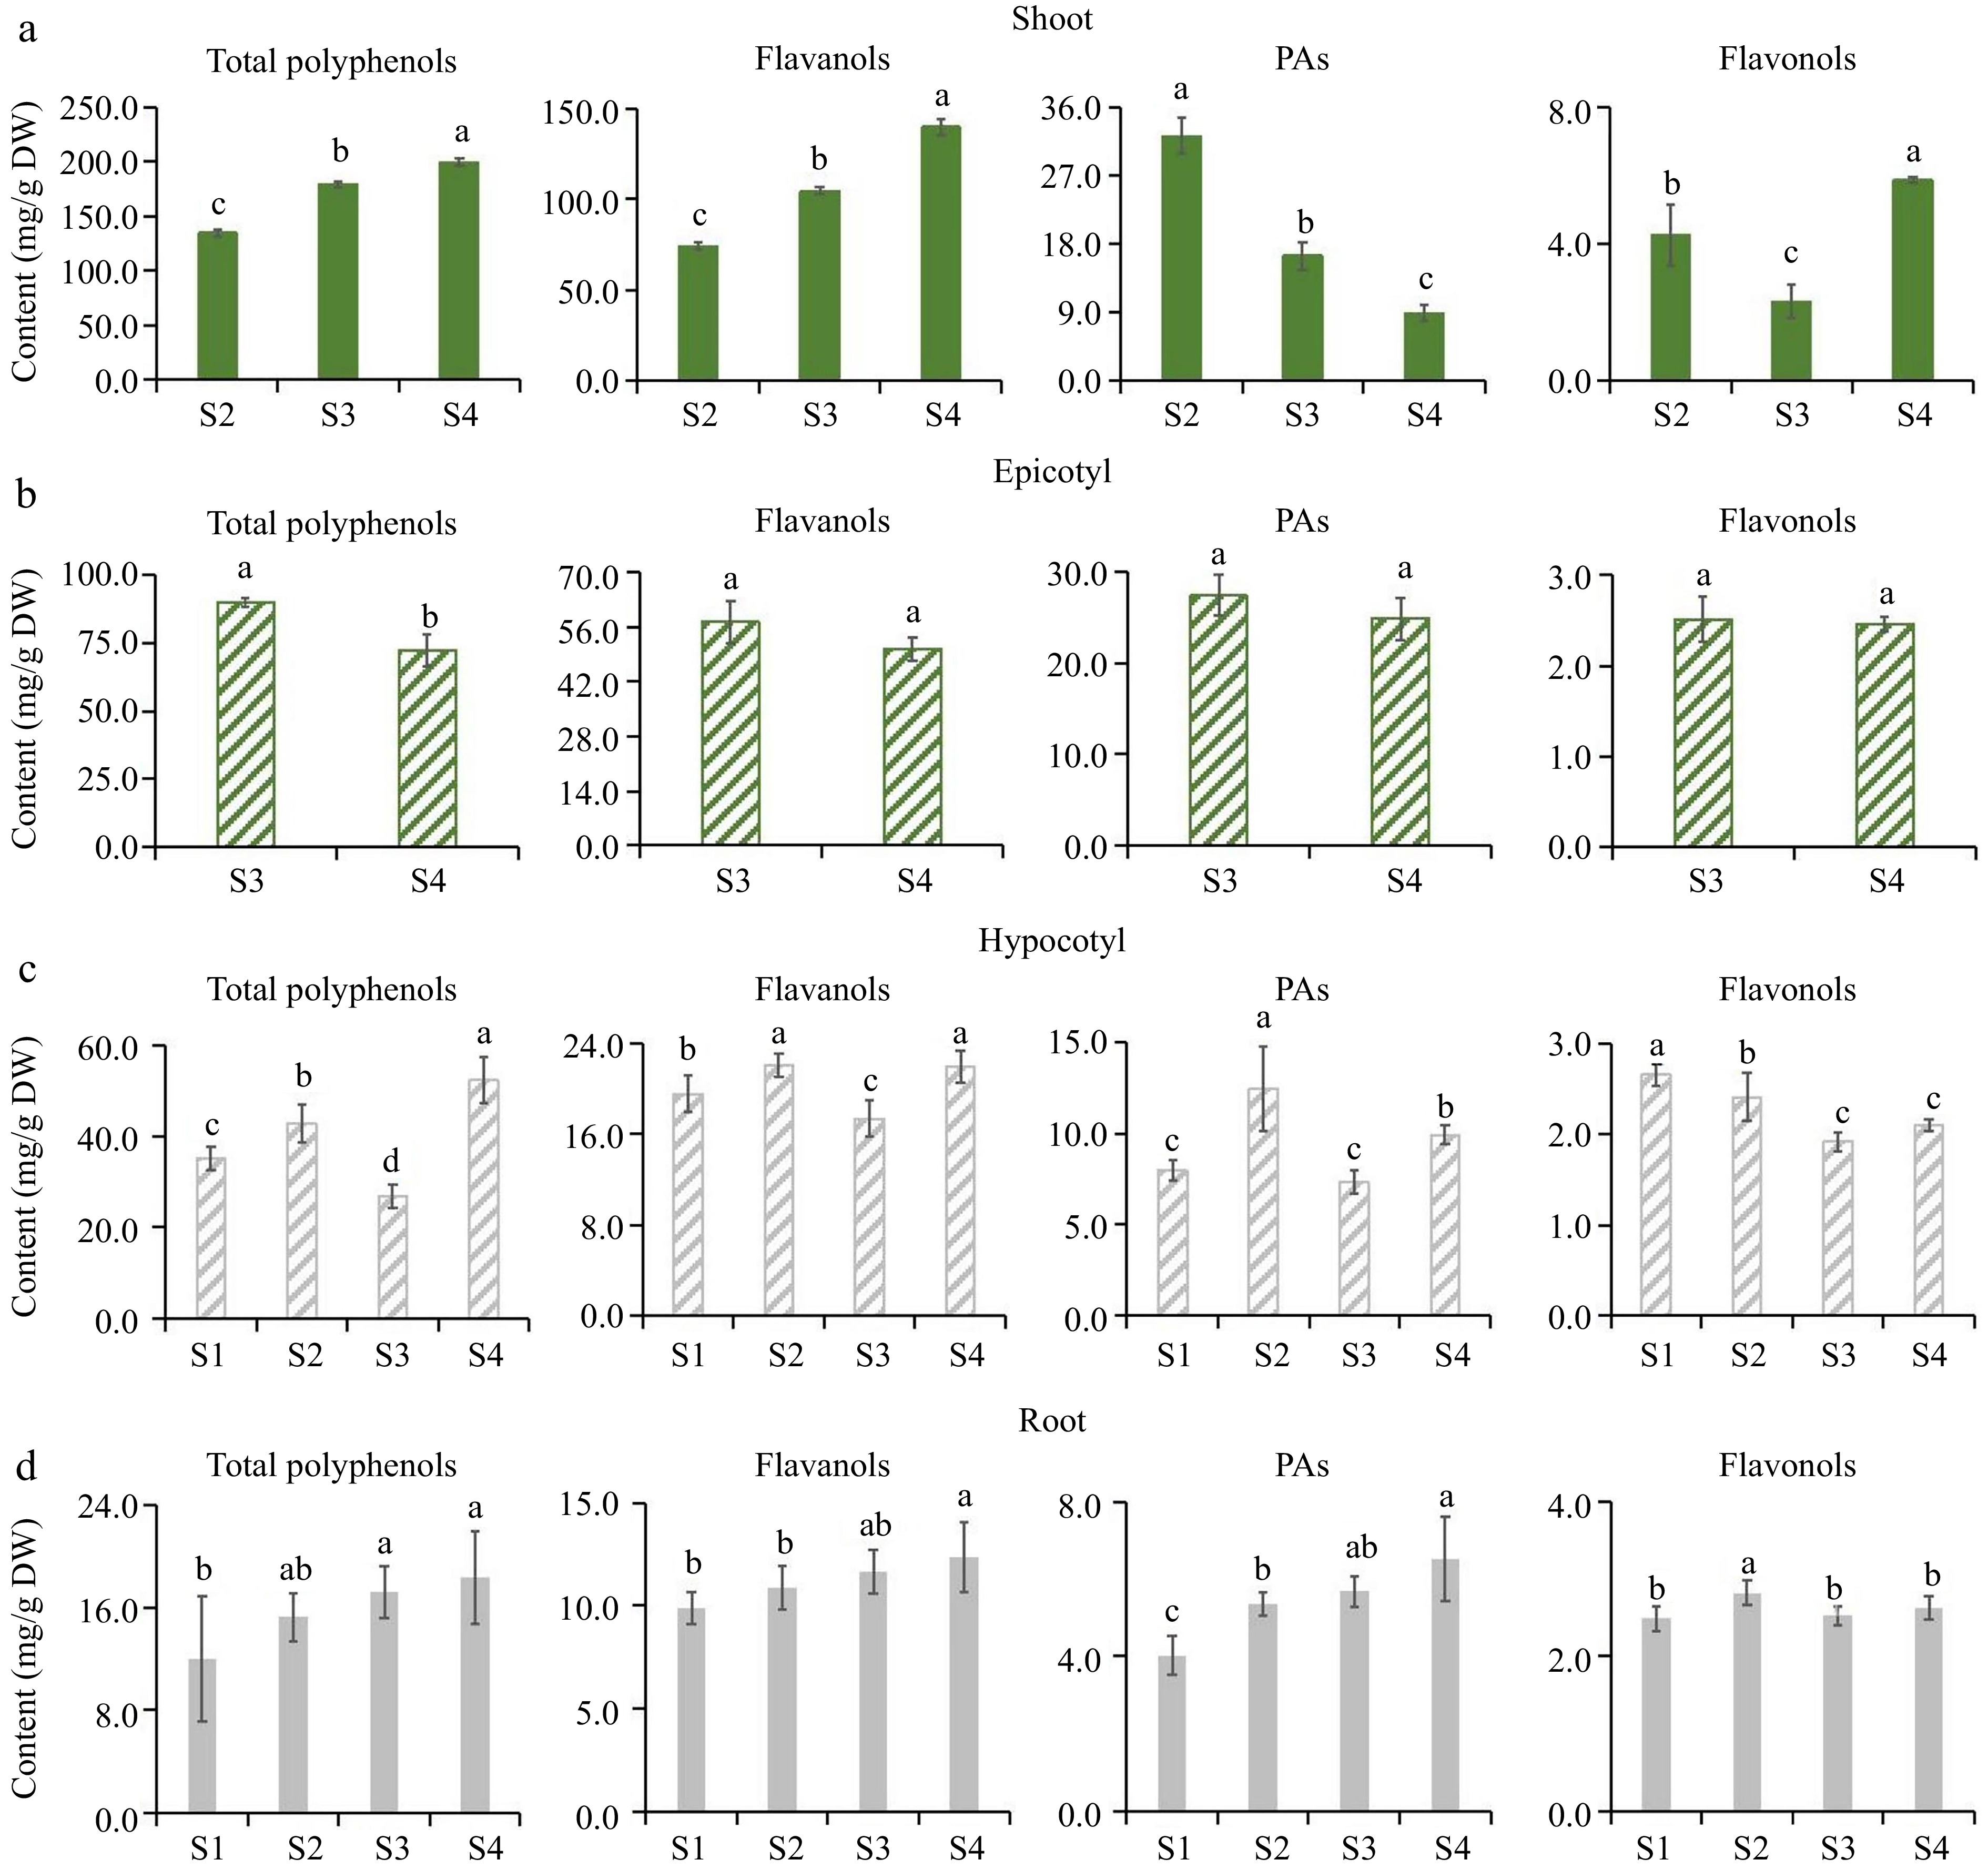
Figure 2.
Flavonoids accumulation pattern of 'MKDY' tea seedlings at different developmental stages. (a)−(d) Were the accumulation of total polyphenols, flavanols, PAs and flavonols in shoots, epicotyls, hypocotyls and root tips, respectively. DW: dry weight.
-
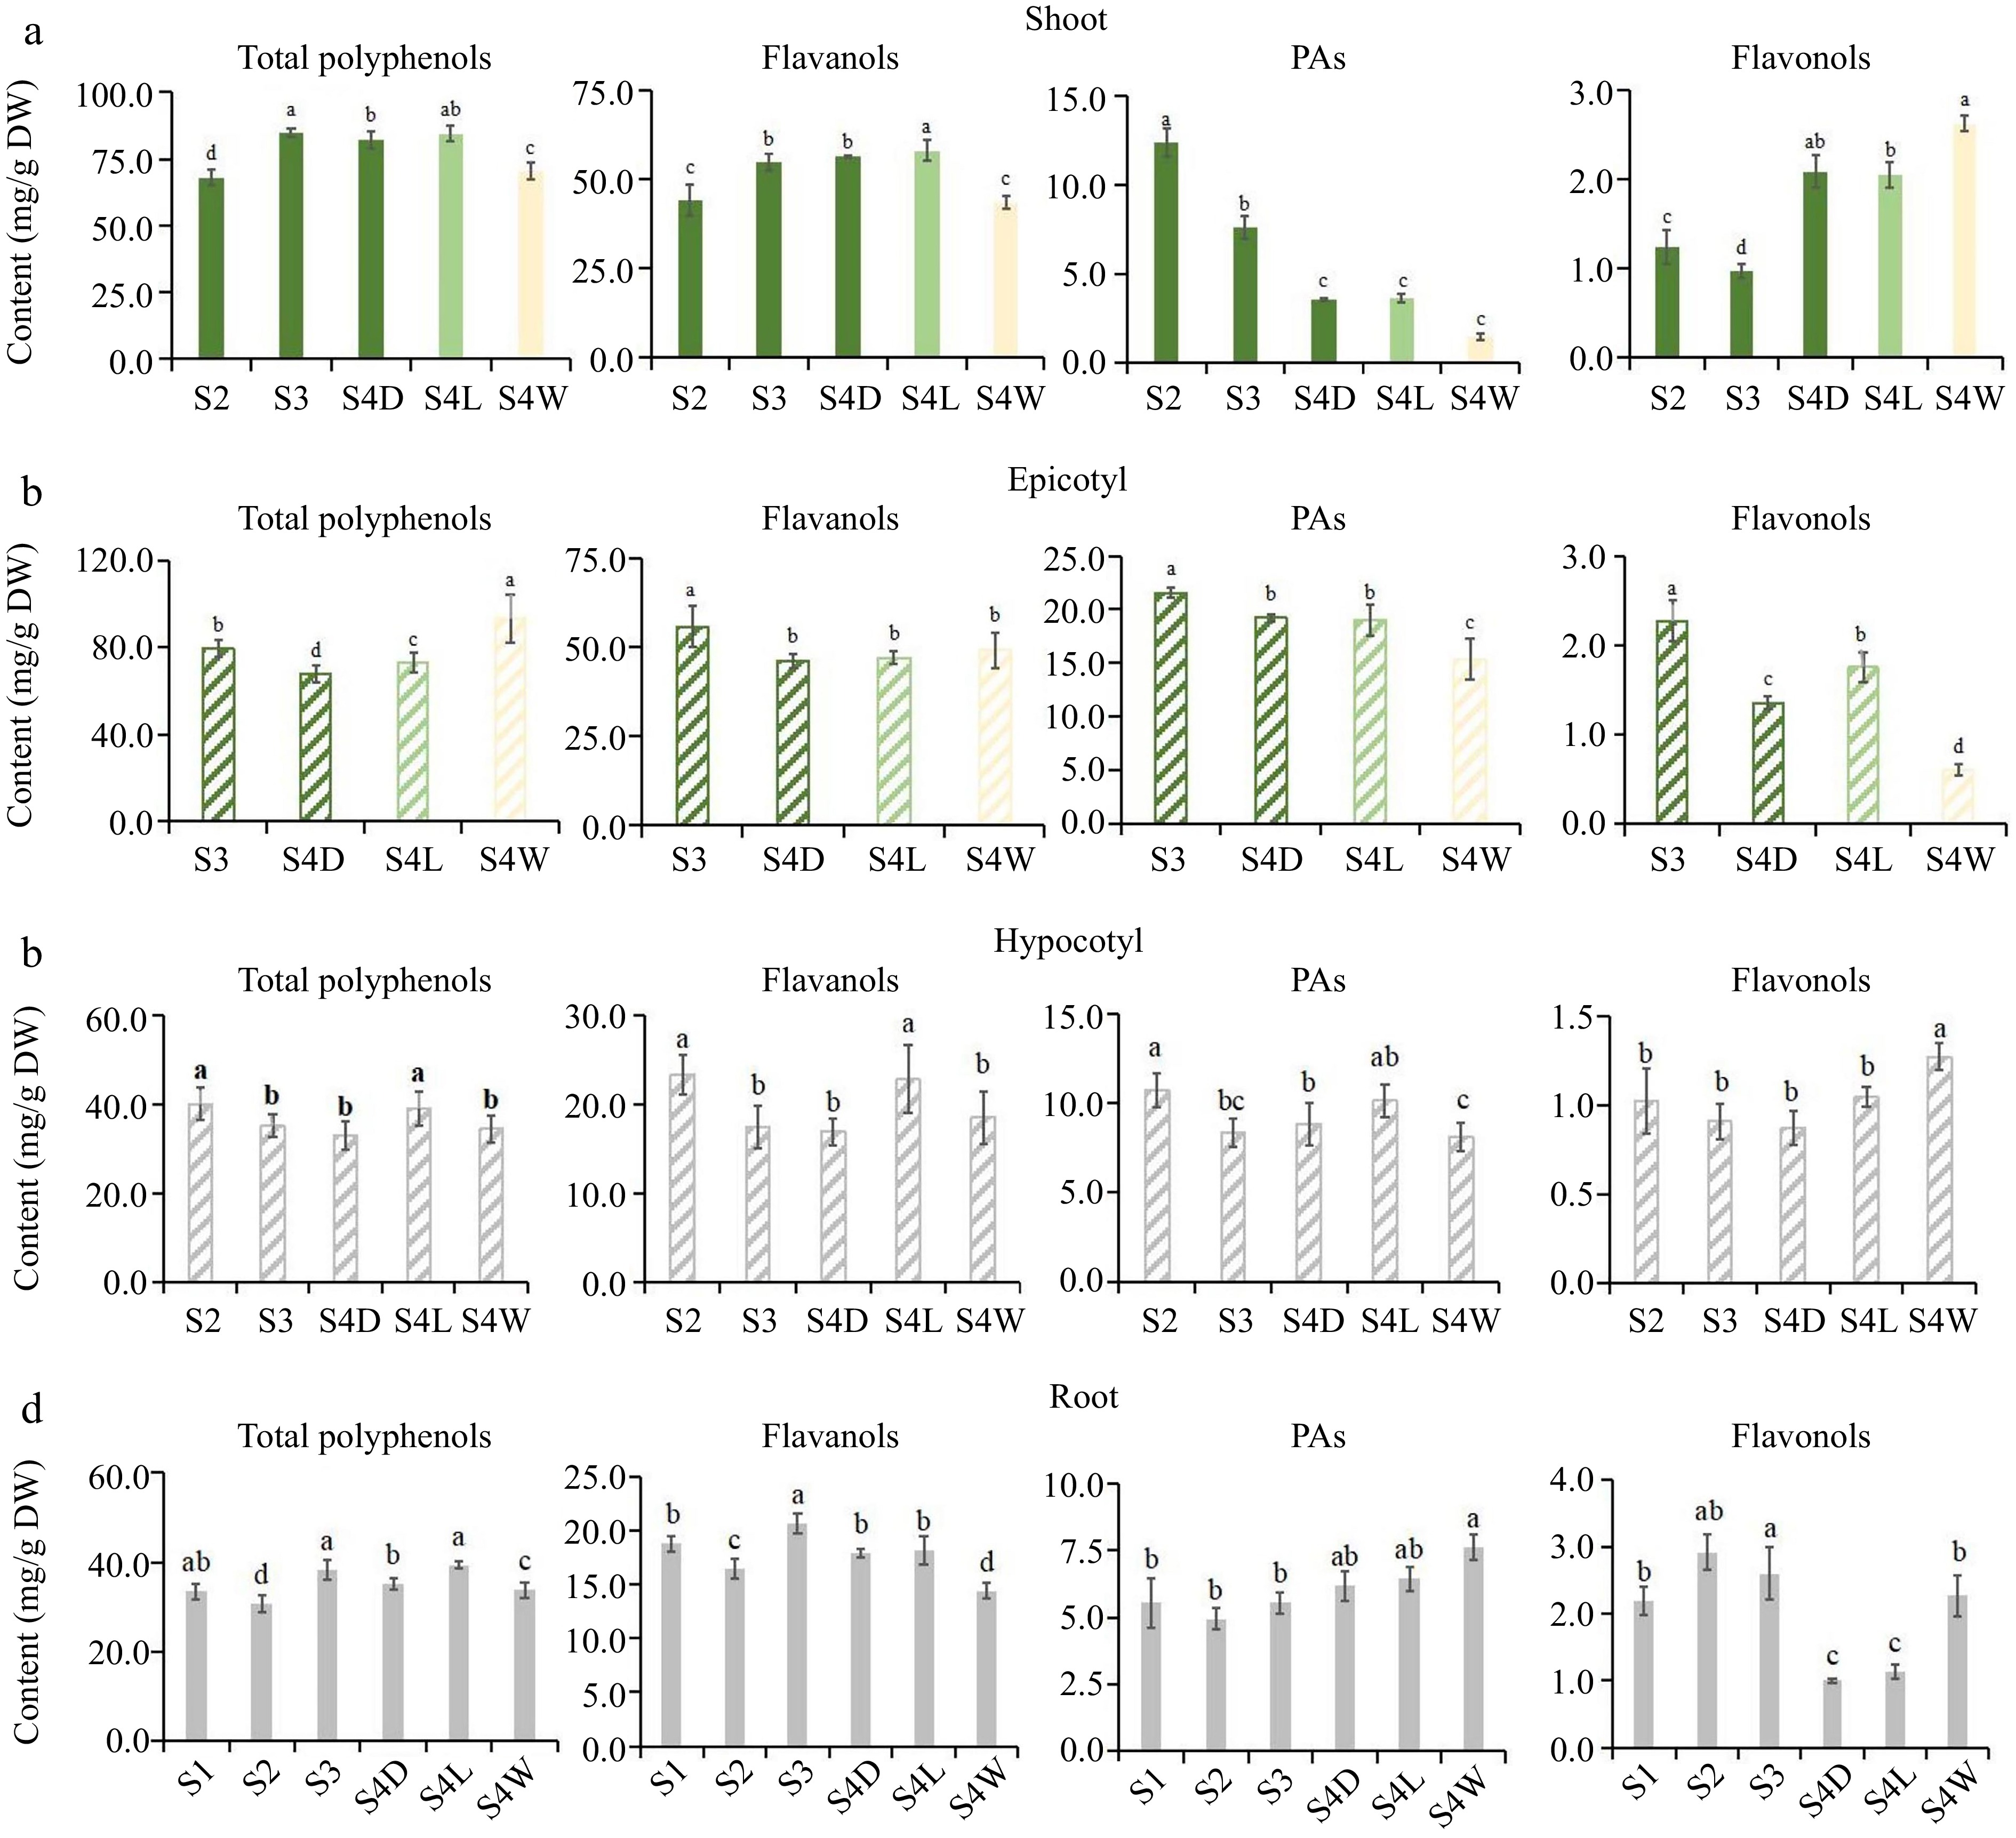
Figure 3.
Flavonoids accumulation pattern of 'HK' tea seedlings at different developmental stages. (a)−(d) Were the accumulation of total polyphenols, flavanols, PAs and flavonols in shoots, epicotyls, hypocotyls and root tips, respectively. DW: dry weight.
-
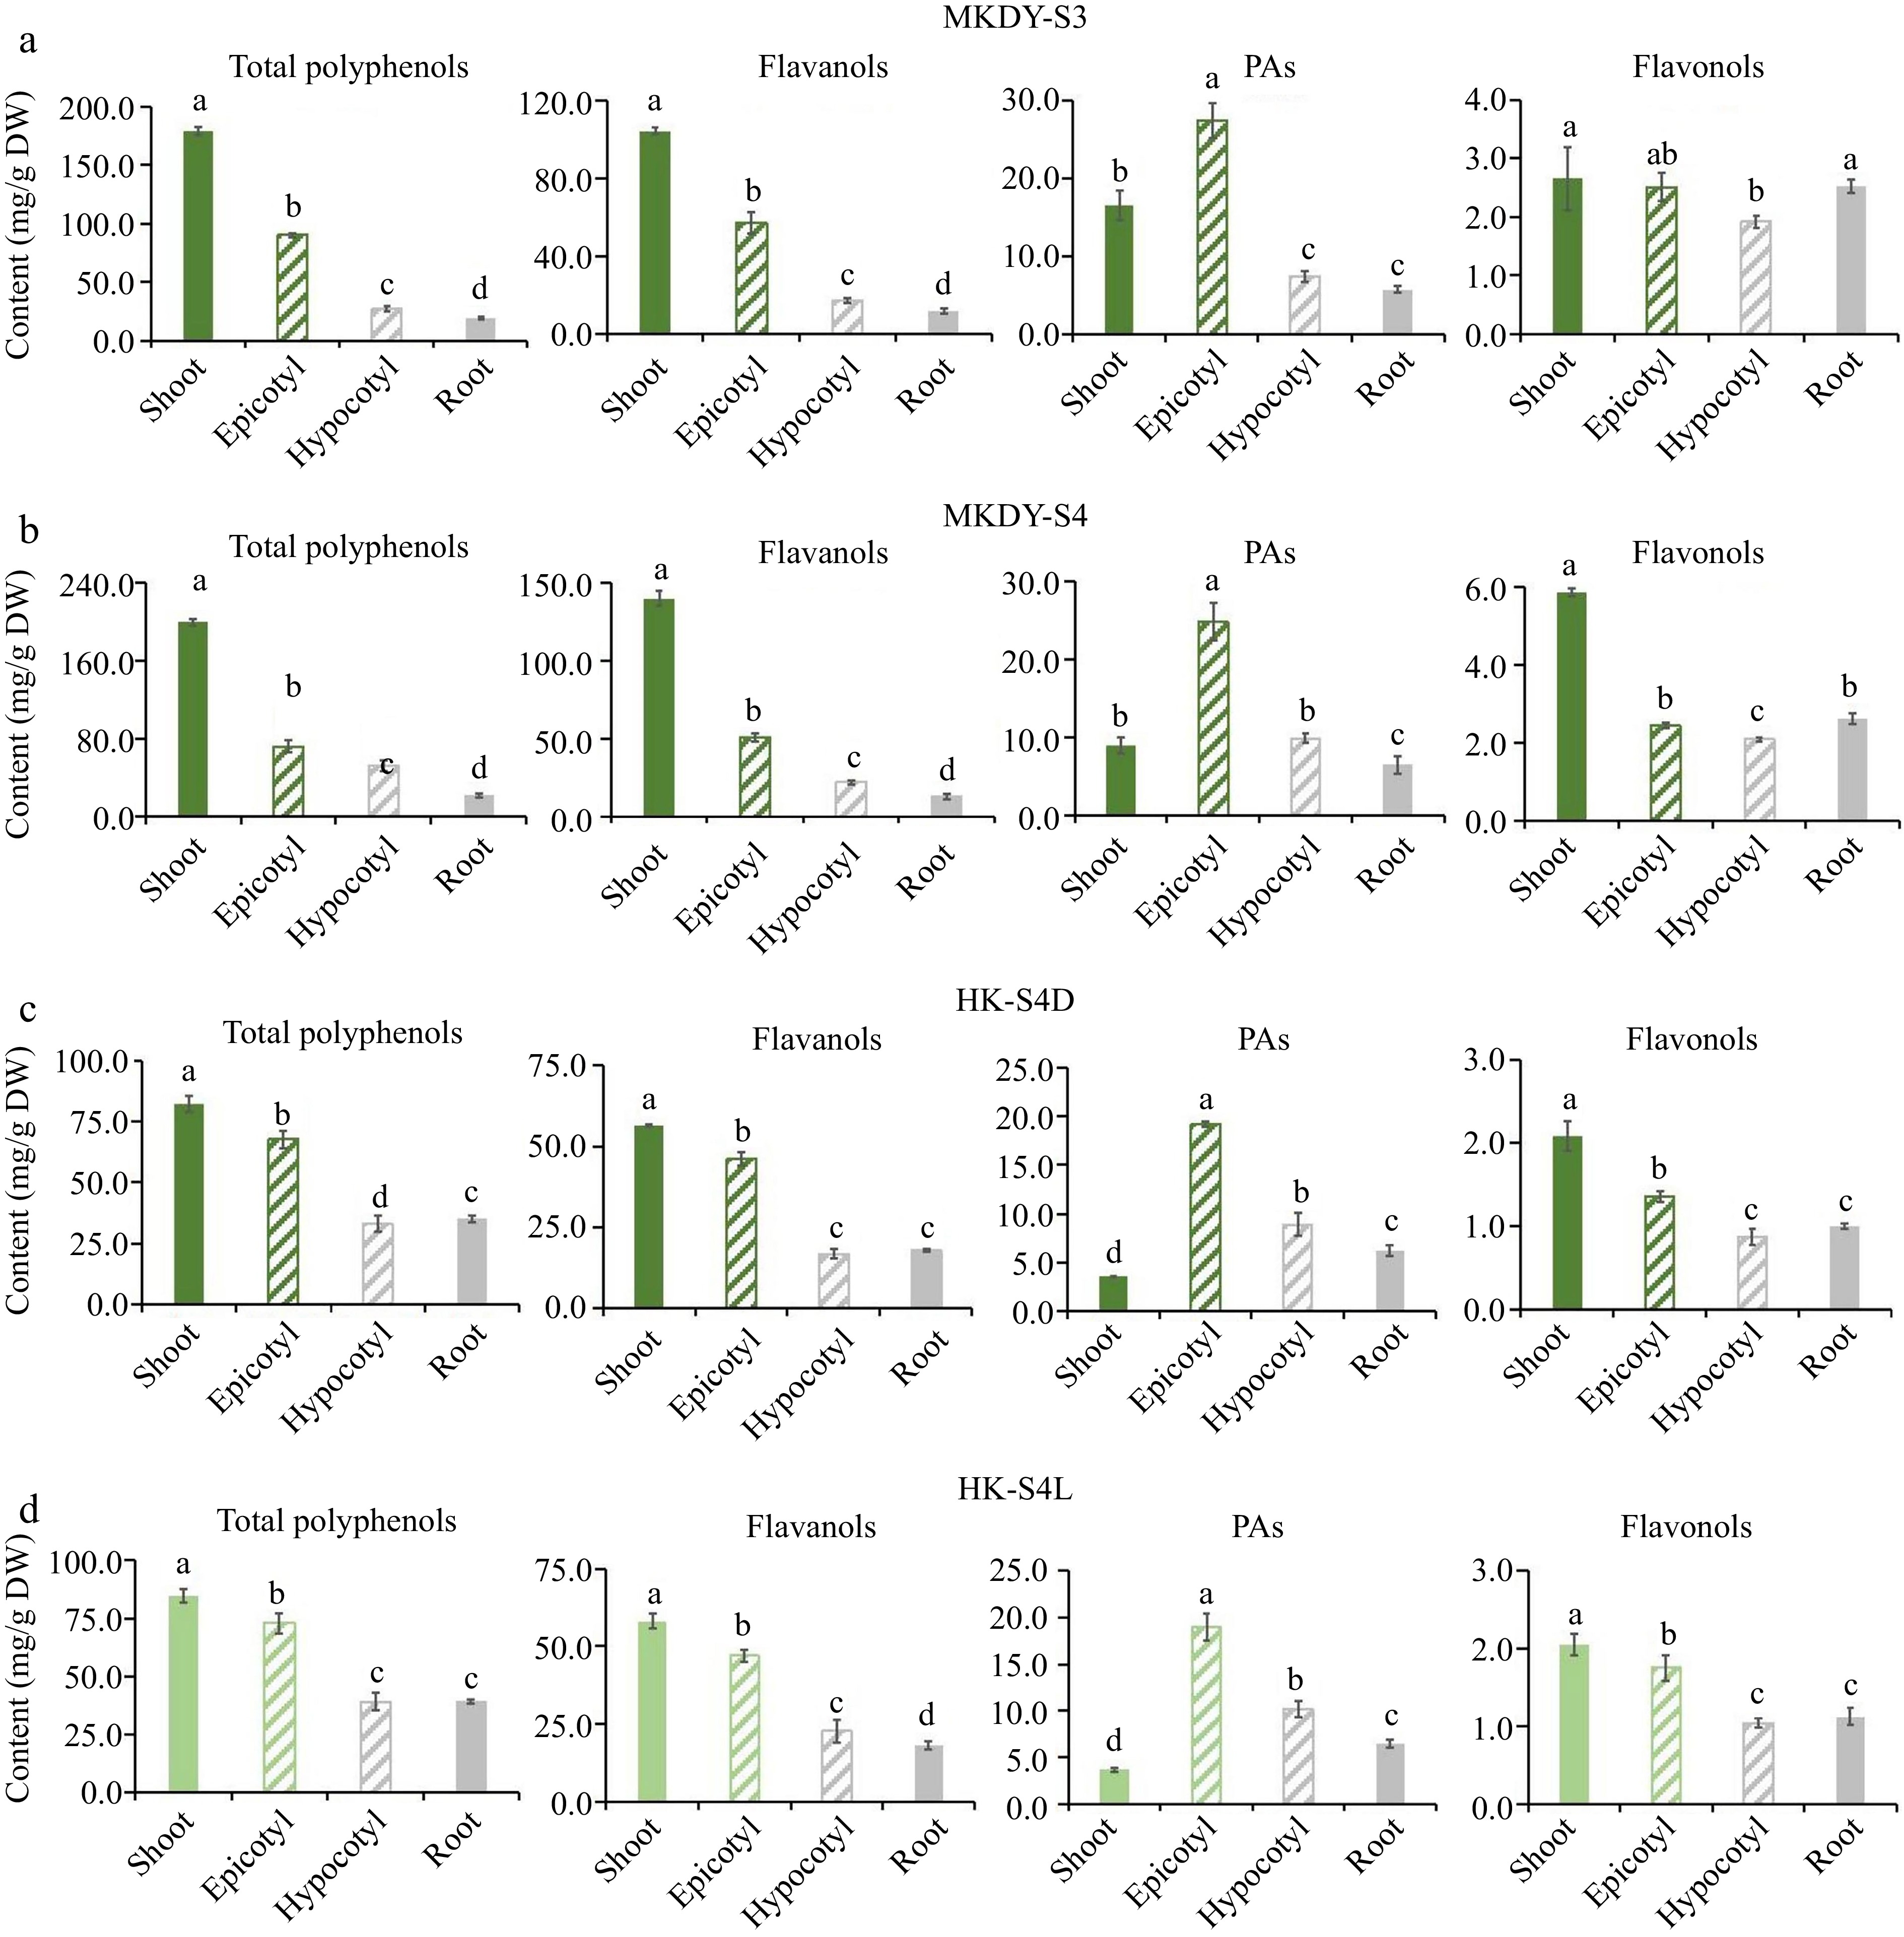
Figure 4.
Accumulation pattern of flavonoids in different tissues. (a), (b) Accumulation of flavonoids in different tissues at S2 and S3 stages of 'MKDY' tea seedlings. (c), (d) Accumulation of flavonoids in different tissues during S4D and S4L stages of 'HK' tea seedlings. DW: dry weight.
-
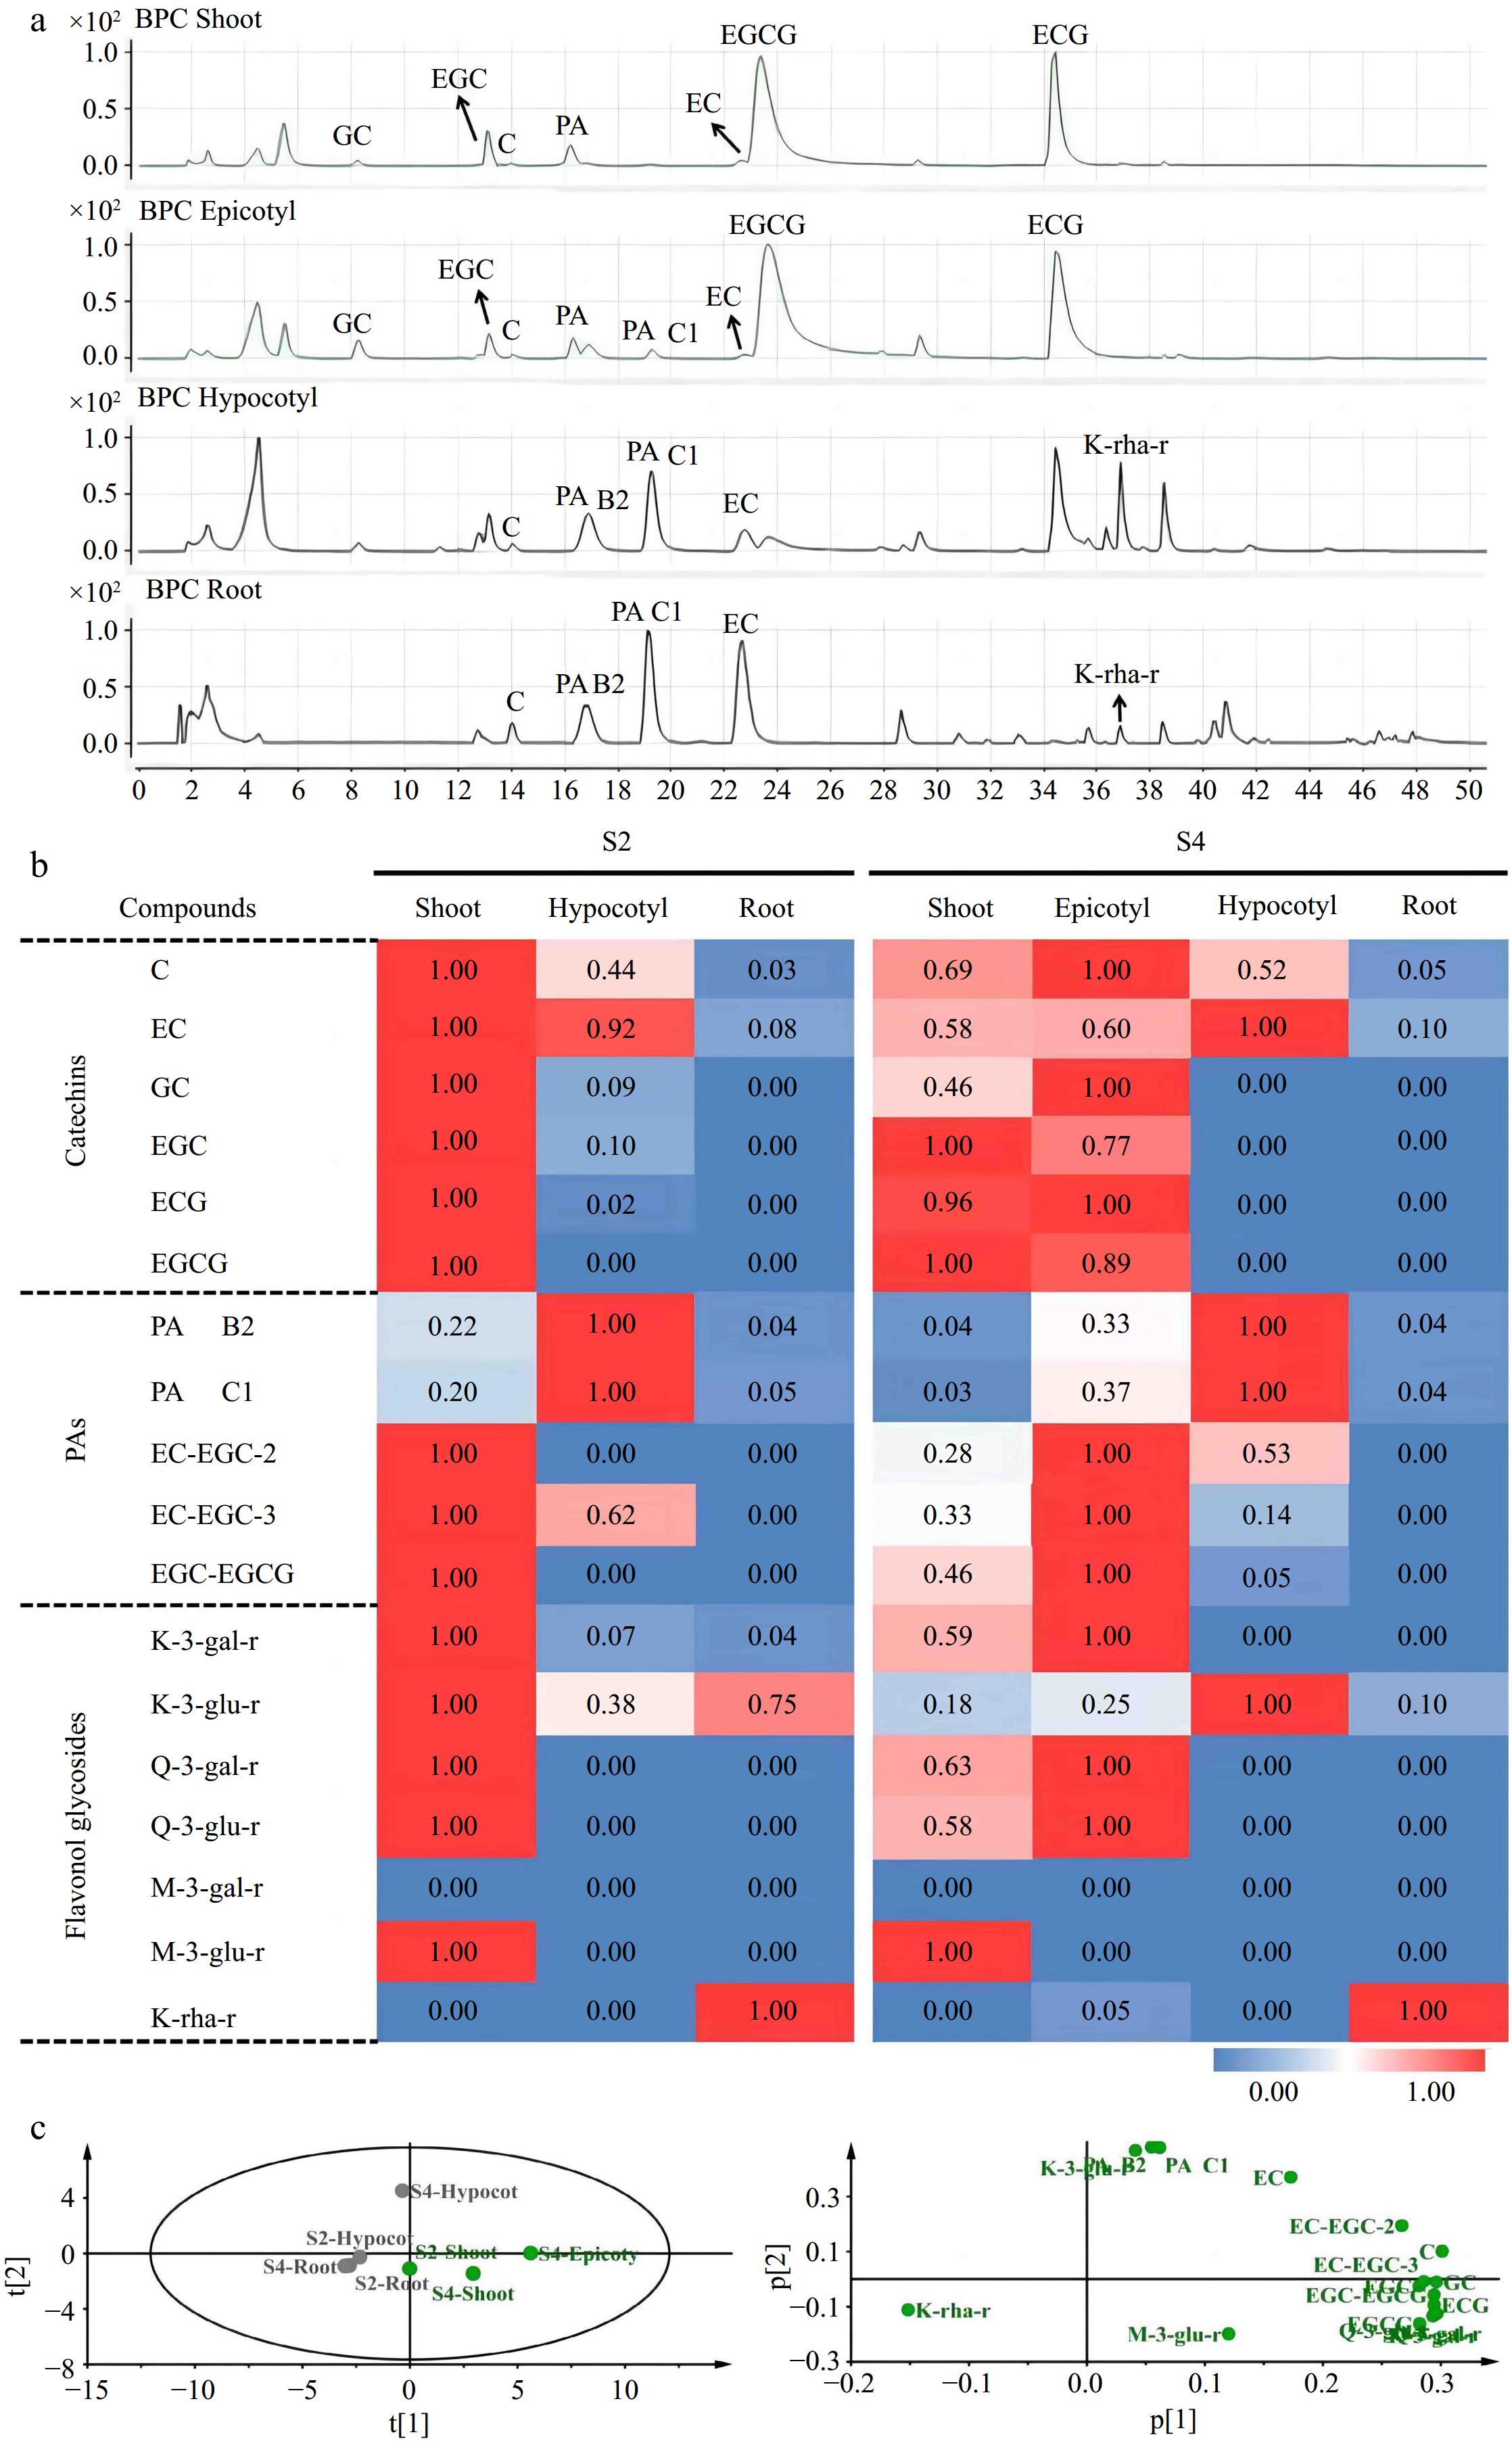
Figure 5.
Qualitative and quantitative analysis of flavonoids in 'MKDY' tea seedlings. (a) Total ion chromatogram of flavonoids in S4 stage. (b) Heat map of flavonoids in S2 and S4 stages. (c) PCA analysis of flavonoids in 'MKDY' tea seedlings.
-
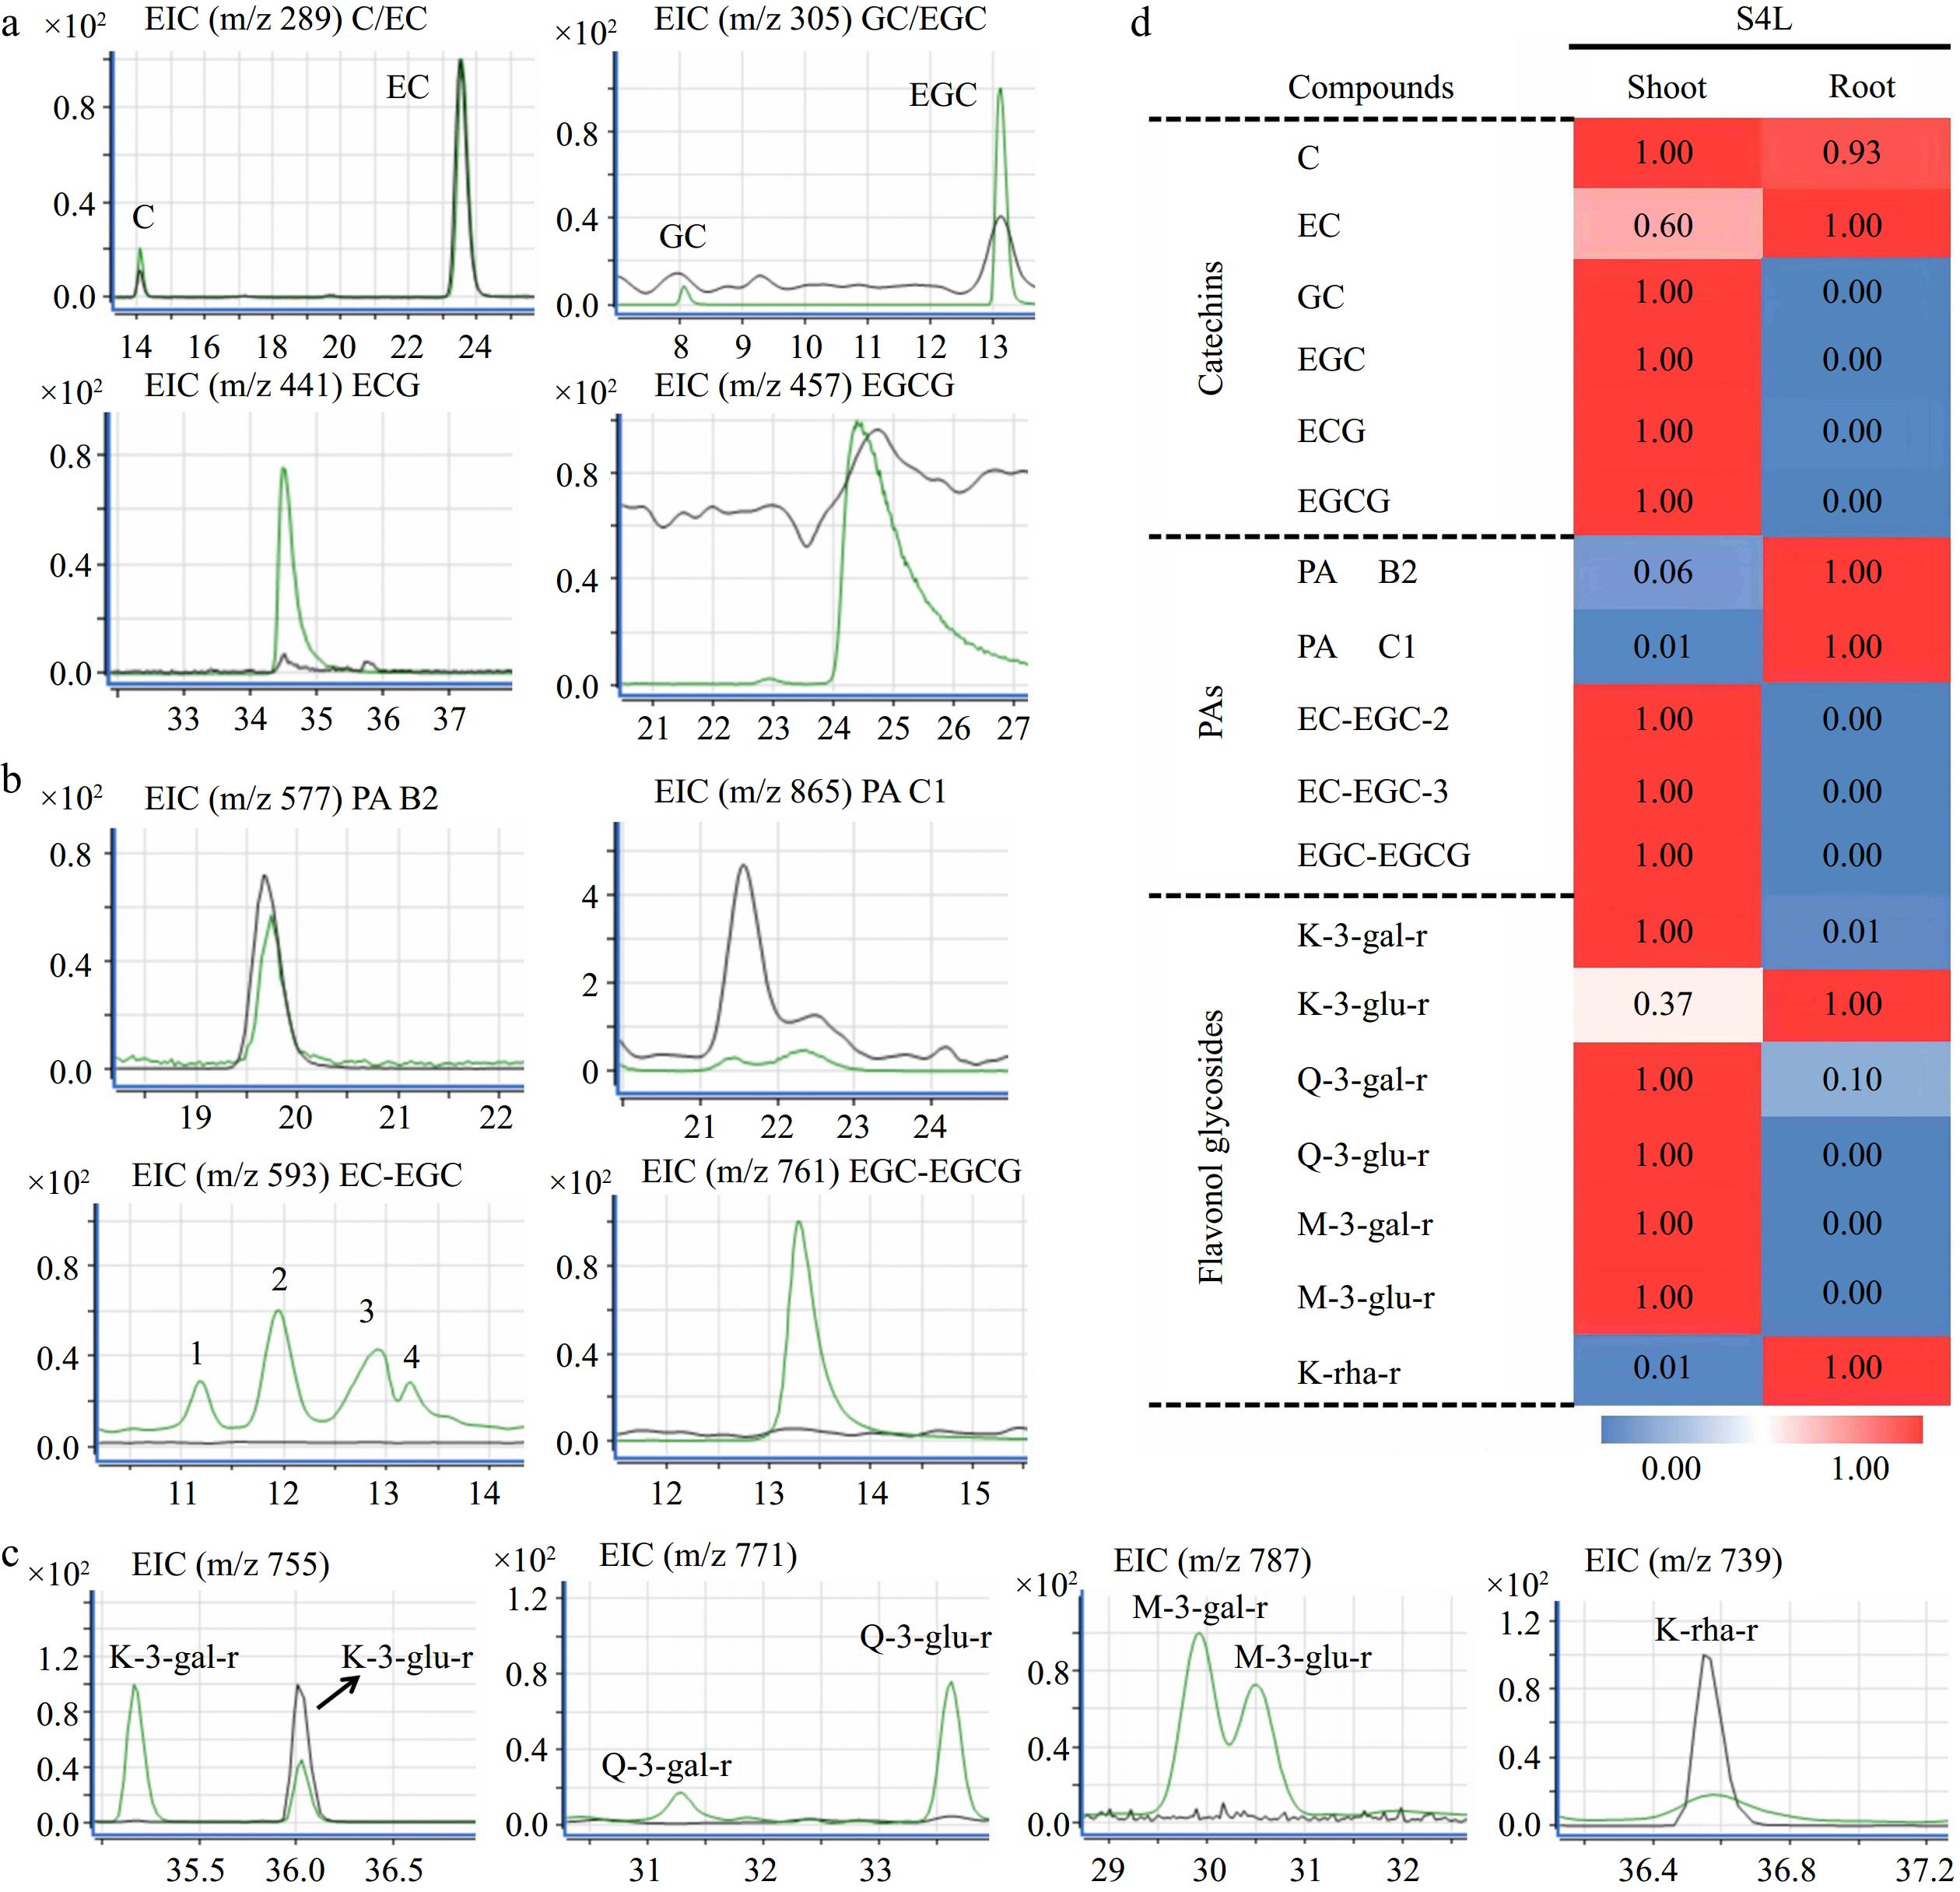
Figure 6.
Qualitative and quantitative analysis of flavonoids in 'HK' tea seedlings. (a) - (c) Ion chromatogram of flavanols, PAs, and flavonols in shoot and root of S4L stage, respectively. The green and gray peak lines represent the shoot and root, respectively. (d) Heat map of flavonoids in S4L stage.
-
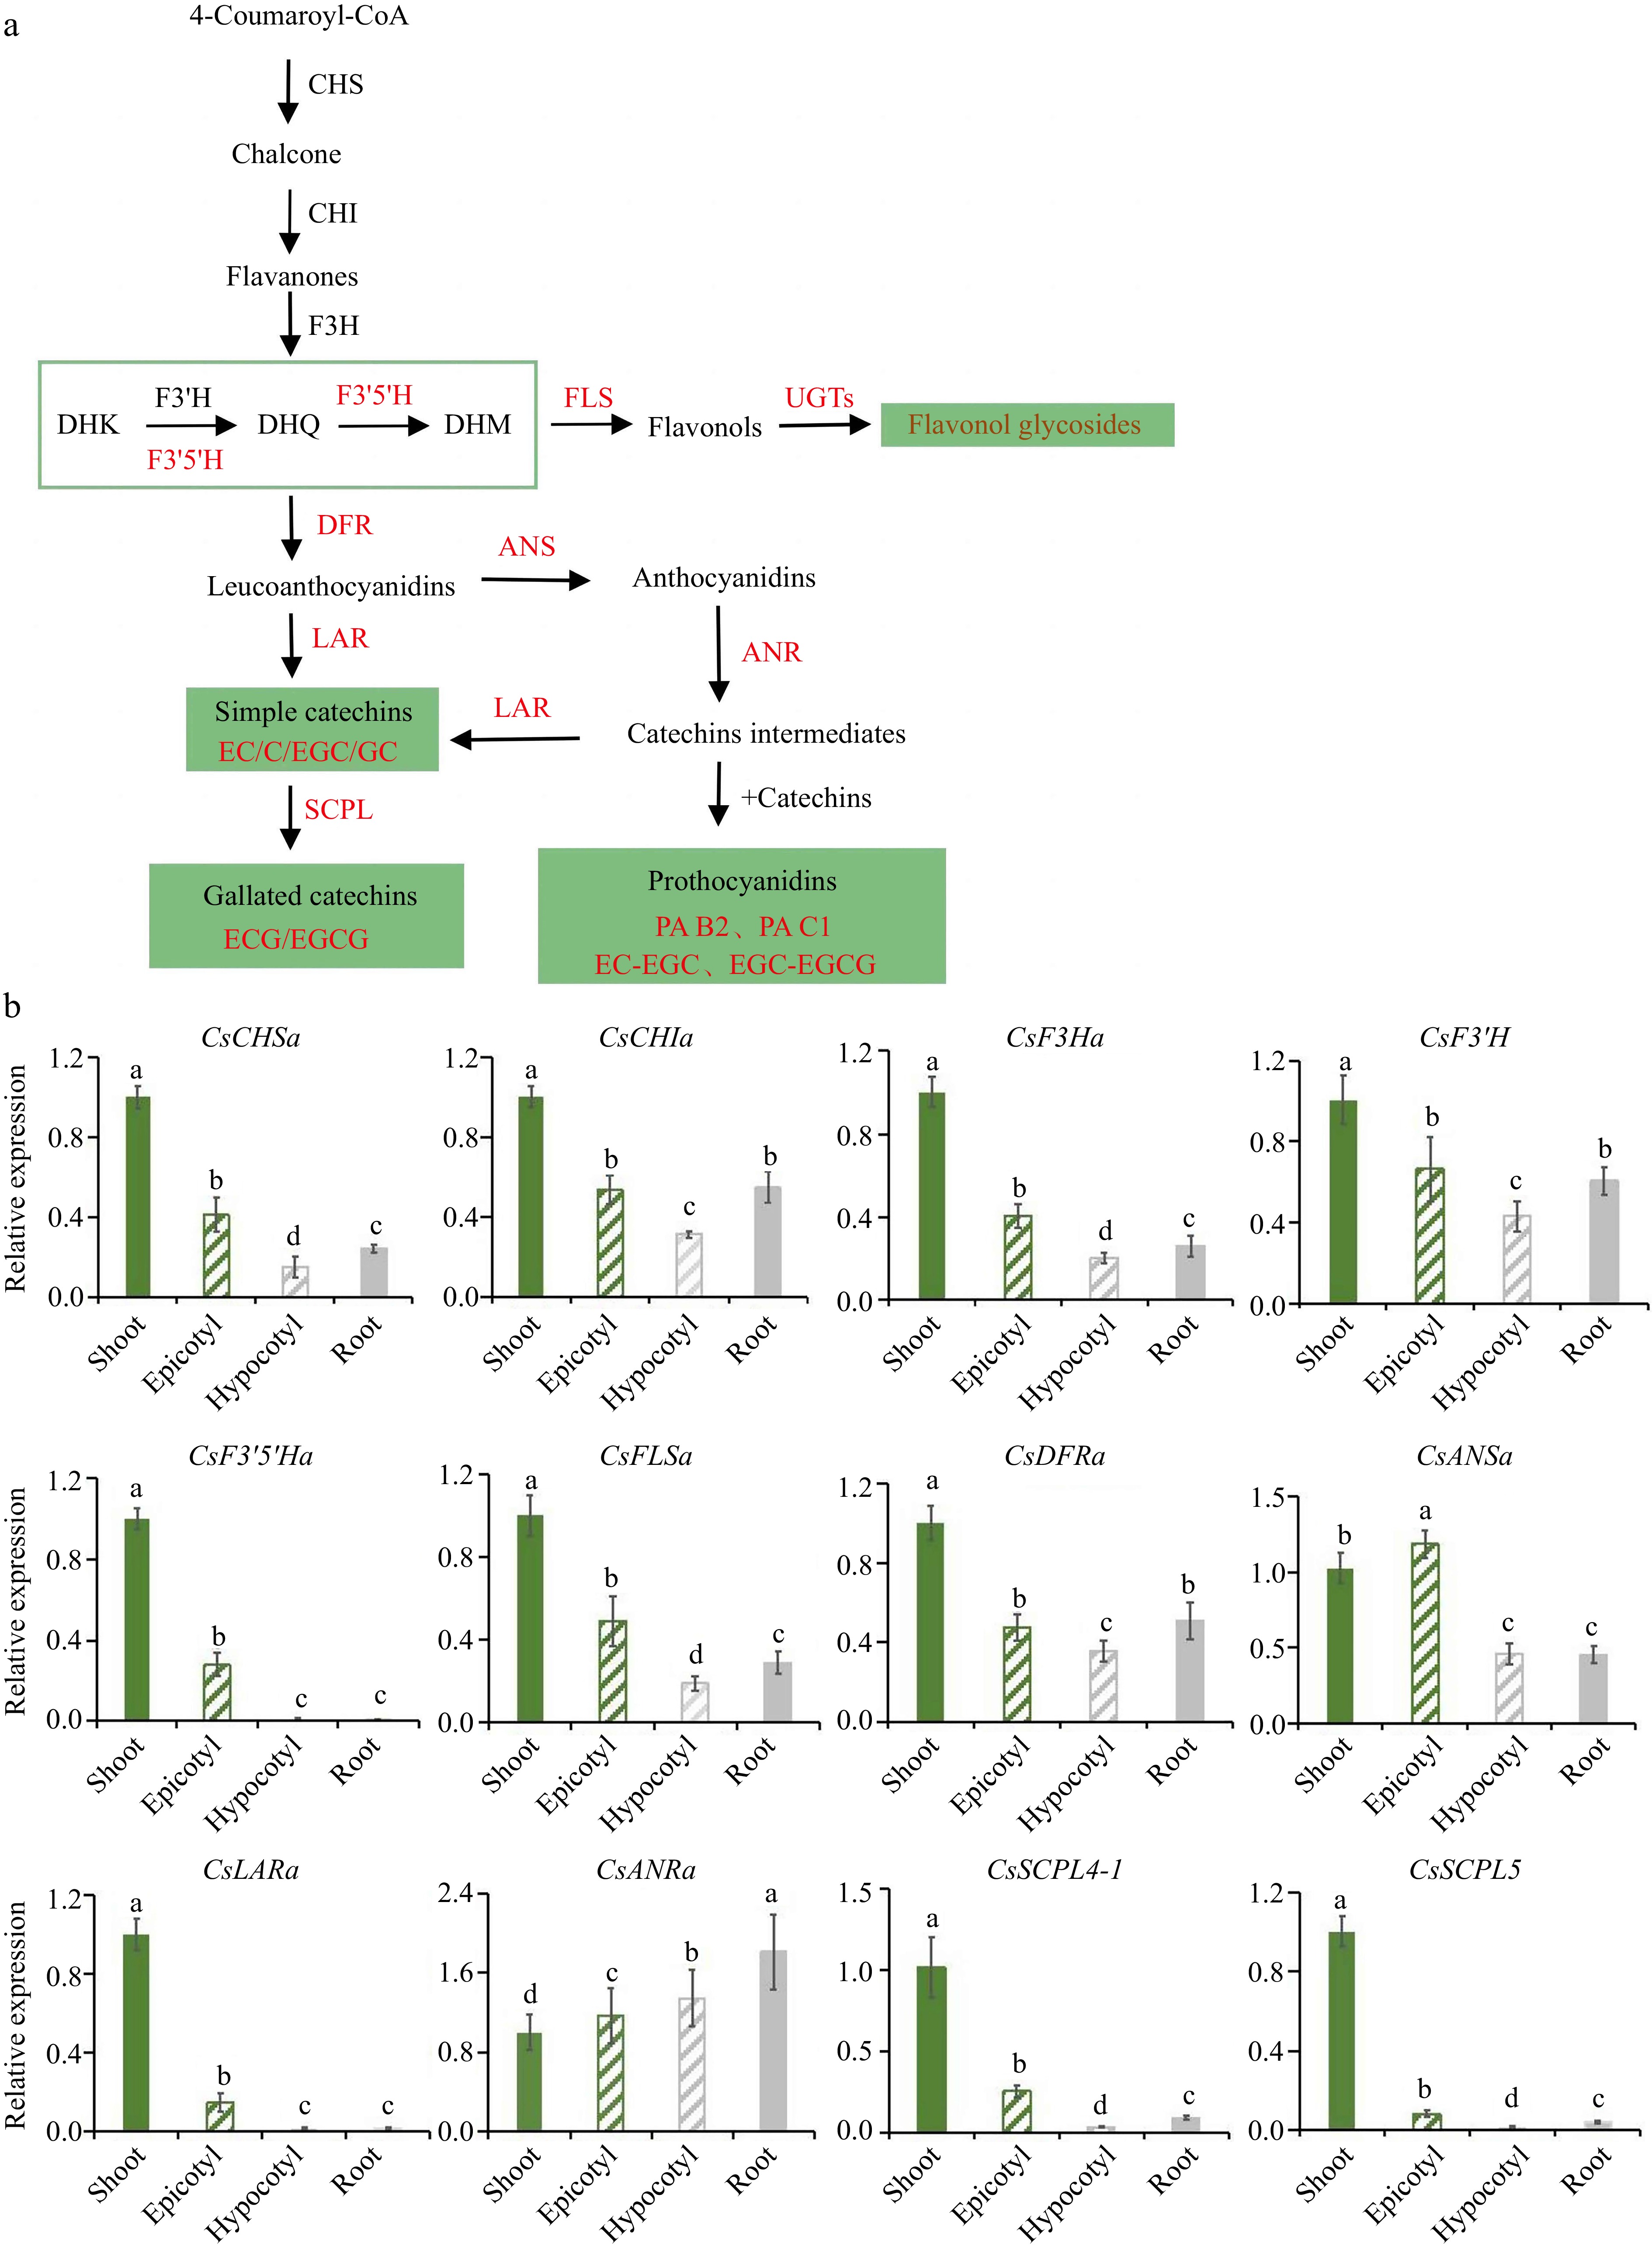
Figure 7.
qRT-PCR analysis of flavonoid pathway genes. (a) Pathway of flavonoid synthesis. (b) Relative expression amount of each gene.
-

Figure 8.
Accumulation model of flavonoid in tea seedlings.
Figures
(8)
Tables
(0)