-
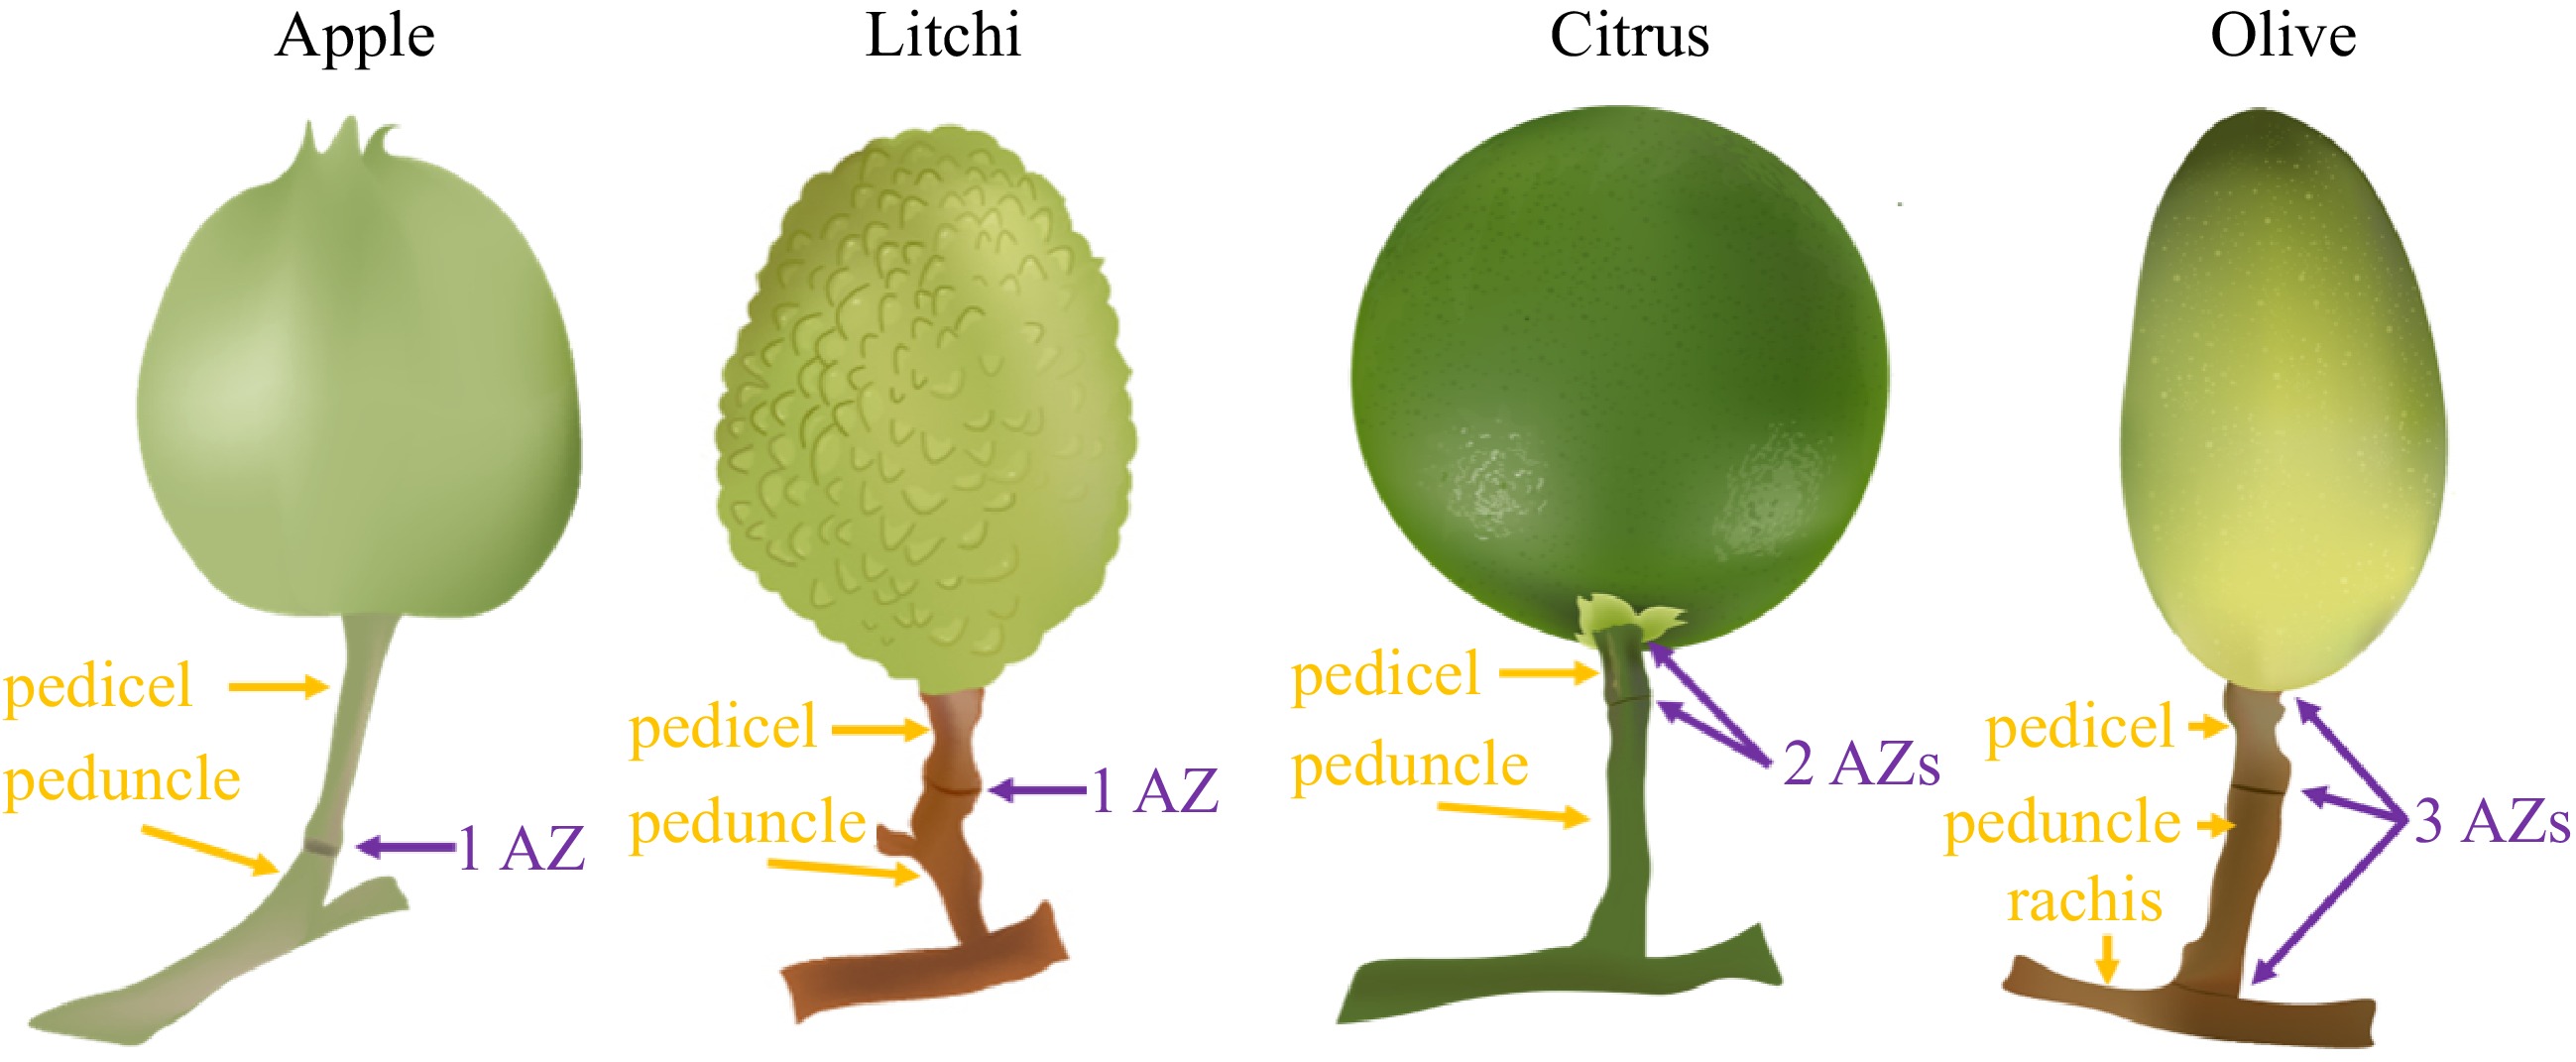
Figure 1.
The number of AZ varies among different woody fruit crop species. Apple and litchi fruits exhibit a single AZ localized at the junction region between the pedicel and peduncle. Citrus fruits possess two AZs localized at the junction between the fruit and pedicel (referred to as AZ-C) and the junction between the pedicel and peduncle (referred to as AZ-A), respectively. Olive fruits display three AZs localized at the junction between the fruit and pedicel, the junction between pedicel and peduncle, and the junction between the peduncle and rachis, respectively.
-
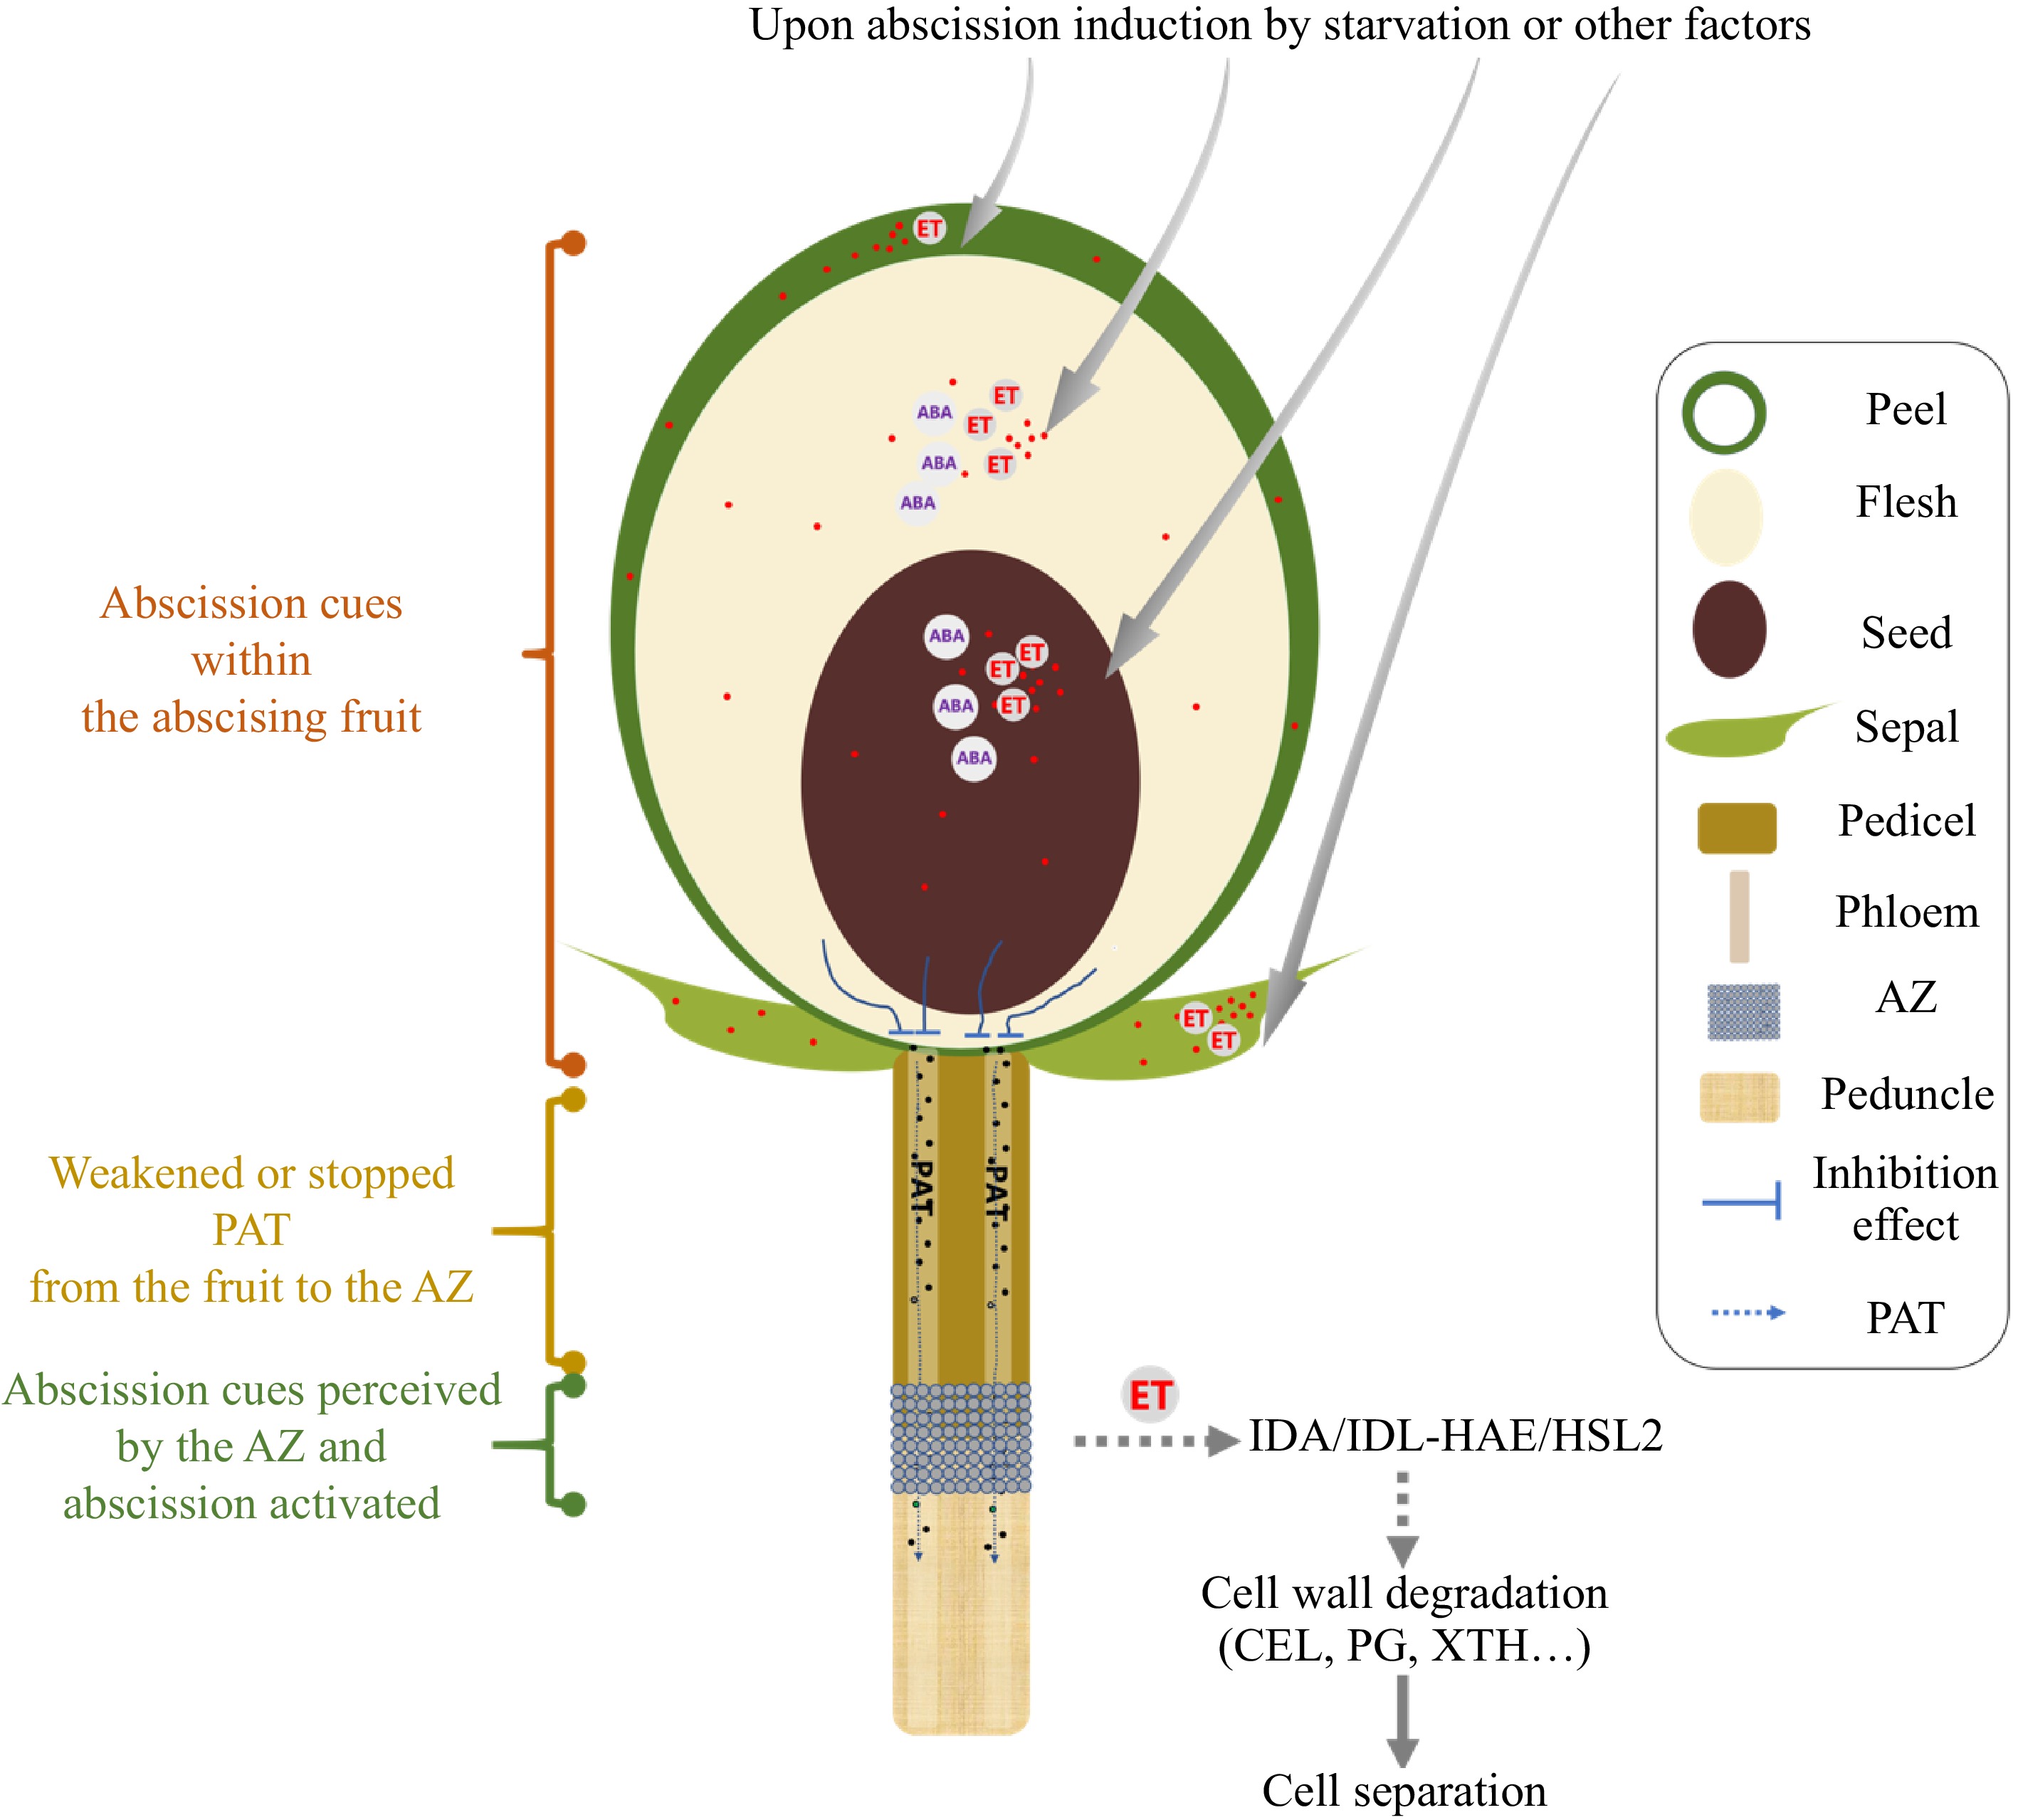
Figure 2.
A proposed model outlining the generation, transmission, and perception of abscission cues in woody fruit crop species. Upon abscission induction generally by carbohydrate shortage stress (starvation), the ethylene or abscisic acid (ABA) biosynthesis occurs within different parts of the fruit, depending on the species. For example, in apple fruitlets, the peel and flesh are responsible for the synthesis of ethylene and ABA. In avocado fruit, it is the seed, and in persimmon fruit, it is the sepal. The production of ethylene and ABA within the abscising fruit weakens or halts the polar auxin transport (PAT) from the fruit to the abscission zone (AZ). However, the precise mechanisms by which this occurs are currently unknown. When PAT is weakened or stopped across the AZ, it renders the AZ sensitive to ethylene or triggers the biosynthesis of ethylene within the AZ. In addition, both the ABA and ethylene (ET) generated in the fruit may also be transported to the AZ and participate in ethylene burst within the AZ. This ethylene production can be perceived by the IDA/IDL-HAE/HSL2 signaling pathway, likely through the binding of transcription factors involved in ethylene signaling. Subsequently, the cell separation process is initiated and is accomplished through the action of specific enzymes involved in the degradation of the cell wall, including cellulase (CEL), polygalacturonase (PG), and xyloglucan endotransglucosylase/hydrolase (XTH). Symbols used in the diagram are explained in the legend.
Figures
(2)
Tables
(0)