-
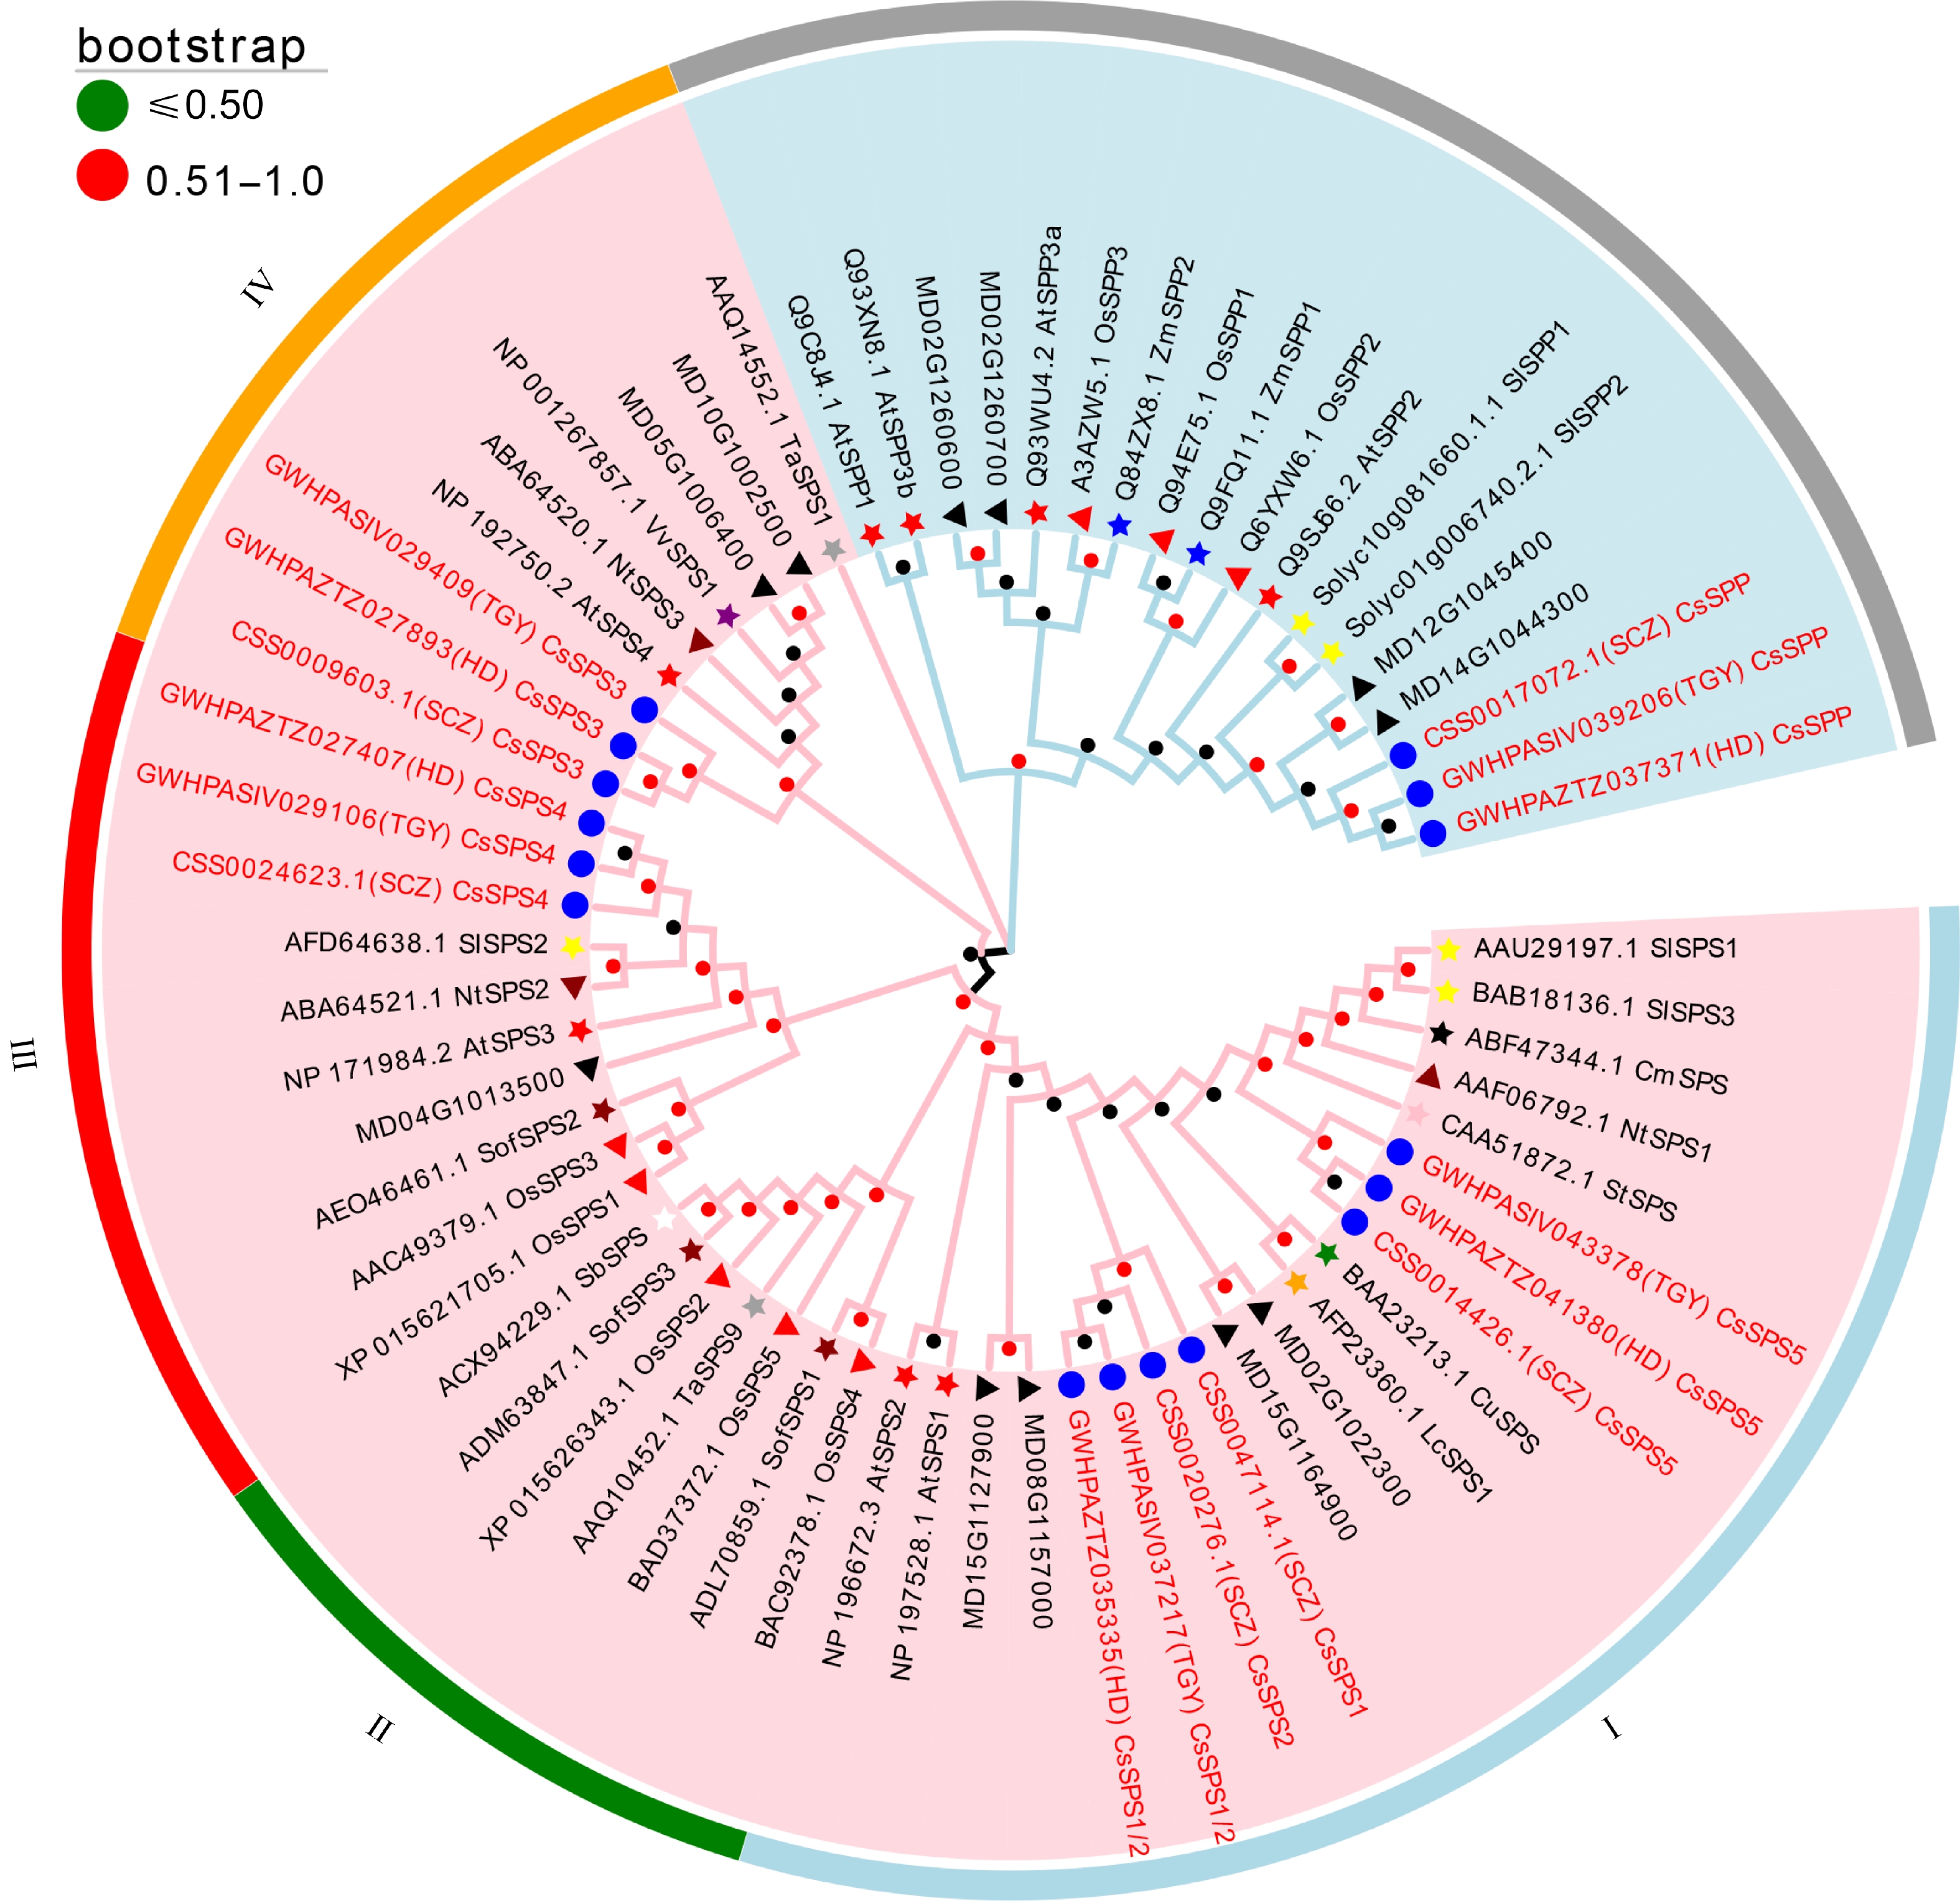
Figure 1.
Phylogenetic analysis of SPPs and SPSs originating from 15 different plant species. Pink area: SPS family; Light blue area: SPP family. Blue circle: tea plant; red star: Arabidopsis; red triangle: rice; blue star: maize; yellow star: tomato; dark red star: spinach; dark red triangle: tobacco; black star: melon; green star: citrus; purple star: grape; gray star: wheat; pink star: potato; orange star: litchi; white star: sorghum; black triangle; apple. Bootstrap values of all branches are above 50%.
-
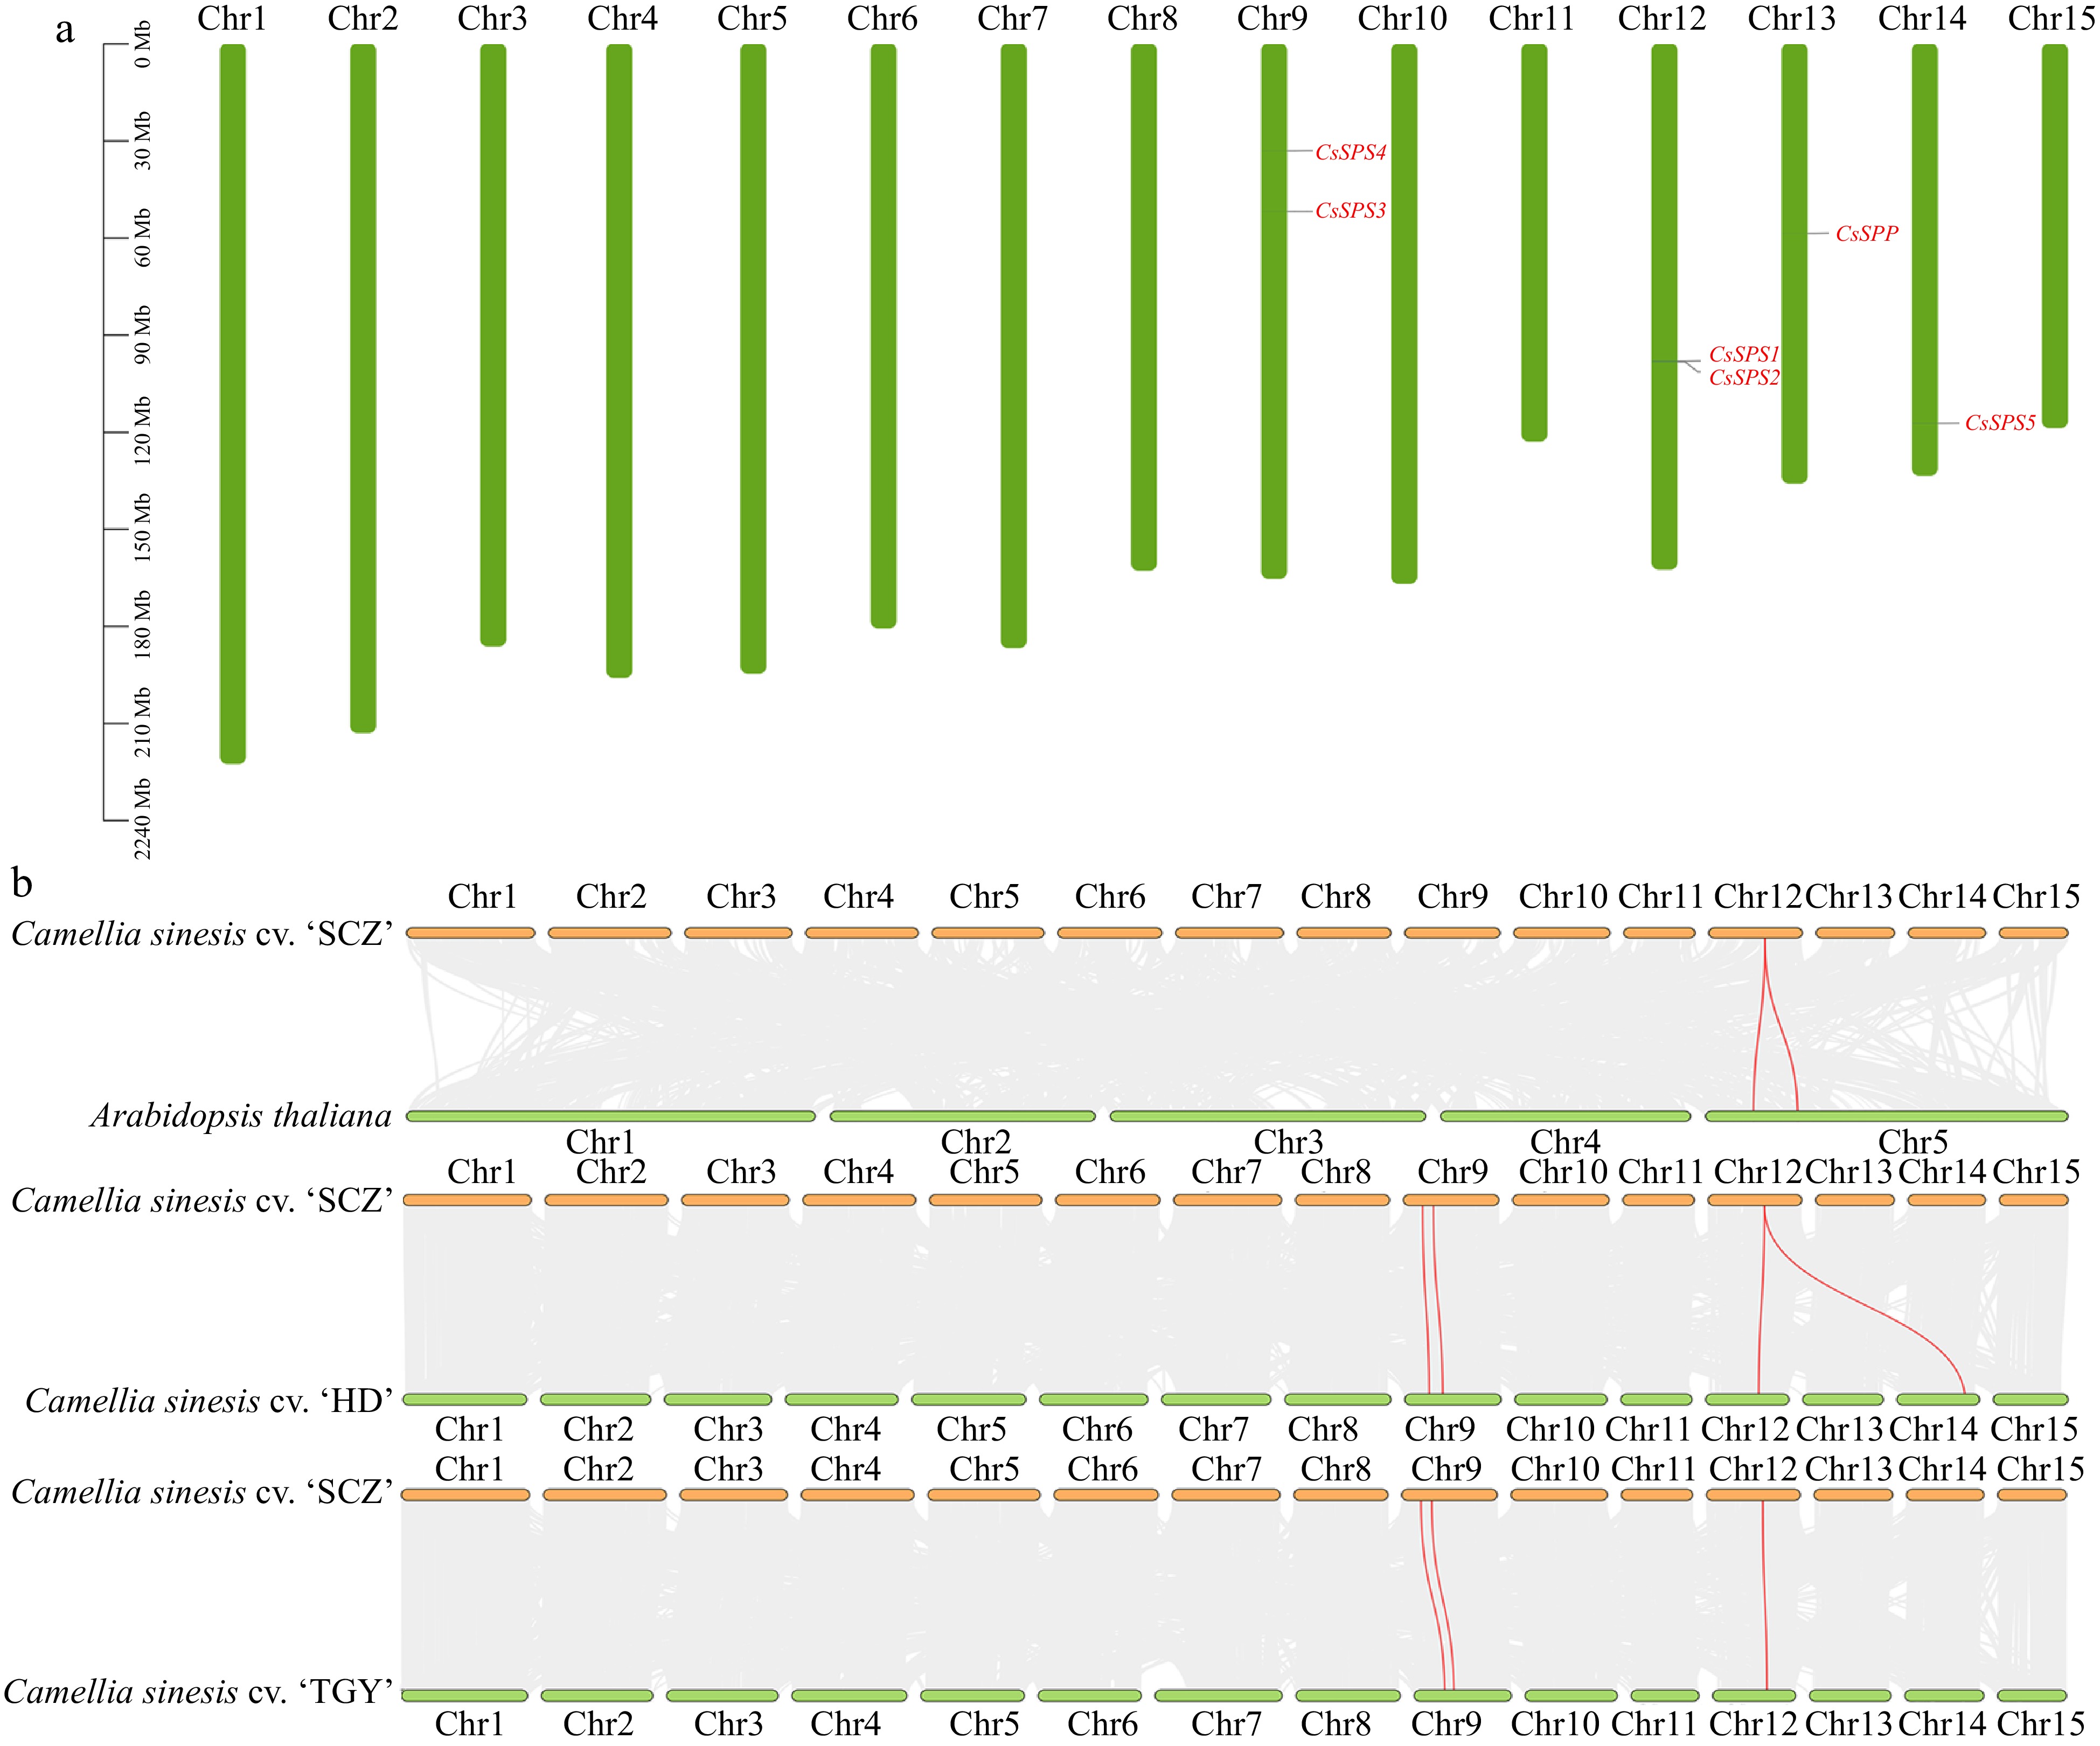
Figure 2.
Chromosomal location and collinearity analysis of CsSPP and CsSPSs. (a) Chromosomal distribution of CsSPP and CsSPSs in 'Shuchazao' genome. (b) Interspecies synteny analysis of CsSPP and CsSPSs in 'Shuchazao' associated with Arabidopsis, 'Huangdan' and 'Tieguanyin' genomes.
-
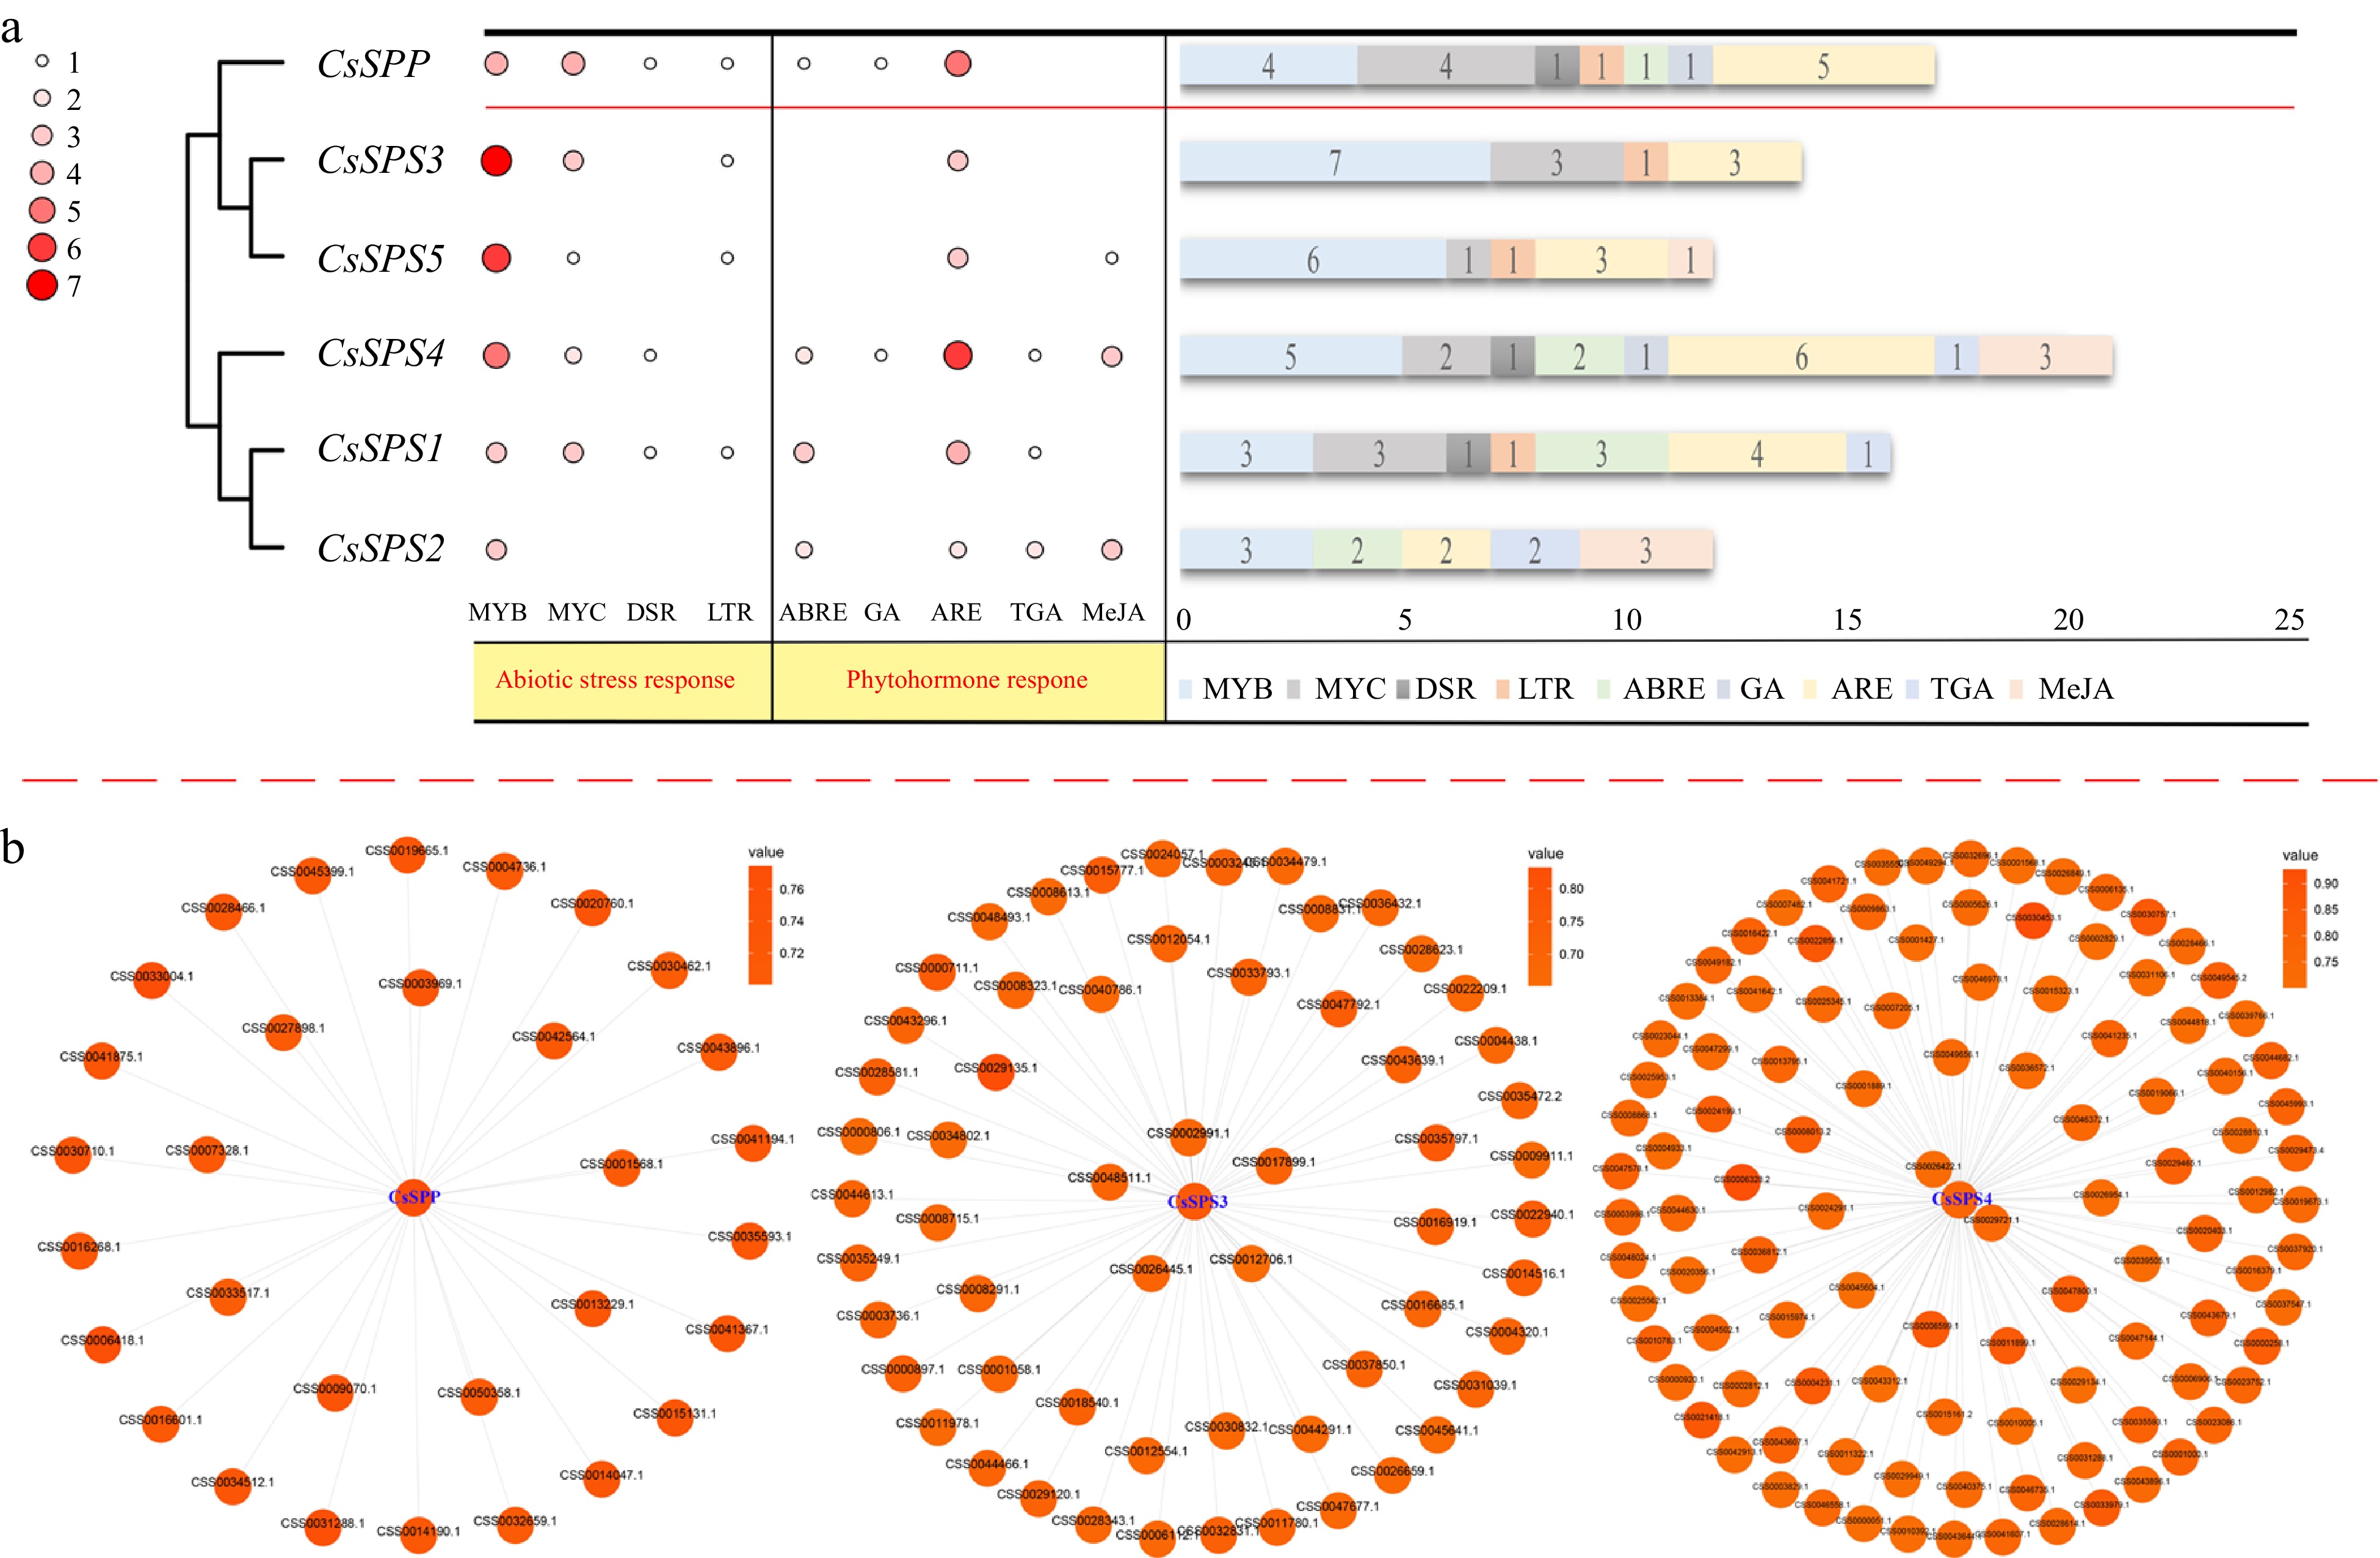
Figure 3.
The cis-acting elements in the promoters of CsSPP and CsSPSs, and co-expression networks of CsSPP and CsSPSs. (a) cis-acting elements in promoters of CsSPP and CsSPSs. The heat map displays the type and number of cis-acting elements and the bar chart displays the number of cis-acting elements. MYB: myeloblastosis; MYC: myelocytomatosis; DSR: defense and stress responsiveness; LTR: low-temperature responsiveness; ABRE: abscisic acid responsiveness; GA: gibberellin-responsiveness; ARE: anaerobic induction; TGA: auxin-responsive element; MeJA: MeJA-responsiveness. (b) Co-expression networks of CsSPP and CsSPSs 3/4.
-
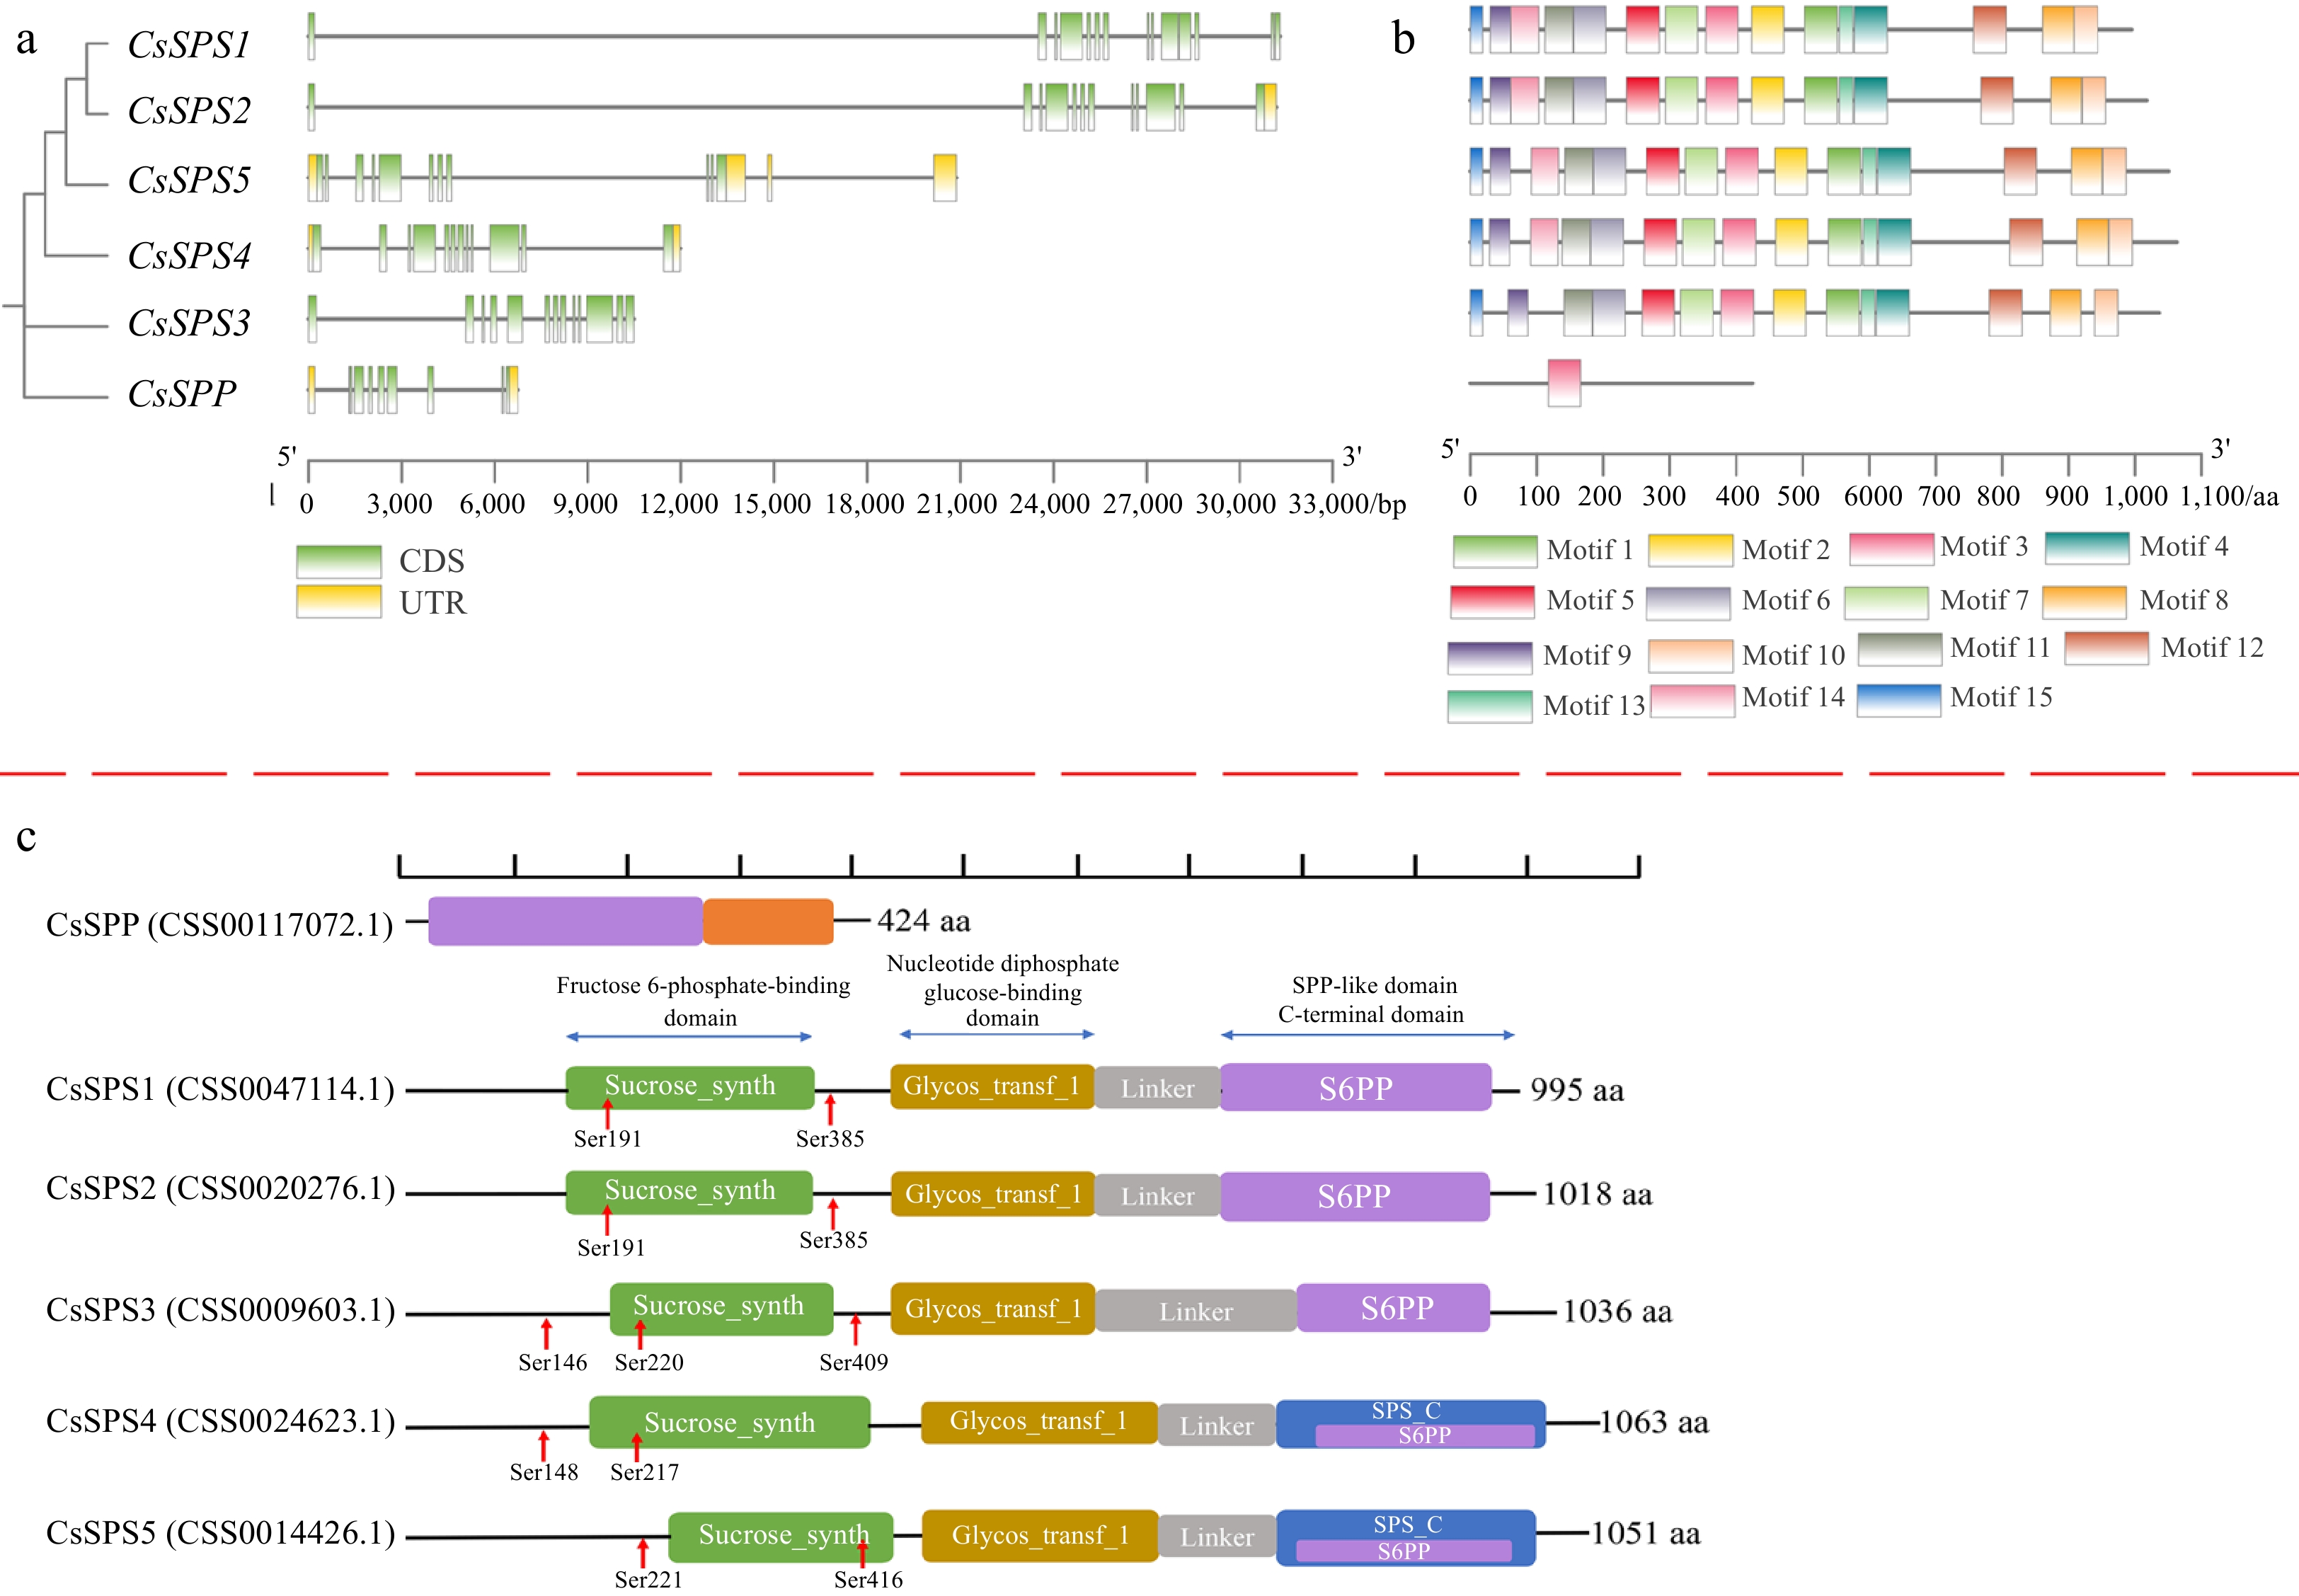
Figure 4.
The exon-intron structures CsSPP and CsSPSs, conserved motifs and domains of CsSPP and CsSPSs. (a) The exon-intron structures CsSPP and CsSPSs. Green boxes represent exons, yellow boxes represent untranslated upstream/downstream regions, and lines indicate introns. (b) Conserved motifs of CsSPP and CsSPSs. Different motifs are presented by different colored squares. (c) Conserved domains of CsSPP and CsSPSs. Different domains are shown in different colors.
-
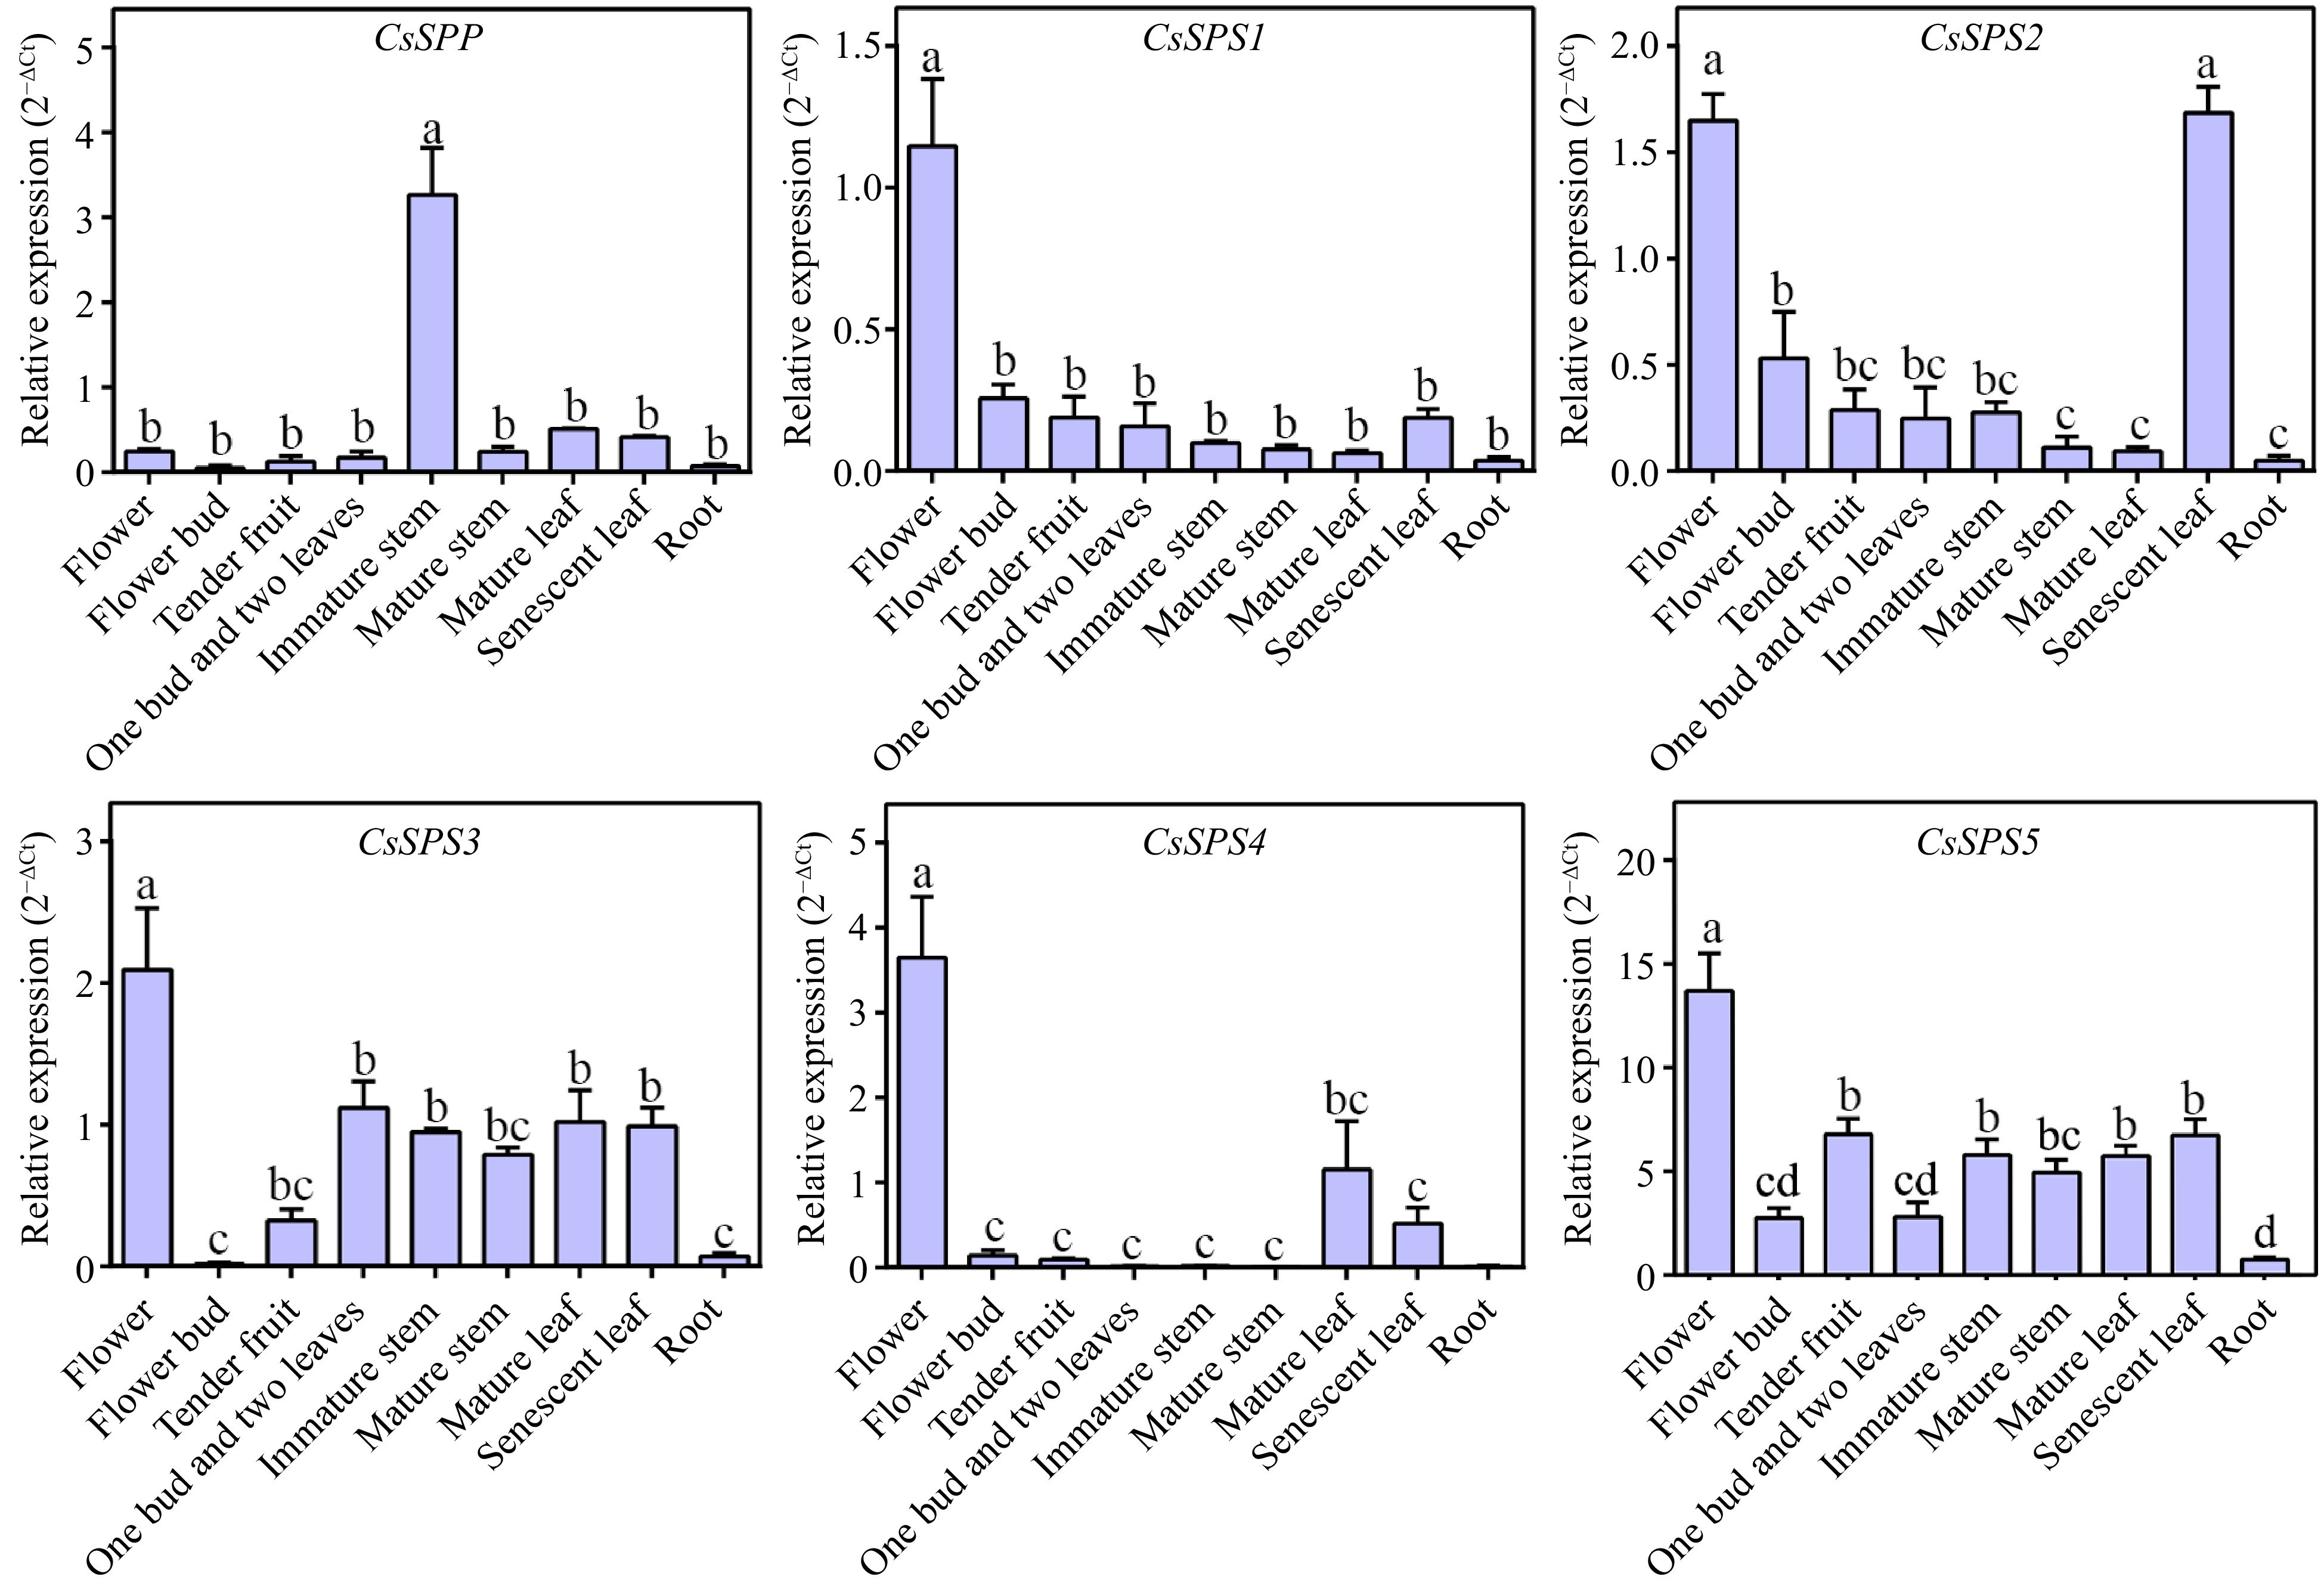
Figure 5.
Tissue-specific analysis of CsSPP and CsSPSs in tea plant.
-
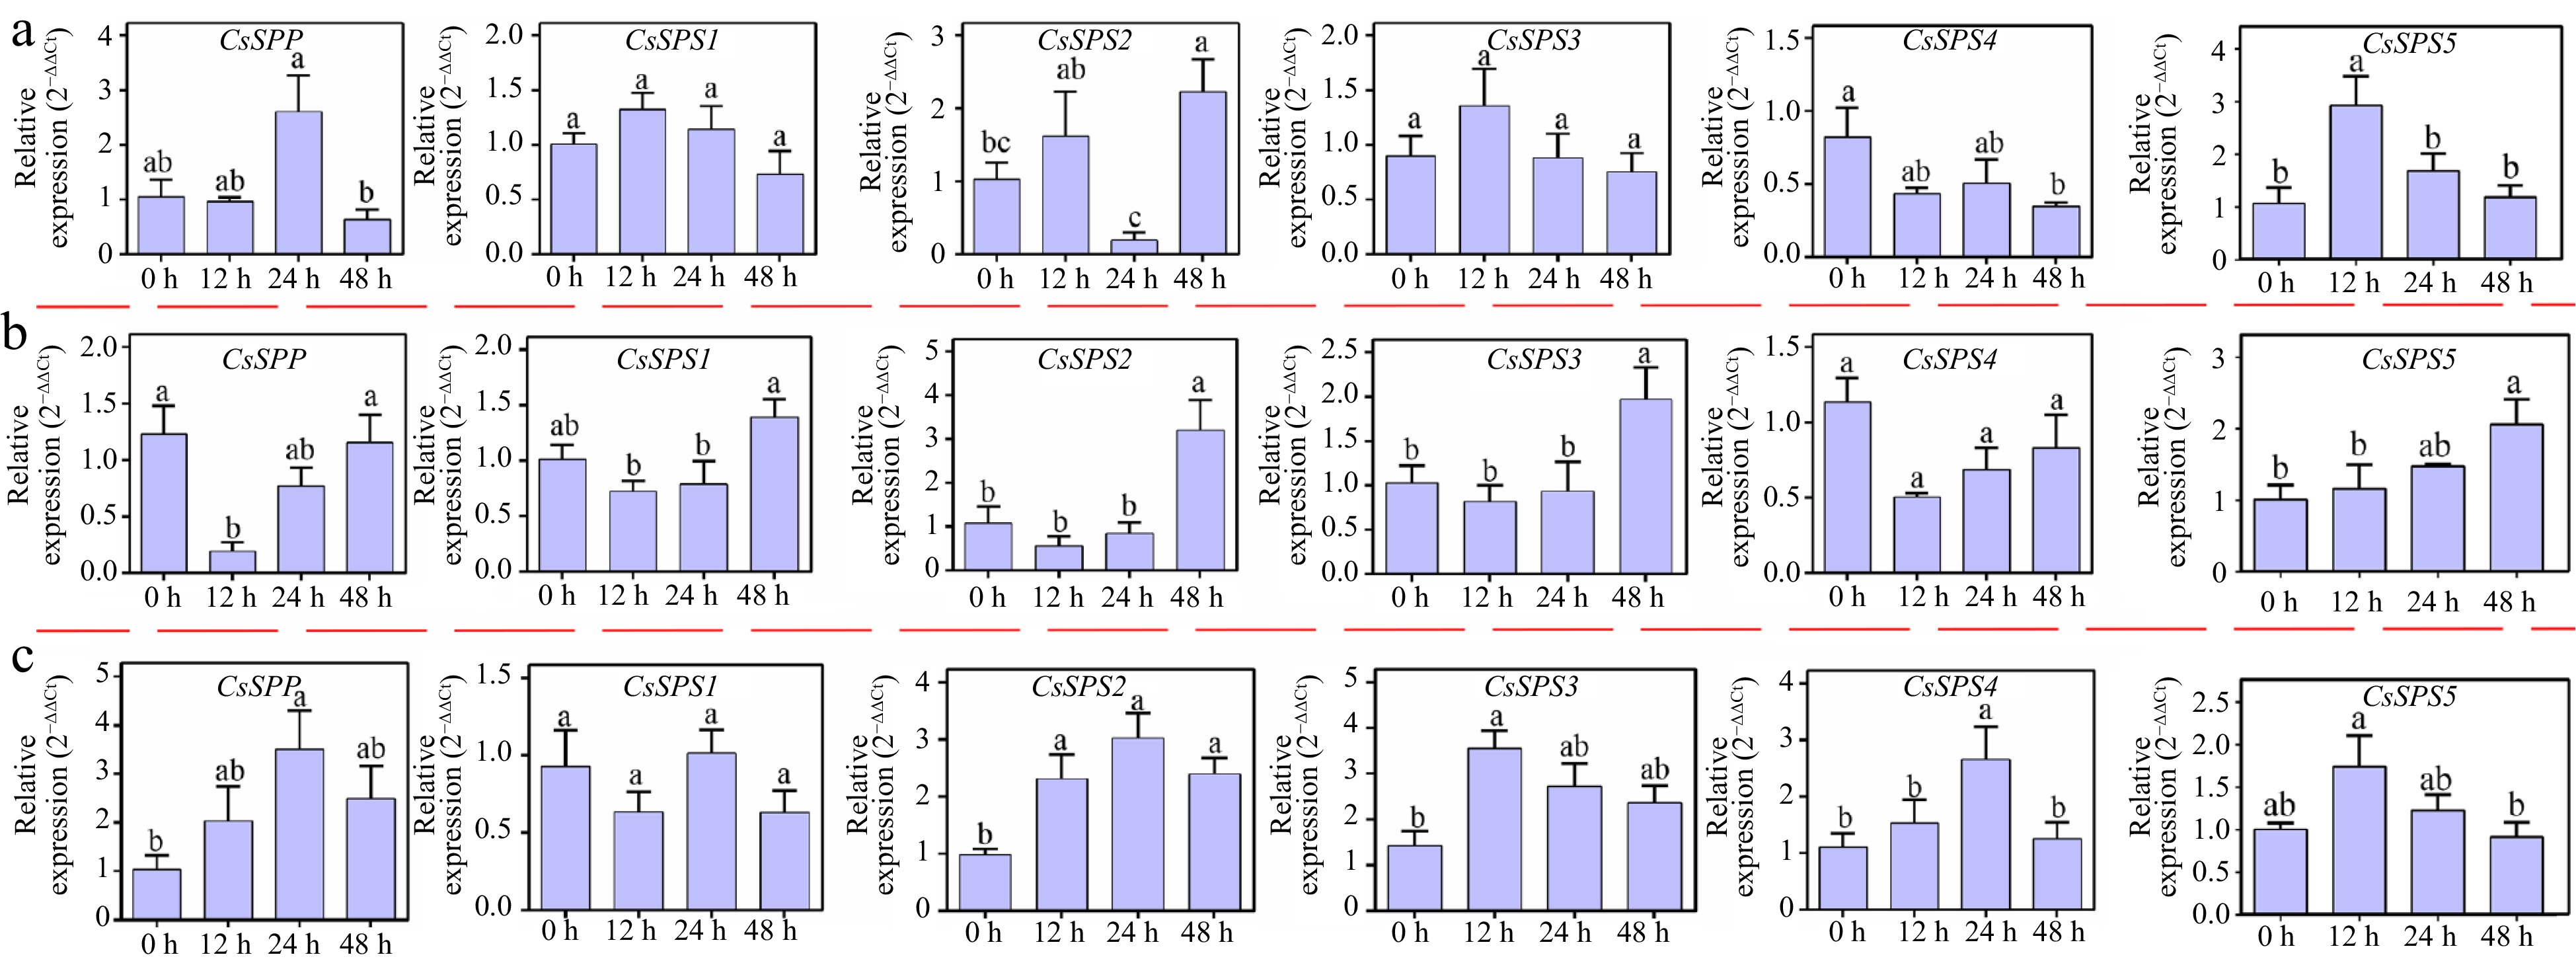
Figure 6.
Expression analysis of CsSPP and CsSPSs under different abiotic stress conditions. (a) Expression profiles of CsSPP and CsSPSs under salt stress conditions. (b) Expression profiles of CsSPP and CsSPSs under cold stress conditions. (c) Expression profiles of CsSPP and CsSPSs under drought stress conditions.
-
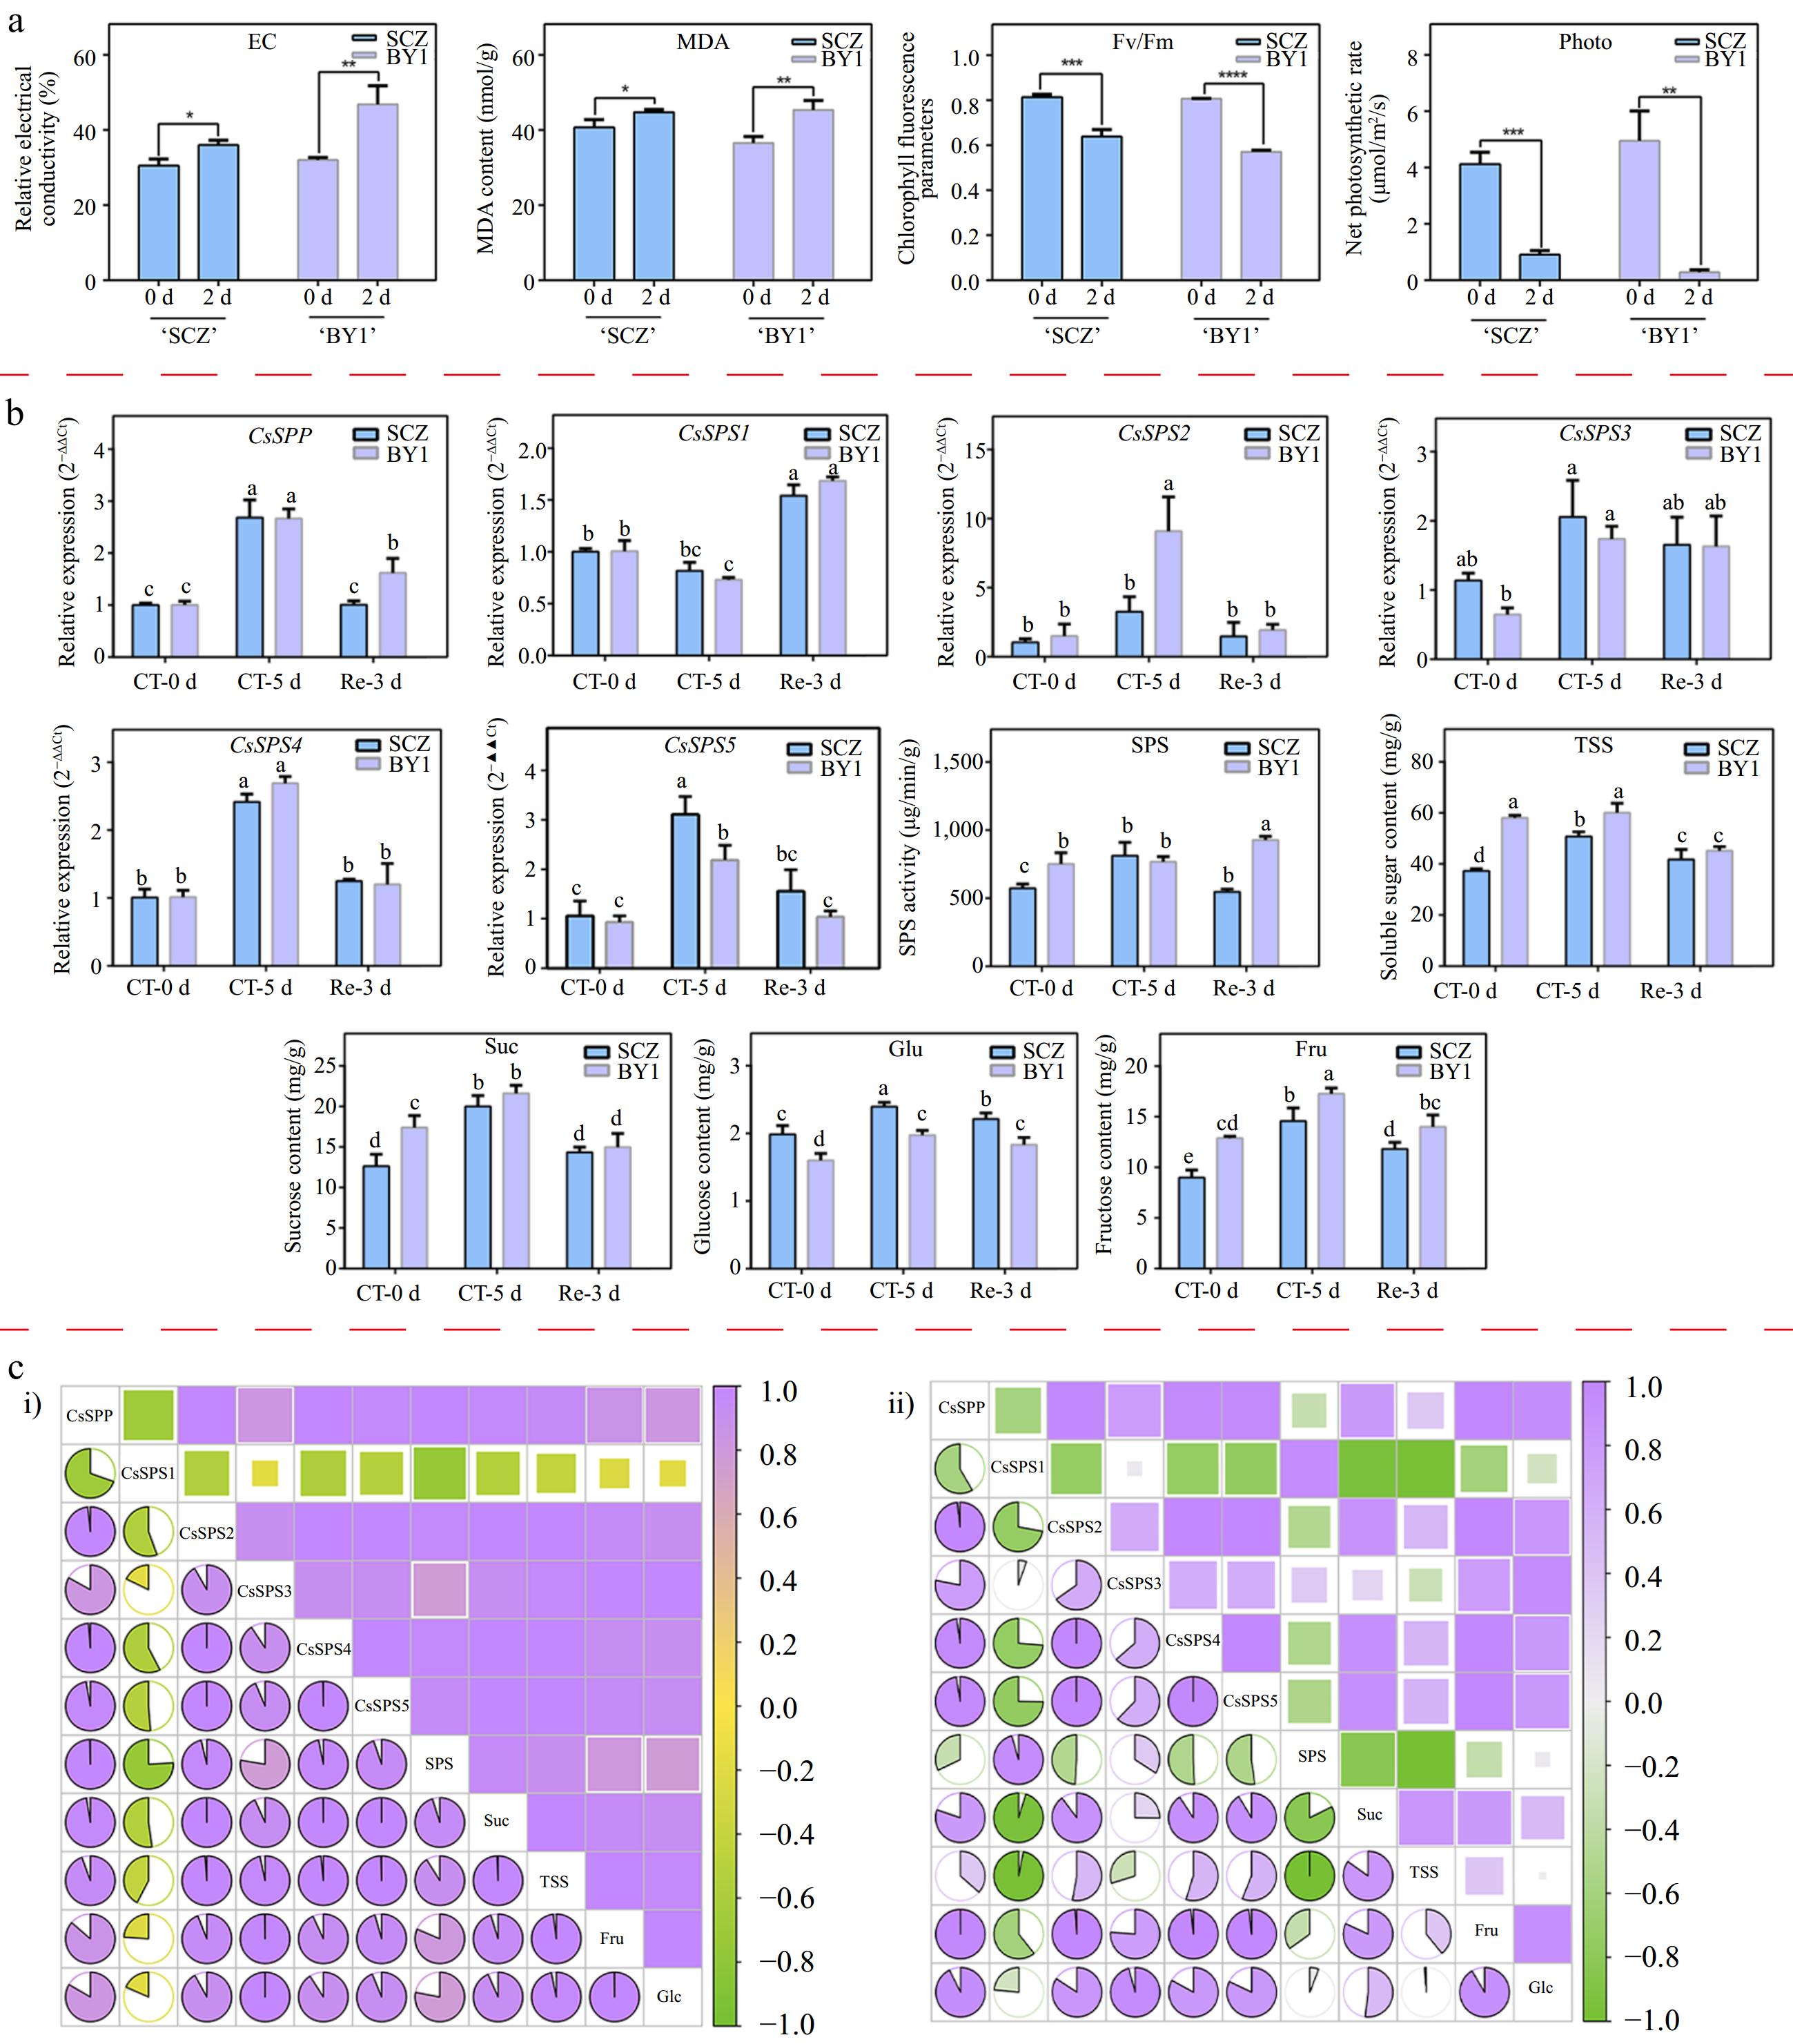
Figure 7.
Expression analysis of CsSPP and CsSPSs in different tea plant cultivars under cold stress conditions. (a) Relative electrolytic leakage, malondialdehyde and photosynthetic parameters of 'Shuchazao' and 'Baiye1' under cold stress conditions. (b) Expression levels of CsSPP and CsSPSs, SPS activity and different types of soluble sugar content. (c) Correlation analysis of CsSPP and CsSPSs, SPS activity and different types of soluble sugar components in 'Shuchazao' and 'Baiye1' cultivars, respectively. (c-i) Correlation analysis of CsSPP, CsSPSs, SPS activity and soluble sugars in the 'Shuchazao' cultivar. (c-ii) Correlation analysis of CsSPP, CsSPSs, SPS activity and soluble sugars in the 'Baiye1' cultivar. Green color means negative correlation, purple color means positive correlation.
-
Gene Accession number ORF (bp) AA MW (KDa) pI Aliphatic index Loc SignalP TMHs CsSPP CSS0017072.1('SCZ')
GWHPASIV039206 ('TGY')
GWHPAZTZ037371 ('HD')
GWHPBAUV077964 ('HD'-HB)
GWHPASIX044577 ('TGY'-HA)
GWHPASIX046144 ('TGY'-HB)1,275 424 48.13
48.11
48.10
48.11
48.11
48.115.55
5.62
5.55
5.62
5.62
5.6281.37
82.29
82.29
82.29
82.29
82.29Cytoplasm NO NO CsSPS1 CSS0047114.1('SCZ') 2,988 995 111.15 5.65 86.04 Cytoplasm NO NO CsSPS2 CSS0020276.1 ('SCZ')
GWHPASIV037217 ('TGY')
GWHPAZTZ035335 ('HD')
GWHPBAUV071117 ('HD'-HA)
GWHPBAUV073449 ('HD'-HB)3,057
2,796
2,916
2,916
2,9161018
931
971
971
971113.16
103.18
107.81
107.81
107.835.71
5.76
5.76
5.76
5.7686.58
87.65
86.86
86.86
86.86CsSPS3 CSS0009603.1 ('SCZ')
GWHPASIV029409 ('TGY')
GWHPAZTZ027893 ('HD')
GWHPBAUV055399 ('HD'-HA)
GWHPBAUV058548 ('HD'-HB)
GWHPASIX032838 ('TGY'-HA)
GWHPASIX034616 ('TGY'-HB)3,111
3,120
2,916
3,192
3,120
3,120
3,1201036
1039
1039
1039
1039
1039
1039116.78
117.77
117.66
215.79
117.66
117.66
117.775.92
6.32
6.26
6.53
6.26
6.21
6.3290.52
88.59
88.21
94.36
88.21
88.59
88.59Cytoplasm NO NO CsSPS4 CSS0024623.1('SCZ')
GWHPAZTZ027407('HD')
GWHPASIV029106('TGY')
GWHPBAUV054918('HD'-HA)
GWHPBAUV058088 ('HD'-HB)3,192
2,916
3,864
3,237
3,1921063
1063
1287
1078
1063119.71
119.64
144.79
119.19
119.646.05
6.00
6.01
6.10
6.0083.57
83.47
86.83
83.40
83.47Cytoplasm NO NO ORF, Opening reading fame; AA, The numbers of amino acid residues; MW, Molecule weight; pI, Theoretical isoelectric point; Loc, Subcellular location; SignalP, Signal peptide; TMHs, Transmembrane helices. 'SCZ', 'TGY' and 'HD' mean 'Shuchazao', 'Tieguanyin', and 'Huangdan', respectively. 'HA' and 'HB' represent haplotype A and haplotype B genomes of 'Huangdan' and 'Tieguanyin' cultivars, respectively. Table 1.
Basic information of CsSPP and CsSPSs.
Figures
(7)
Tables
(1)