-
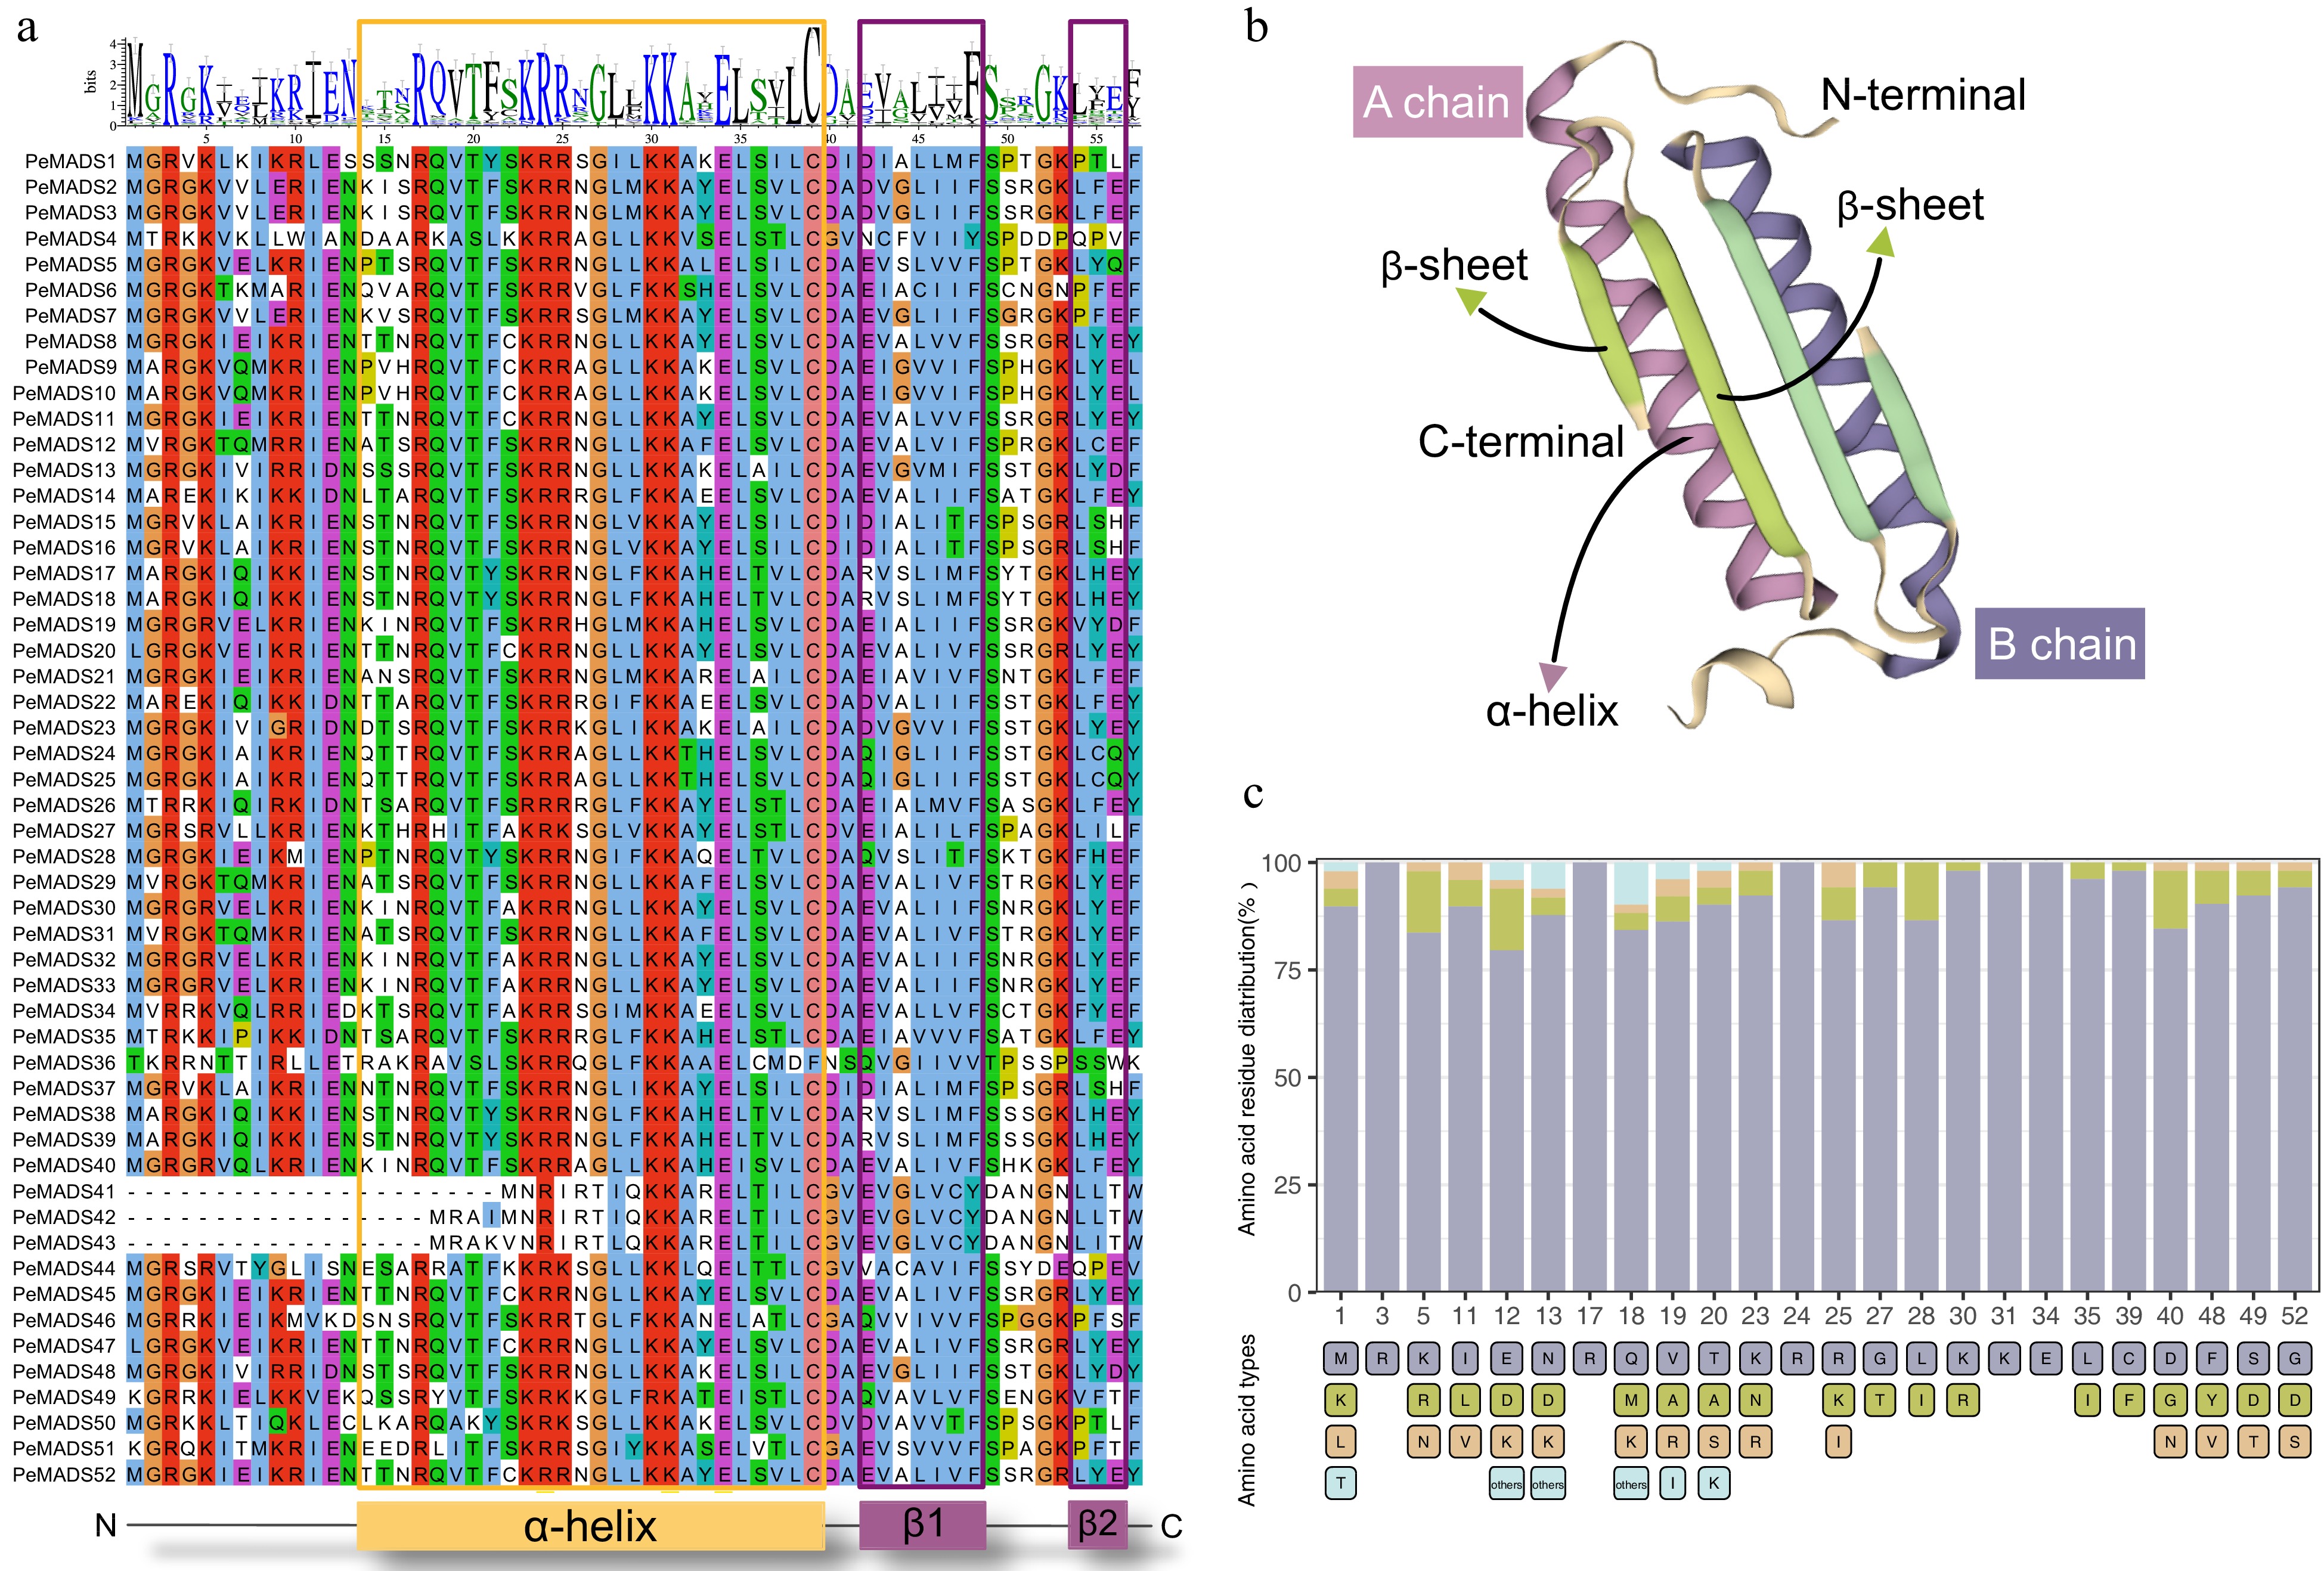
Figure 1.
Characterization of MADS-box domain. (a) Multiple sequence alignment of MADS-domain region from 52 PeMADS proteins. (b) Predicted three-dimensional structure of MADS-domain. (c) Distribution of amino acids in conserved residues of MADS-domain: number represents the positions of residues; bottom label represents species of amino acids.
-
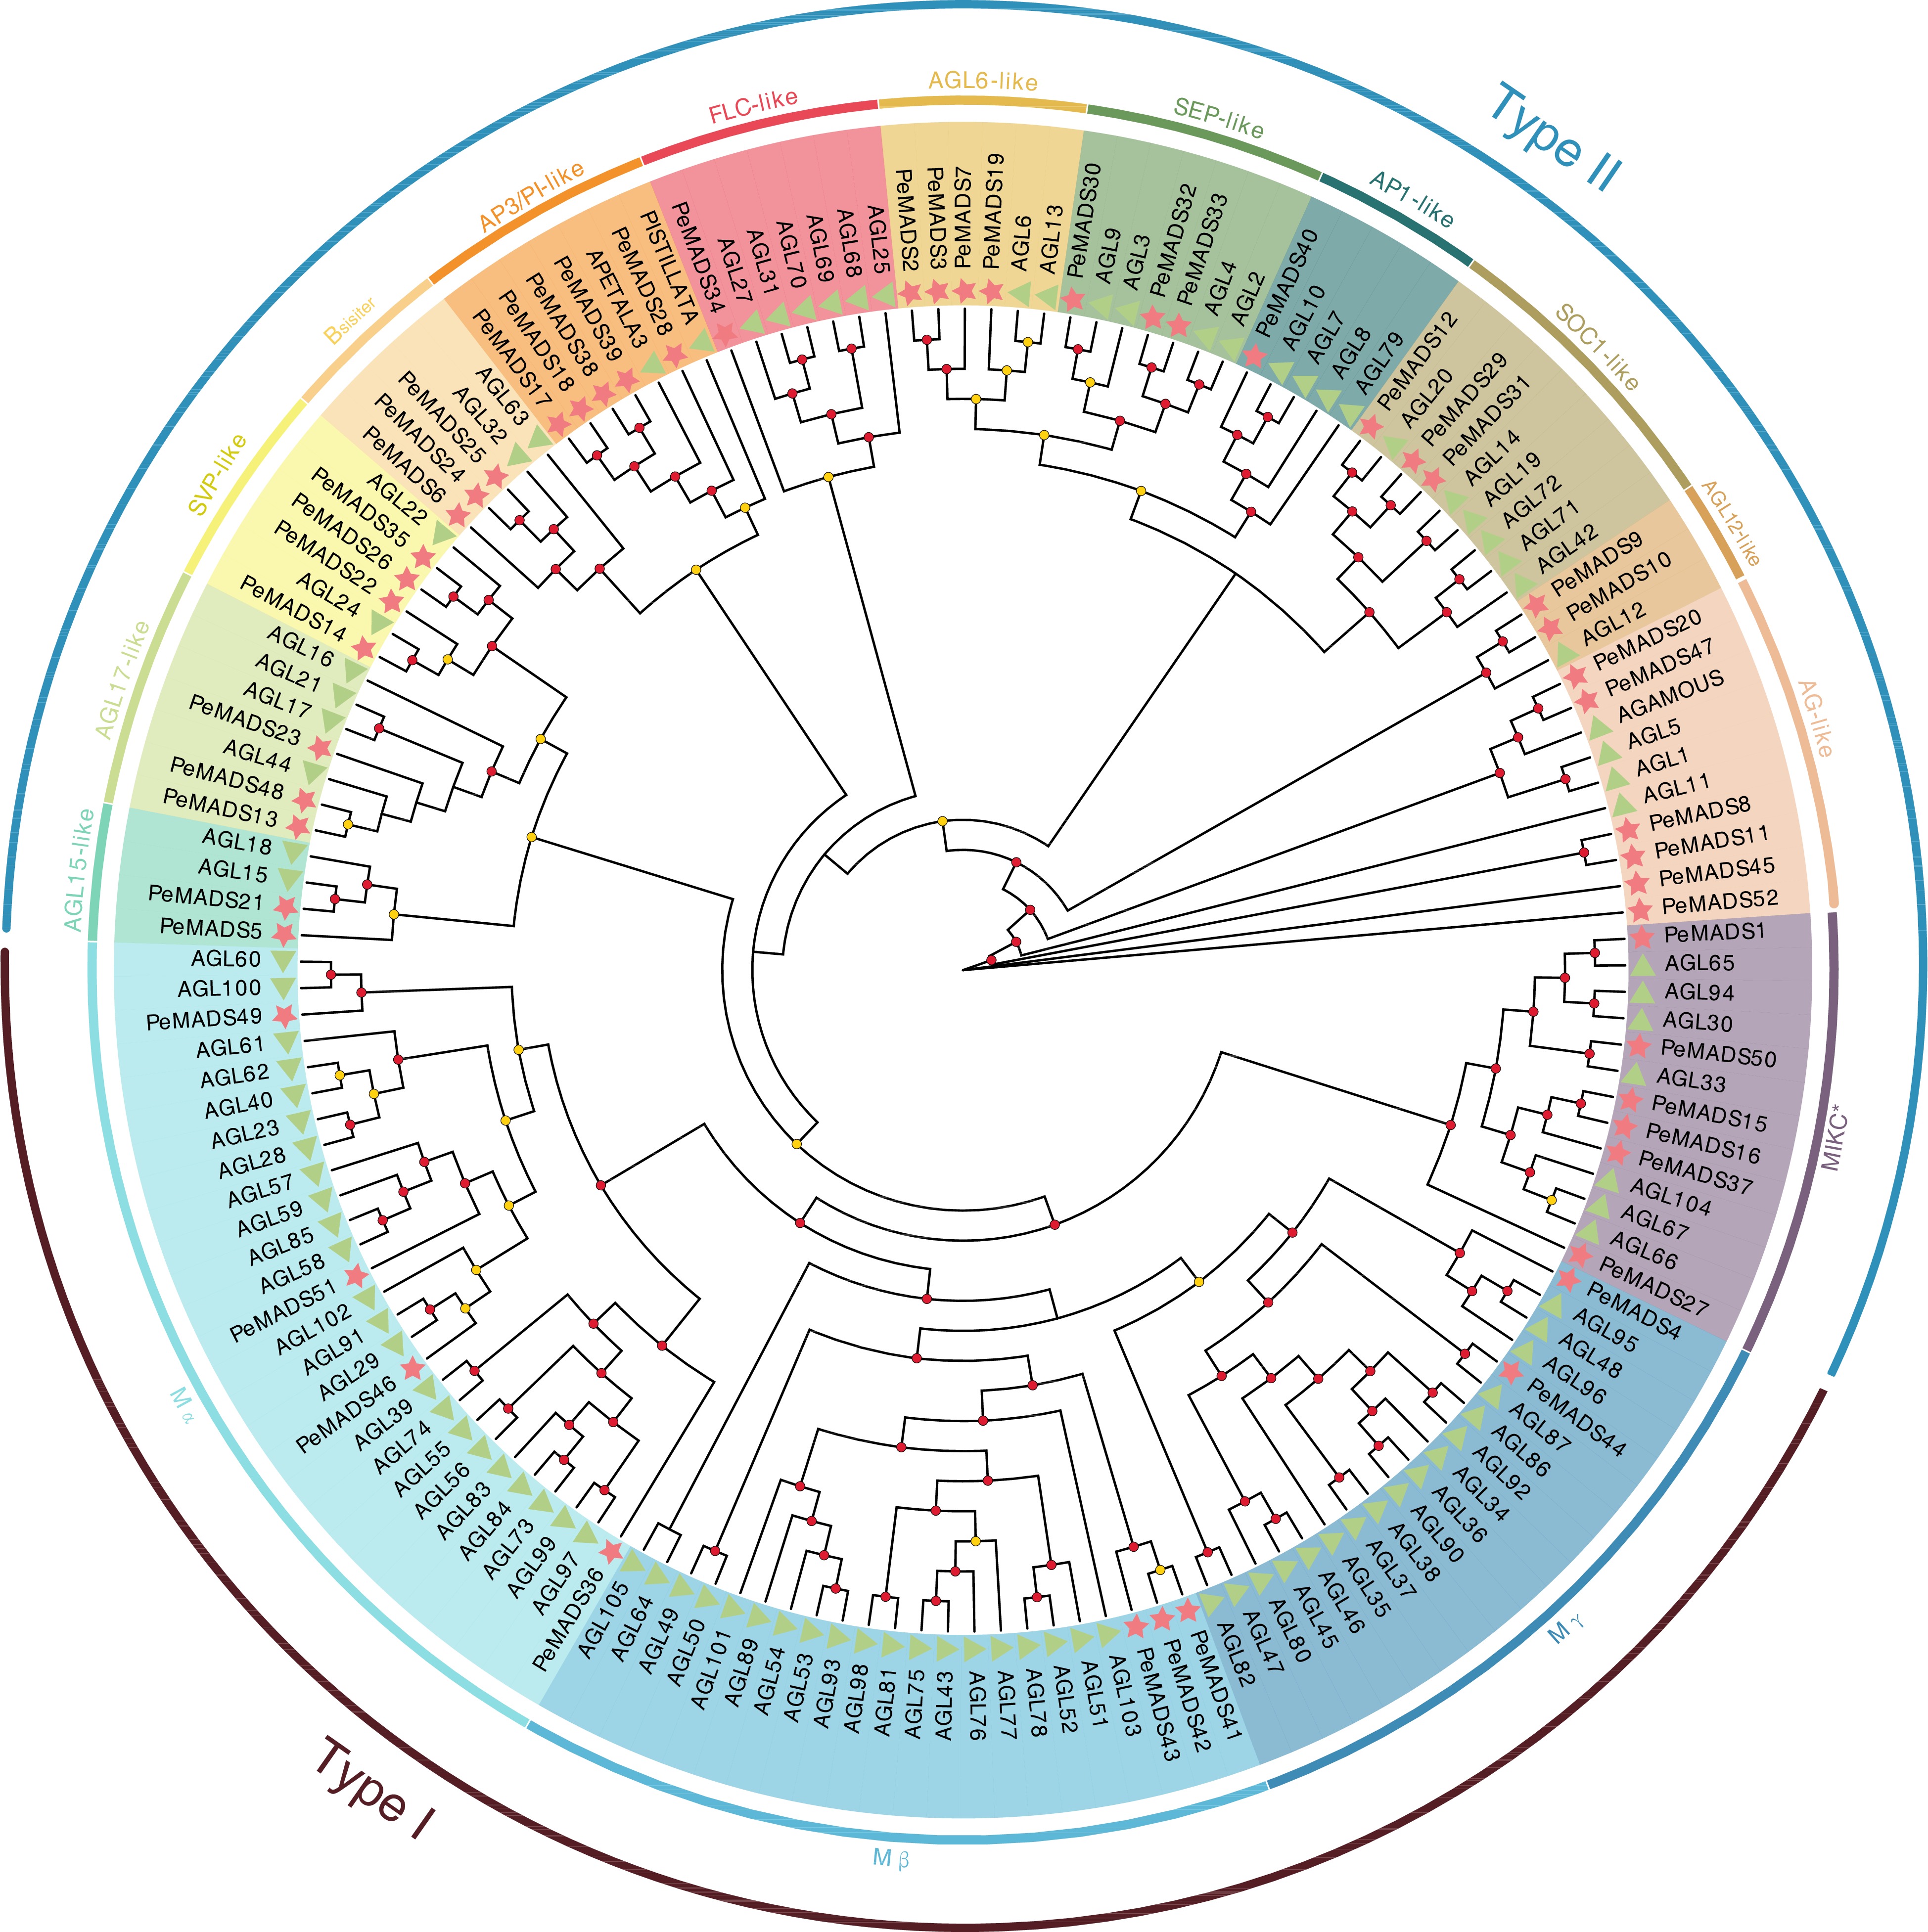
Figure 2.
Phylogenetic tree of PeMADS proteins from Passiflora edulis (Pe) and Arabidopsis thaliana (At). Red starts and green triangles indicate passion fruit and Arabidopsis, respectively. The circle placed on the tree indicated the bootstrap value (≥ 90, red circle; 60~90, yellow circle; < 60, not shown).
-
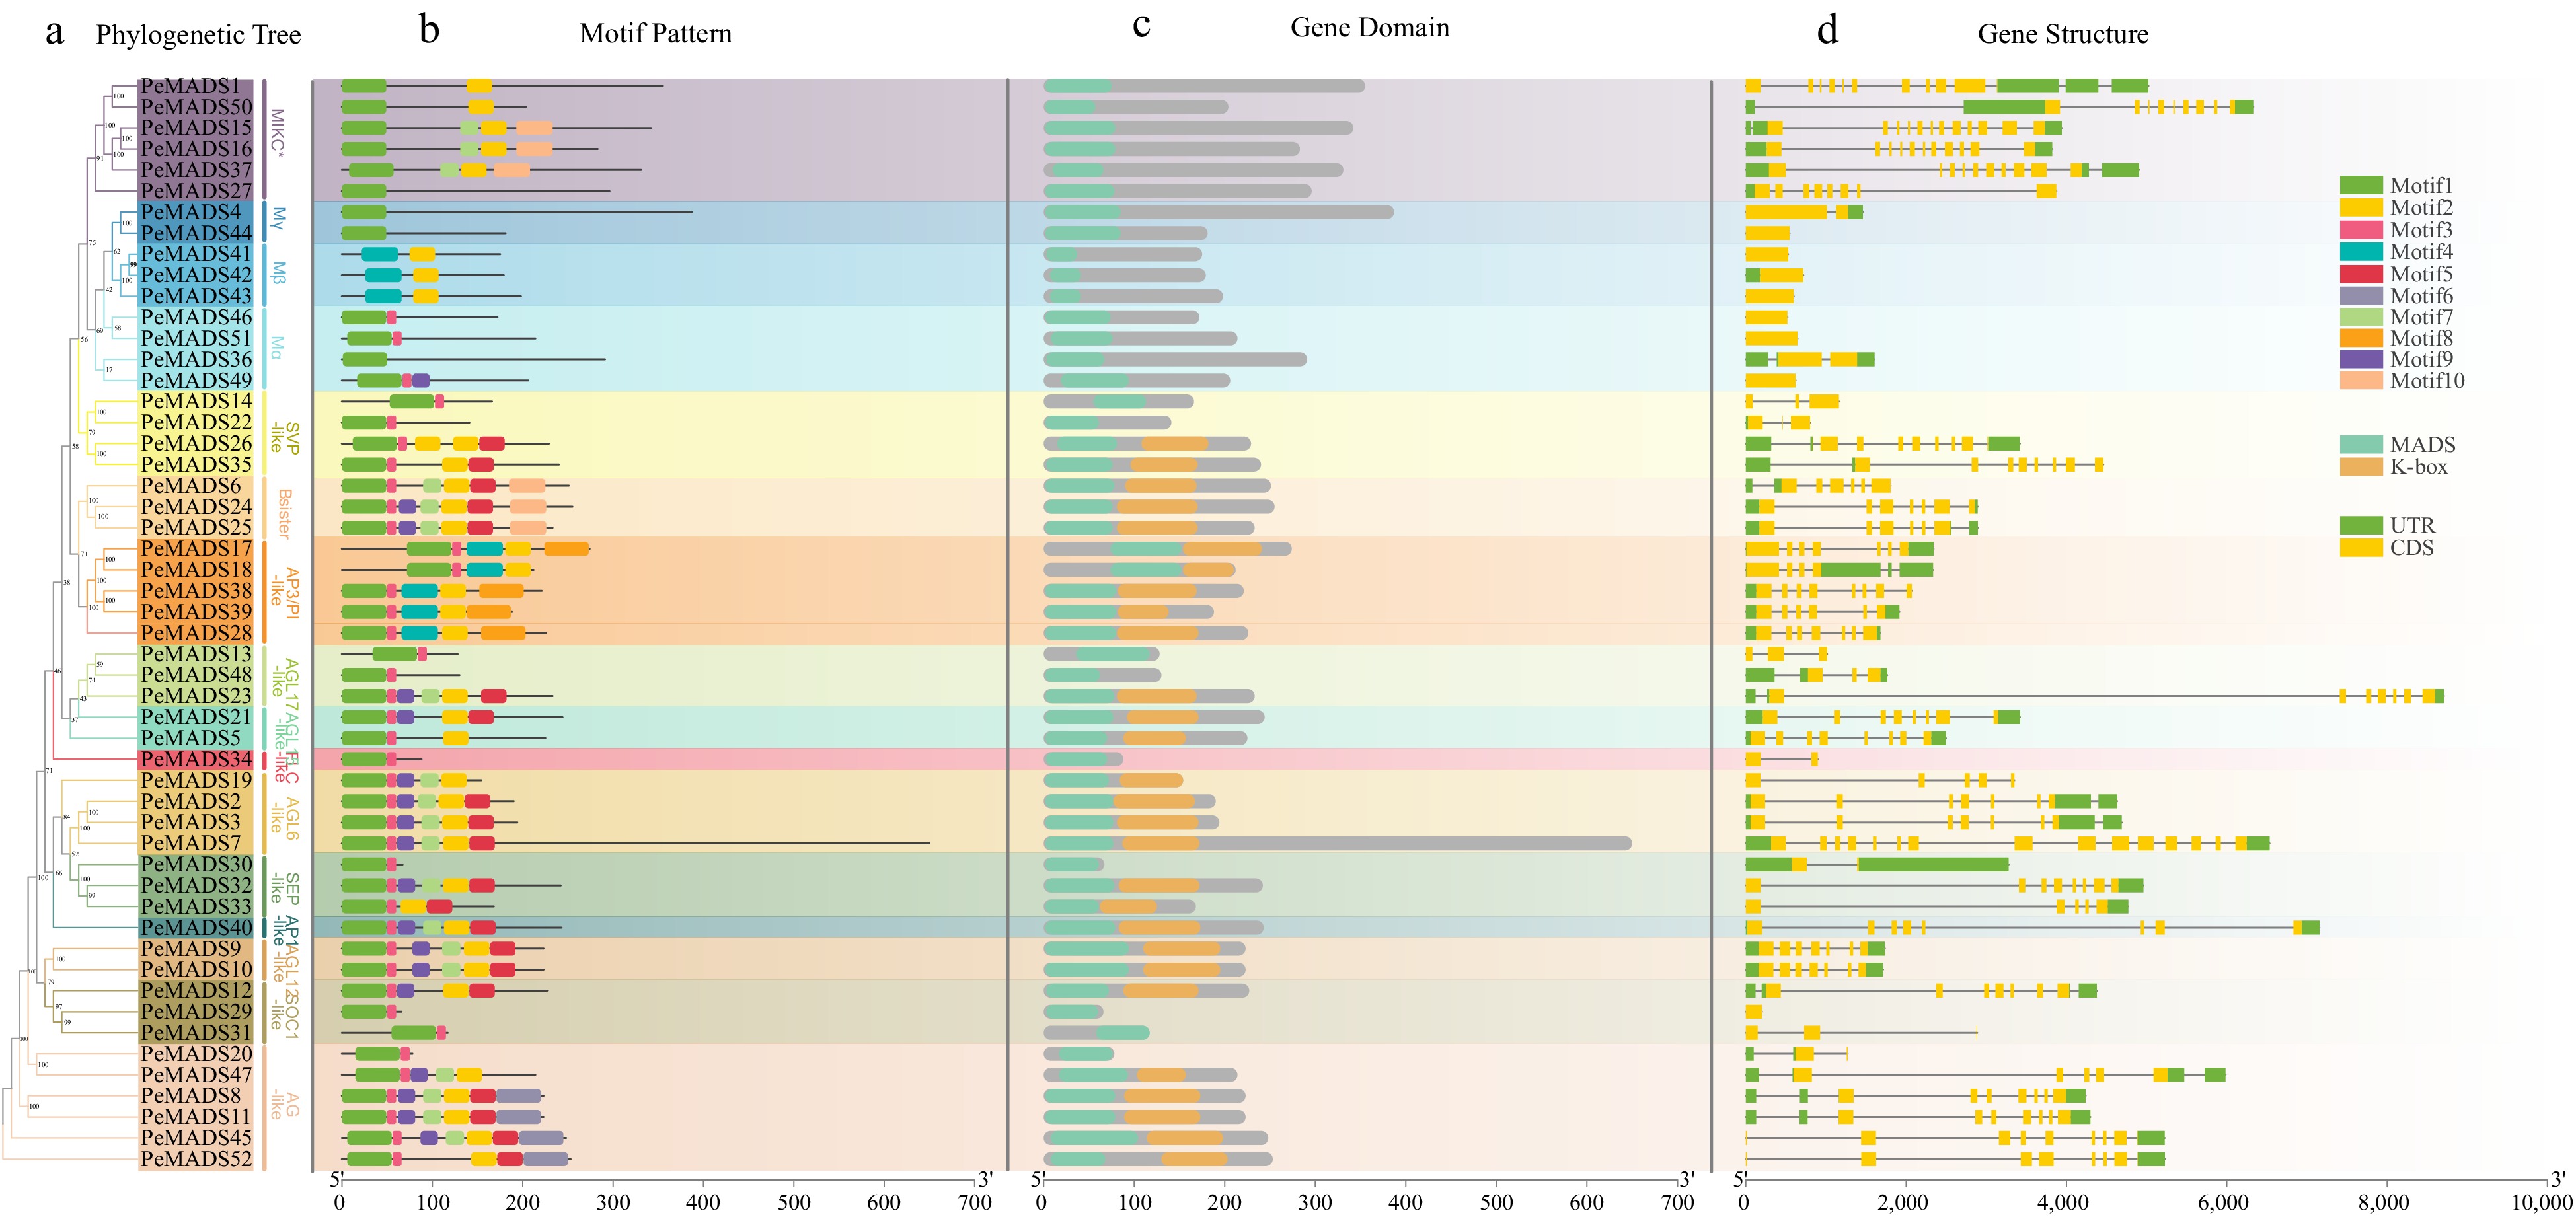
Figure 3.
The phylogenetic relationship, conserved motifs and gene structures of PeMADSs. (a) The phylogenetic tree of 52 PeMADS proteins. (b) Distribution of conserved motifs in PeMADS proteins. (c) Distribution of MADS-domain and K-domain of PeMADS proteins.(d) The gene structures of the PeMADSs, include coding sequences (CDS) and untranslated regions (UTR).
-
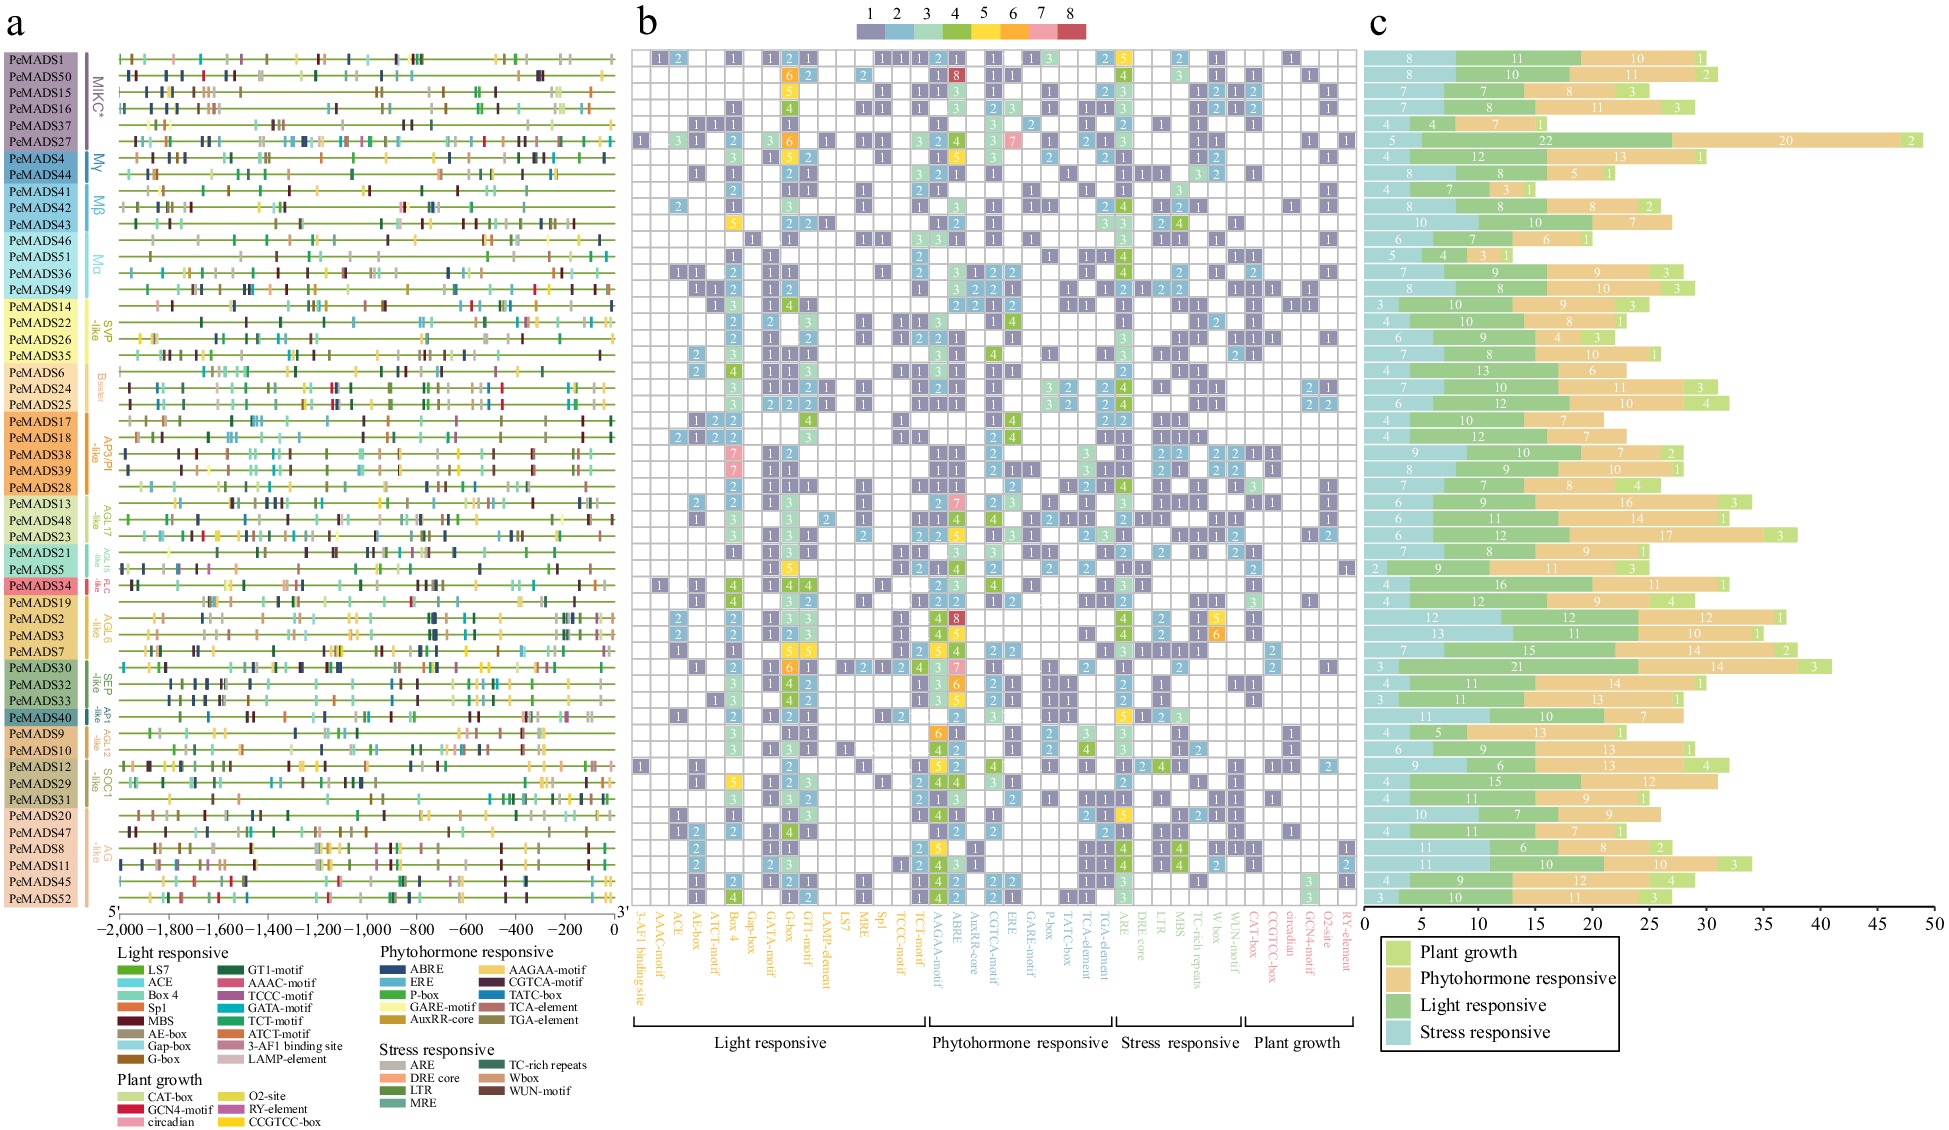
Figure 4.
(a) Analysis of cis-elements in the promoter region of PeMADS genes. (b) Heatmap of the number of cis-elements, the different color represents the number of cis-elements. (c) The sum of cis-elements in categories shown as a histogram.
-

Figure 5.
Distribution and collinearity of PeMADS genes in the passion fruit genome. PeMADSs marked by red has synteny with other genes. Gray lines indicate synteny blocks in passion fruit genome, brown lines indicate segmental duplicated MADS gene pairs of passion fruit.
-
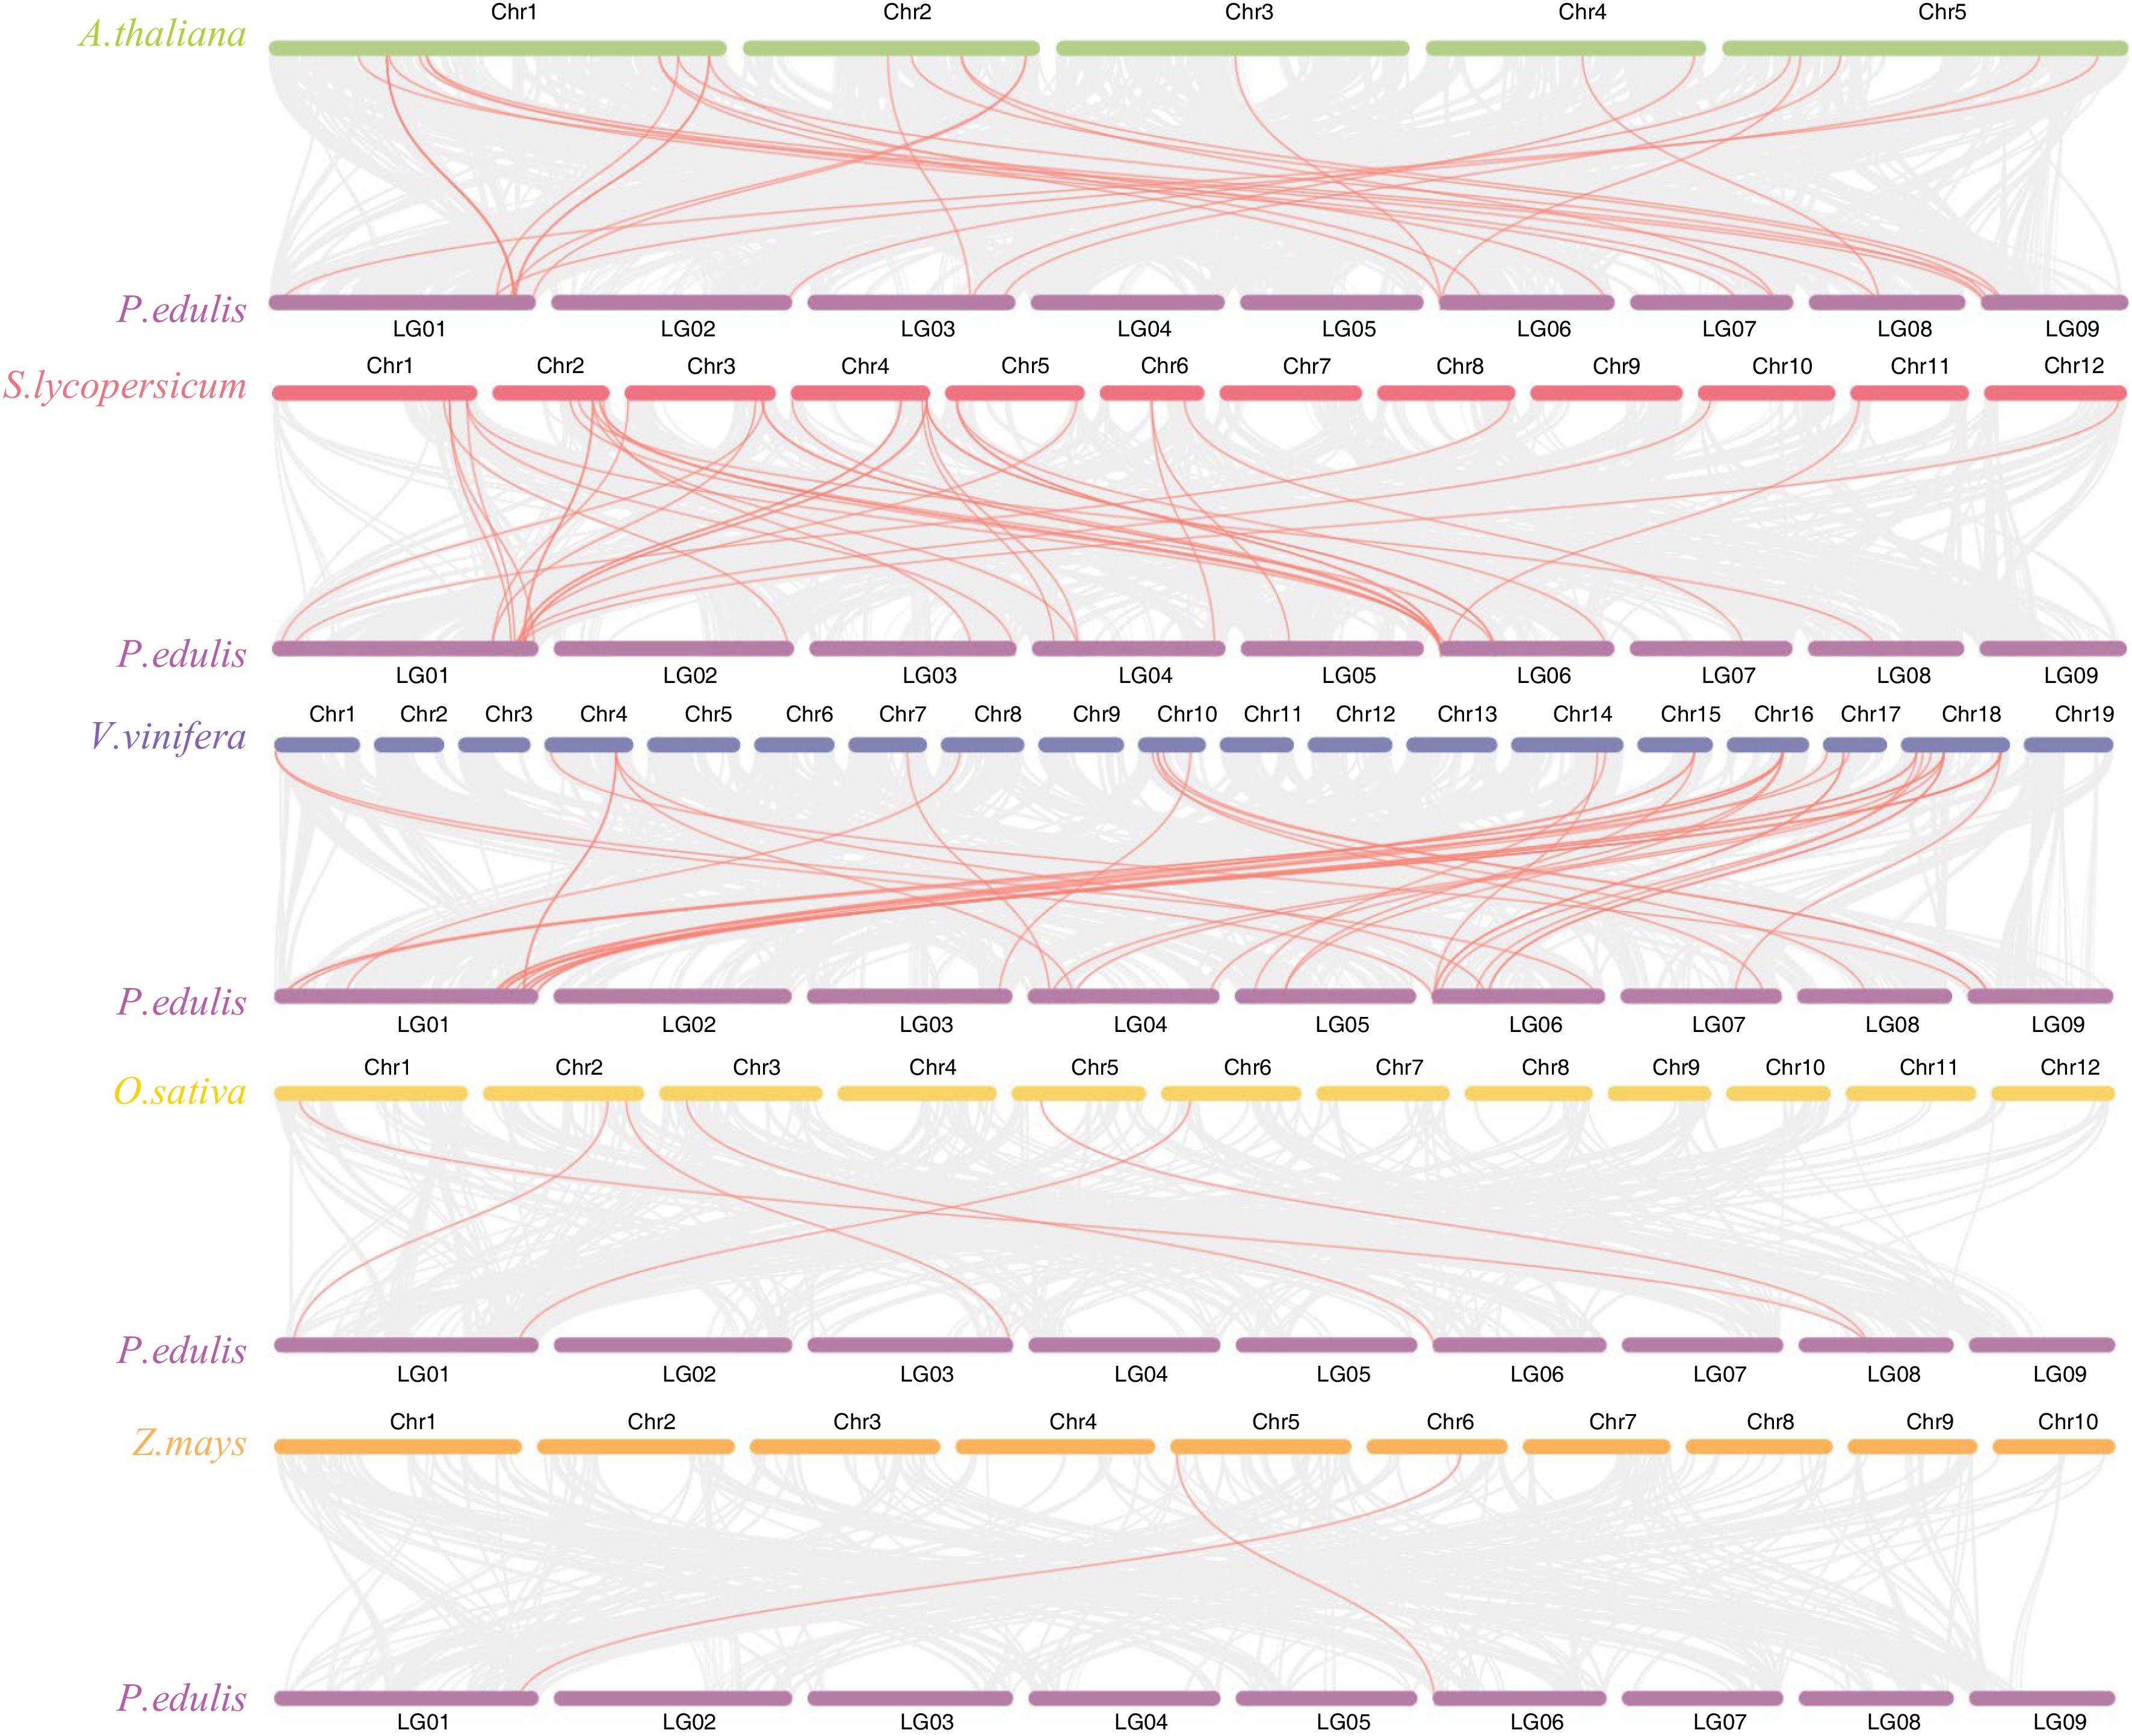
Figure 6.
Synteny analysis of PeMADS genes and five representative plants species. Gray lines in the background indicate the collinear blocks between passion fruit and other plant genomes, while red lines highlight the systemic gene pairs of PeMADSs between passion fruit and other plant genomes.
-
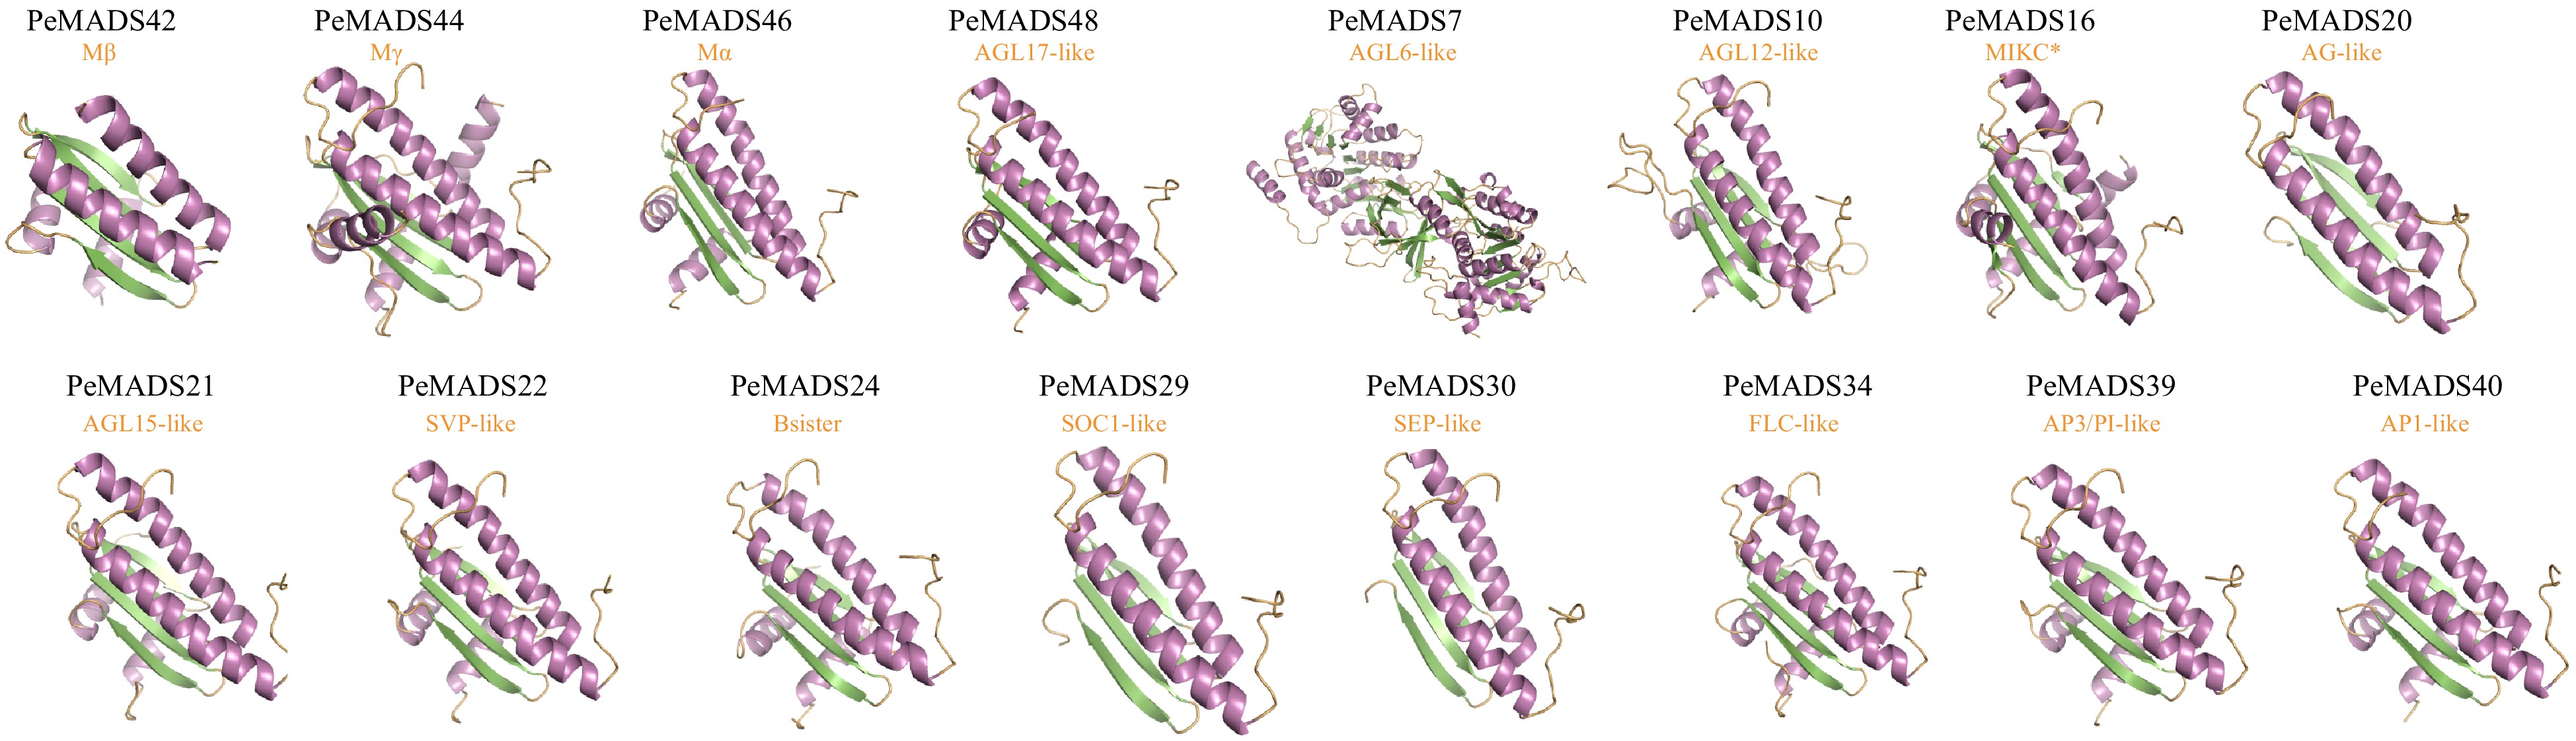
Figure 7.
Predicted three-dimensional structures of the passion fruit MADS-box protein sequences.
-
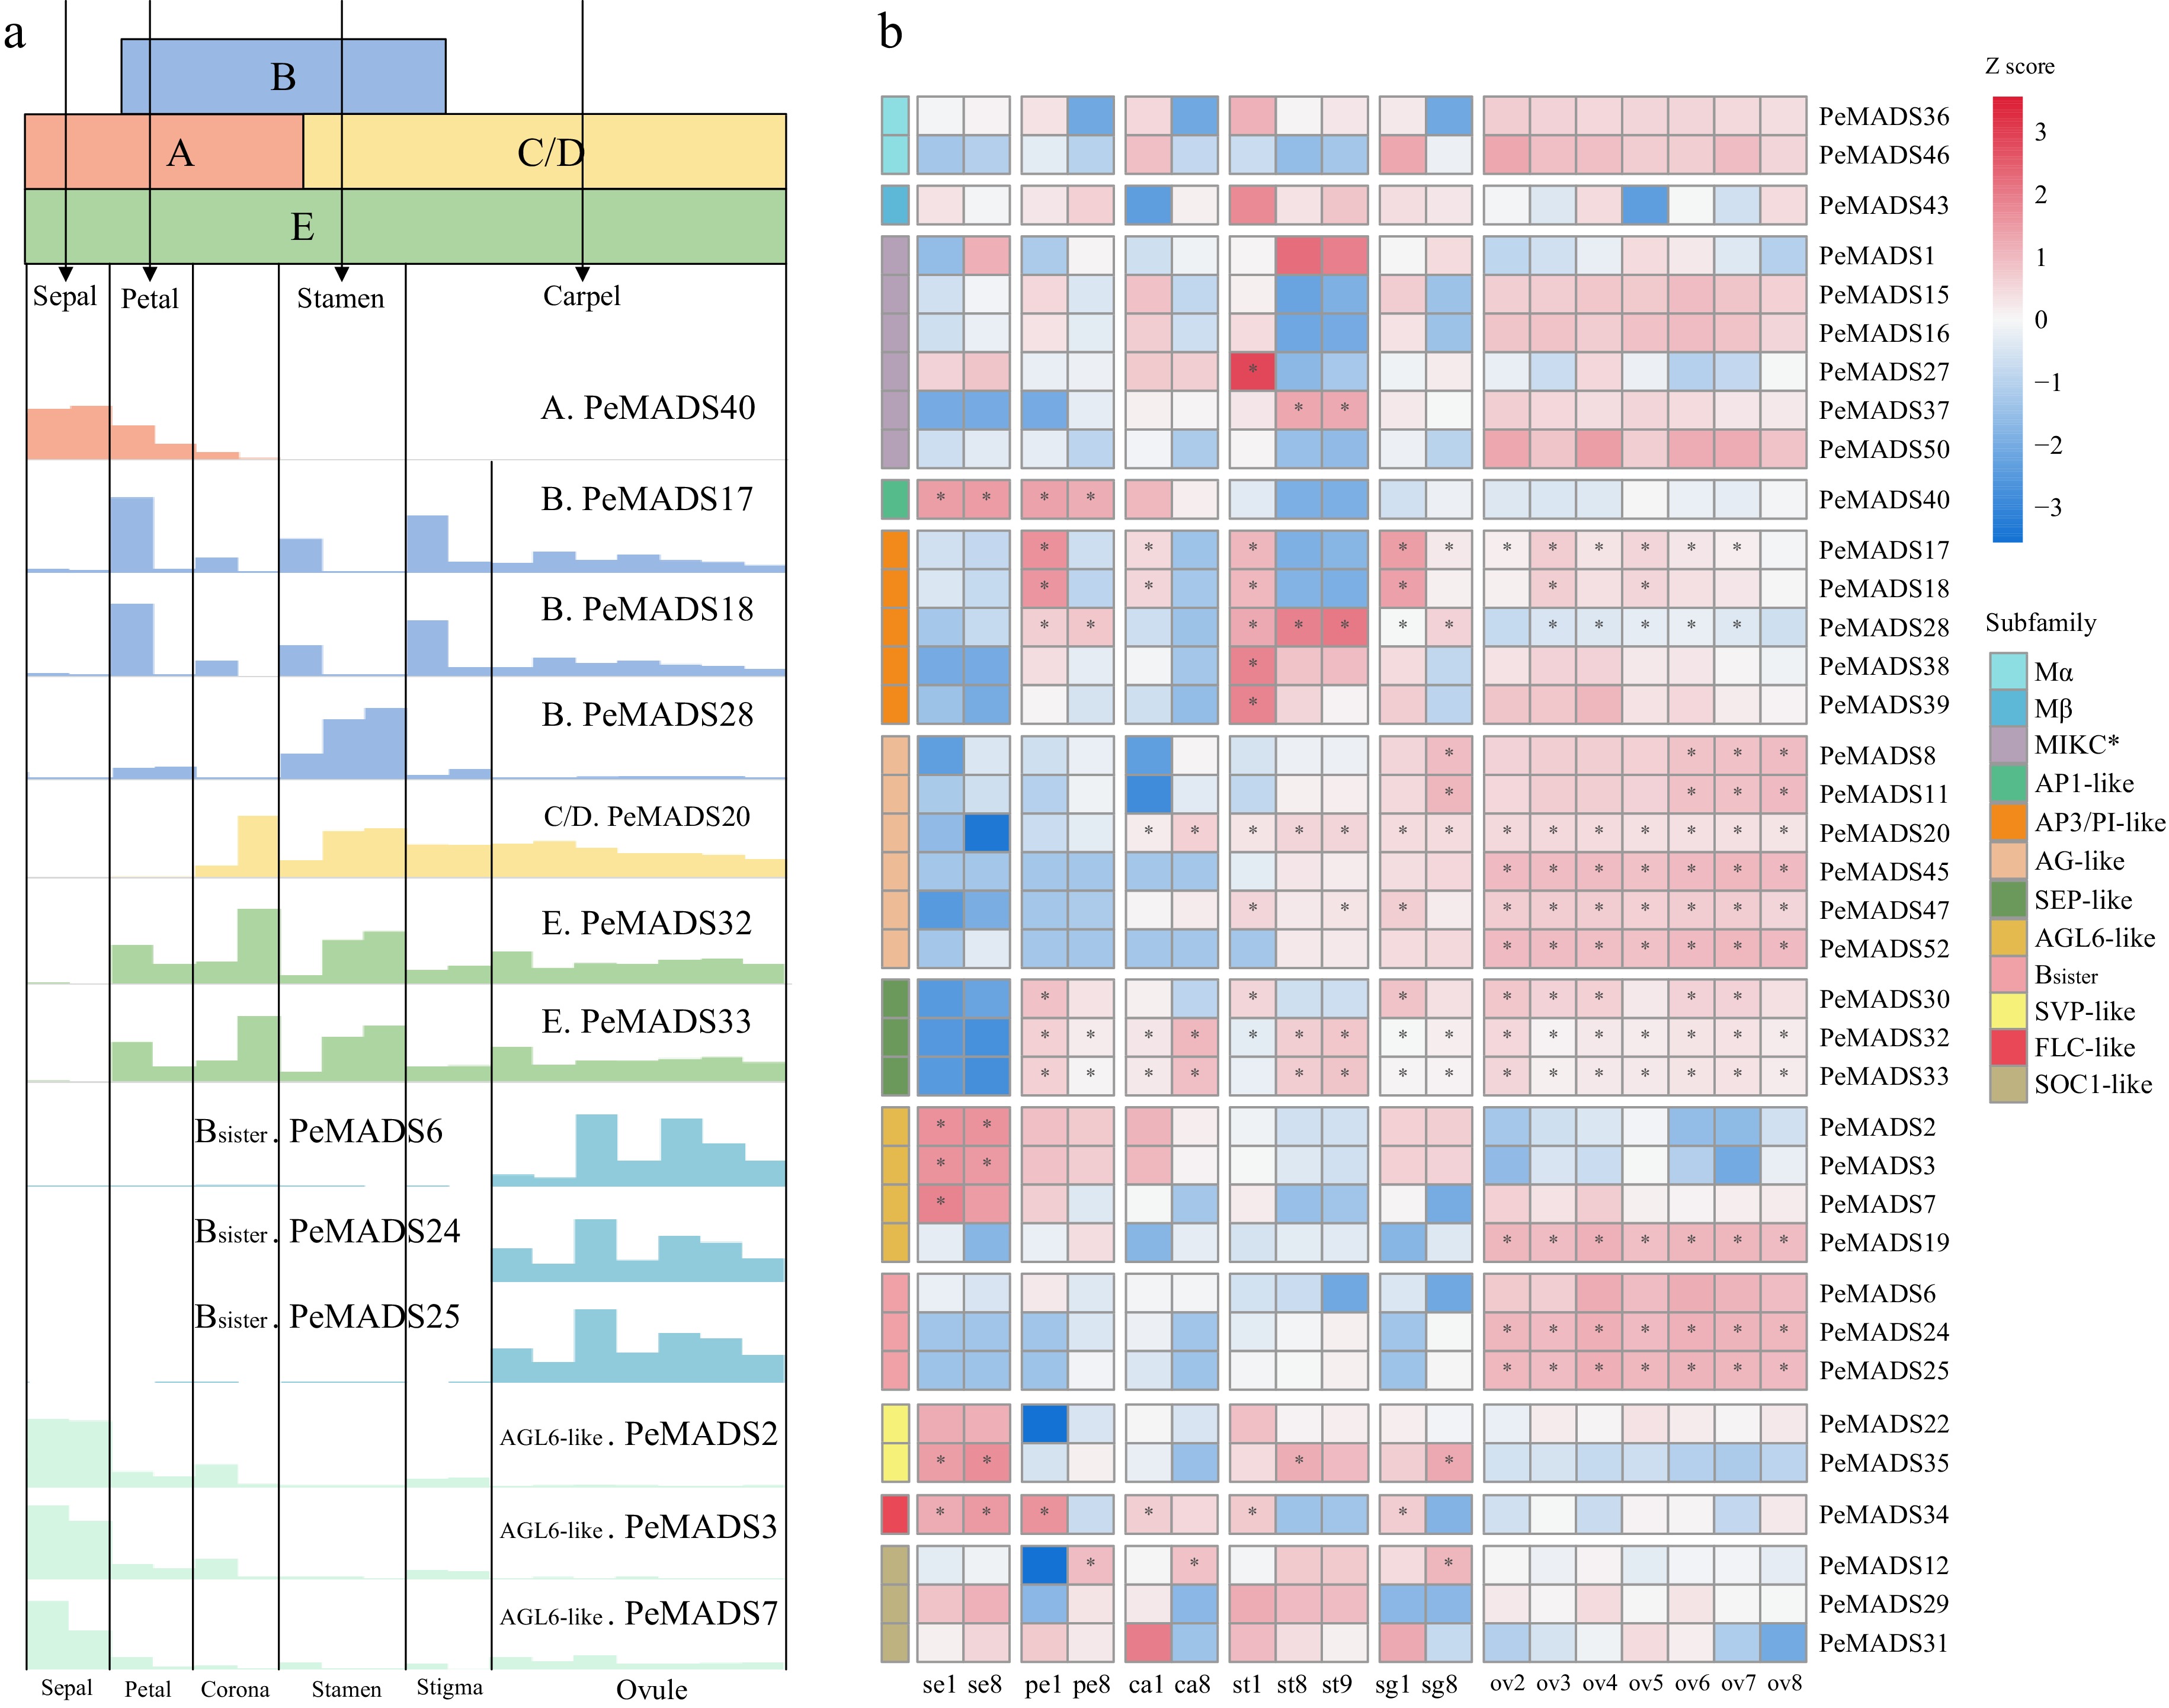
Figure 8.
The expression profile of MADS-box genes in floral tissues. (a) The ABC(D)E model in Eudicots, the bottom illustration indicates the gene expression values (bar heights) of ABC(D)E members in passion fruit. (b) Gene expression patterns of MADS-box gene family from floral tissues of passion fruit.
-
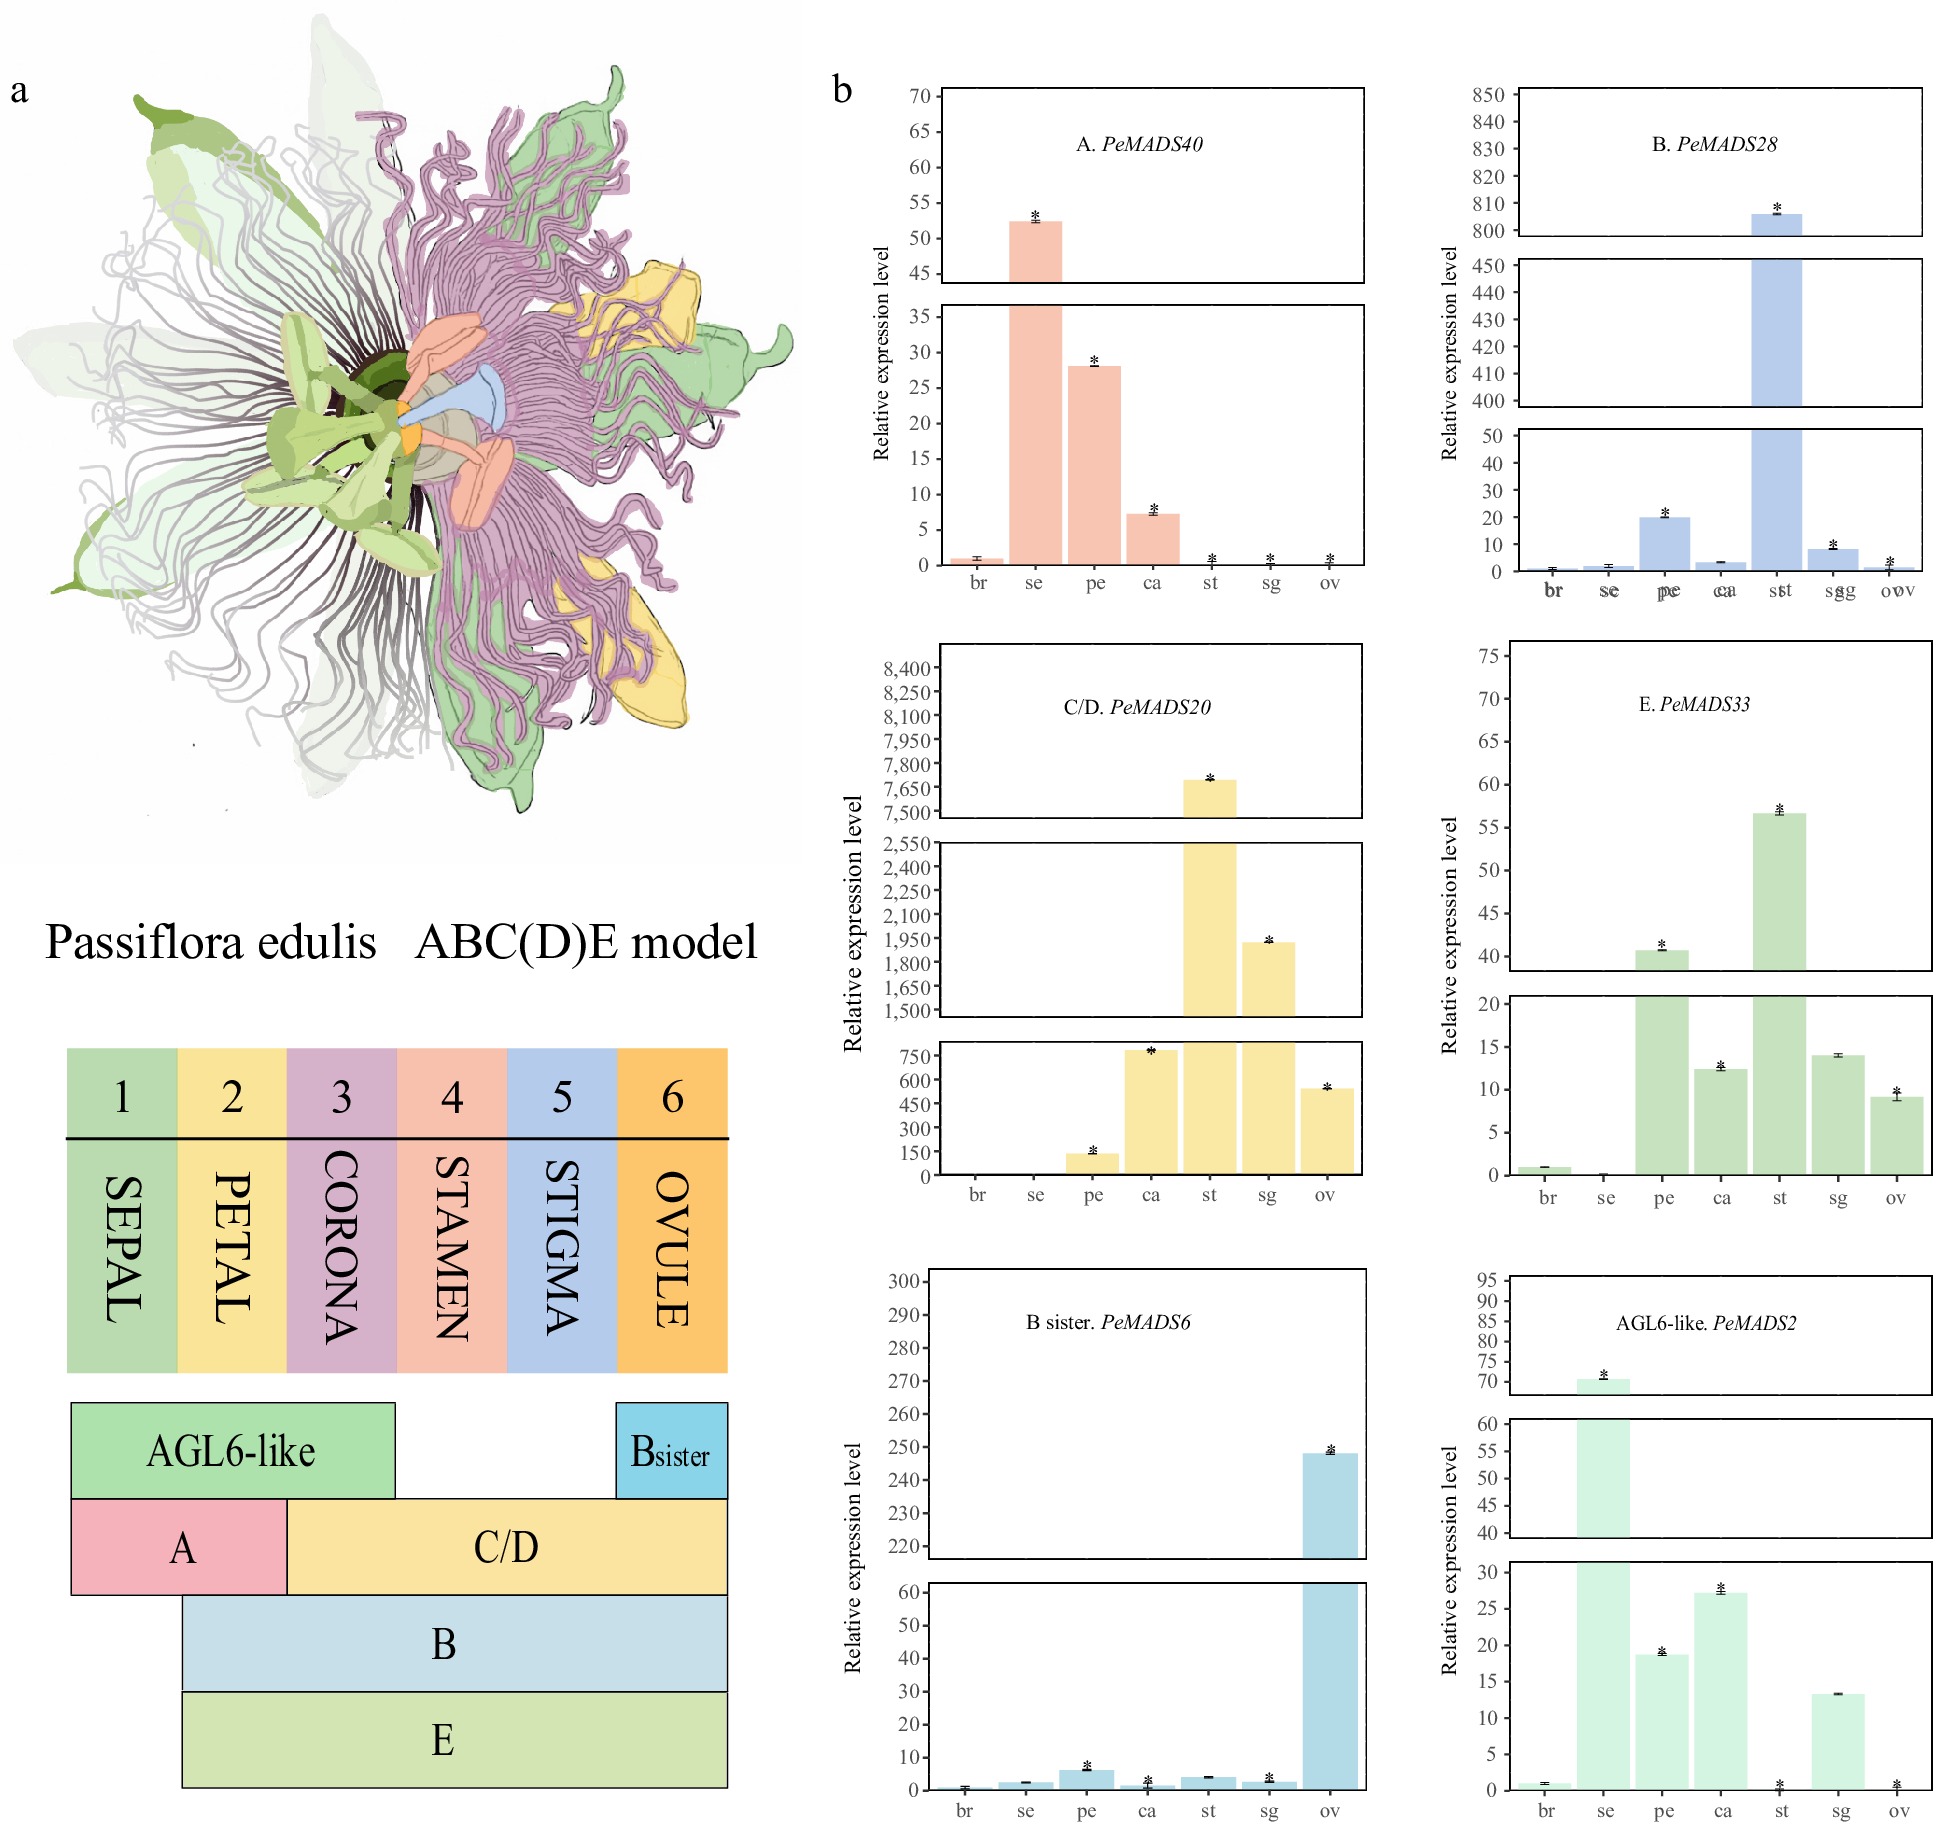
Figure 9.
qRT-PCR analysis of part members from the ABC(D)E model. (a) Illustration of passion fruit floral structure and summarization of the ABC(D)E model in passion fruit. (b) qRT-PCR results of six representative members from the ABC(D)E model, all experiments were performed independently at least three times. Error bars represent the standard deviation. Asterisks indicate significant differences in transcript levels compared with the early development stage of bract (br1). (* p < 0.05).
-
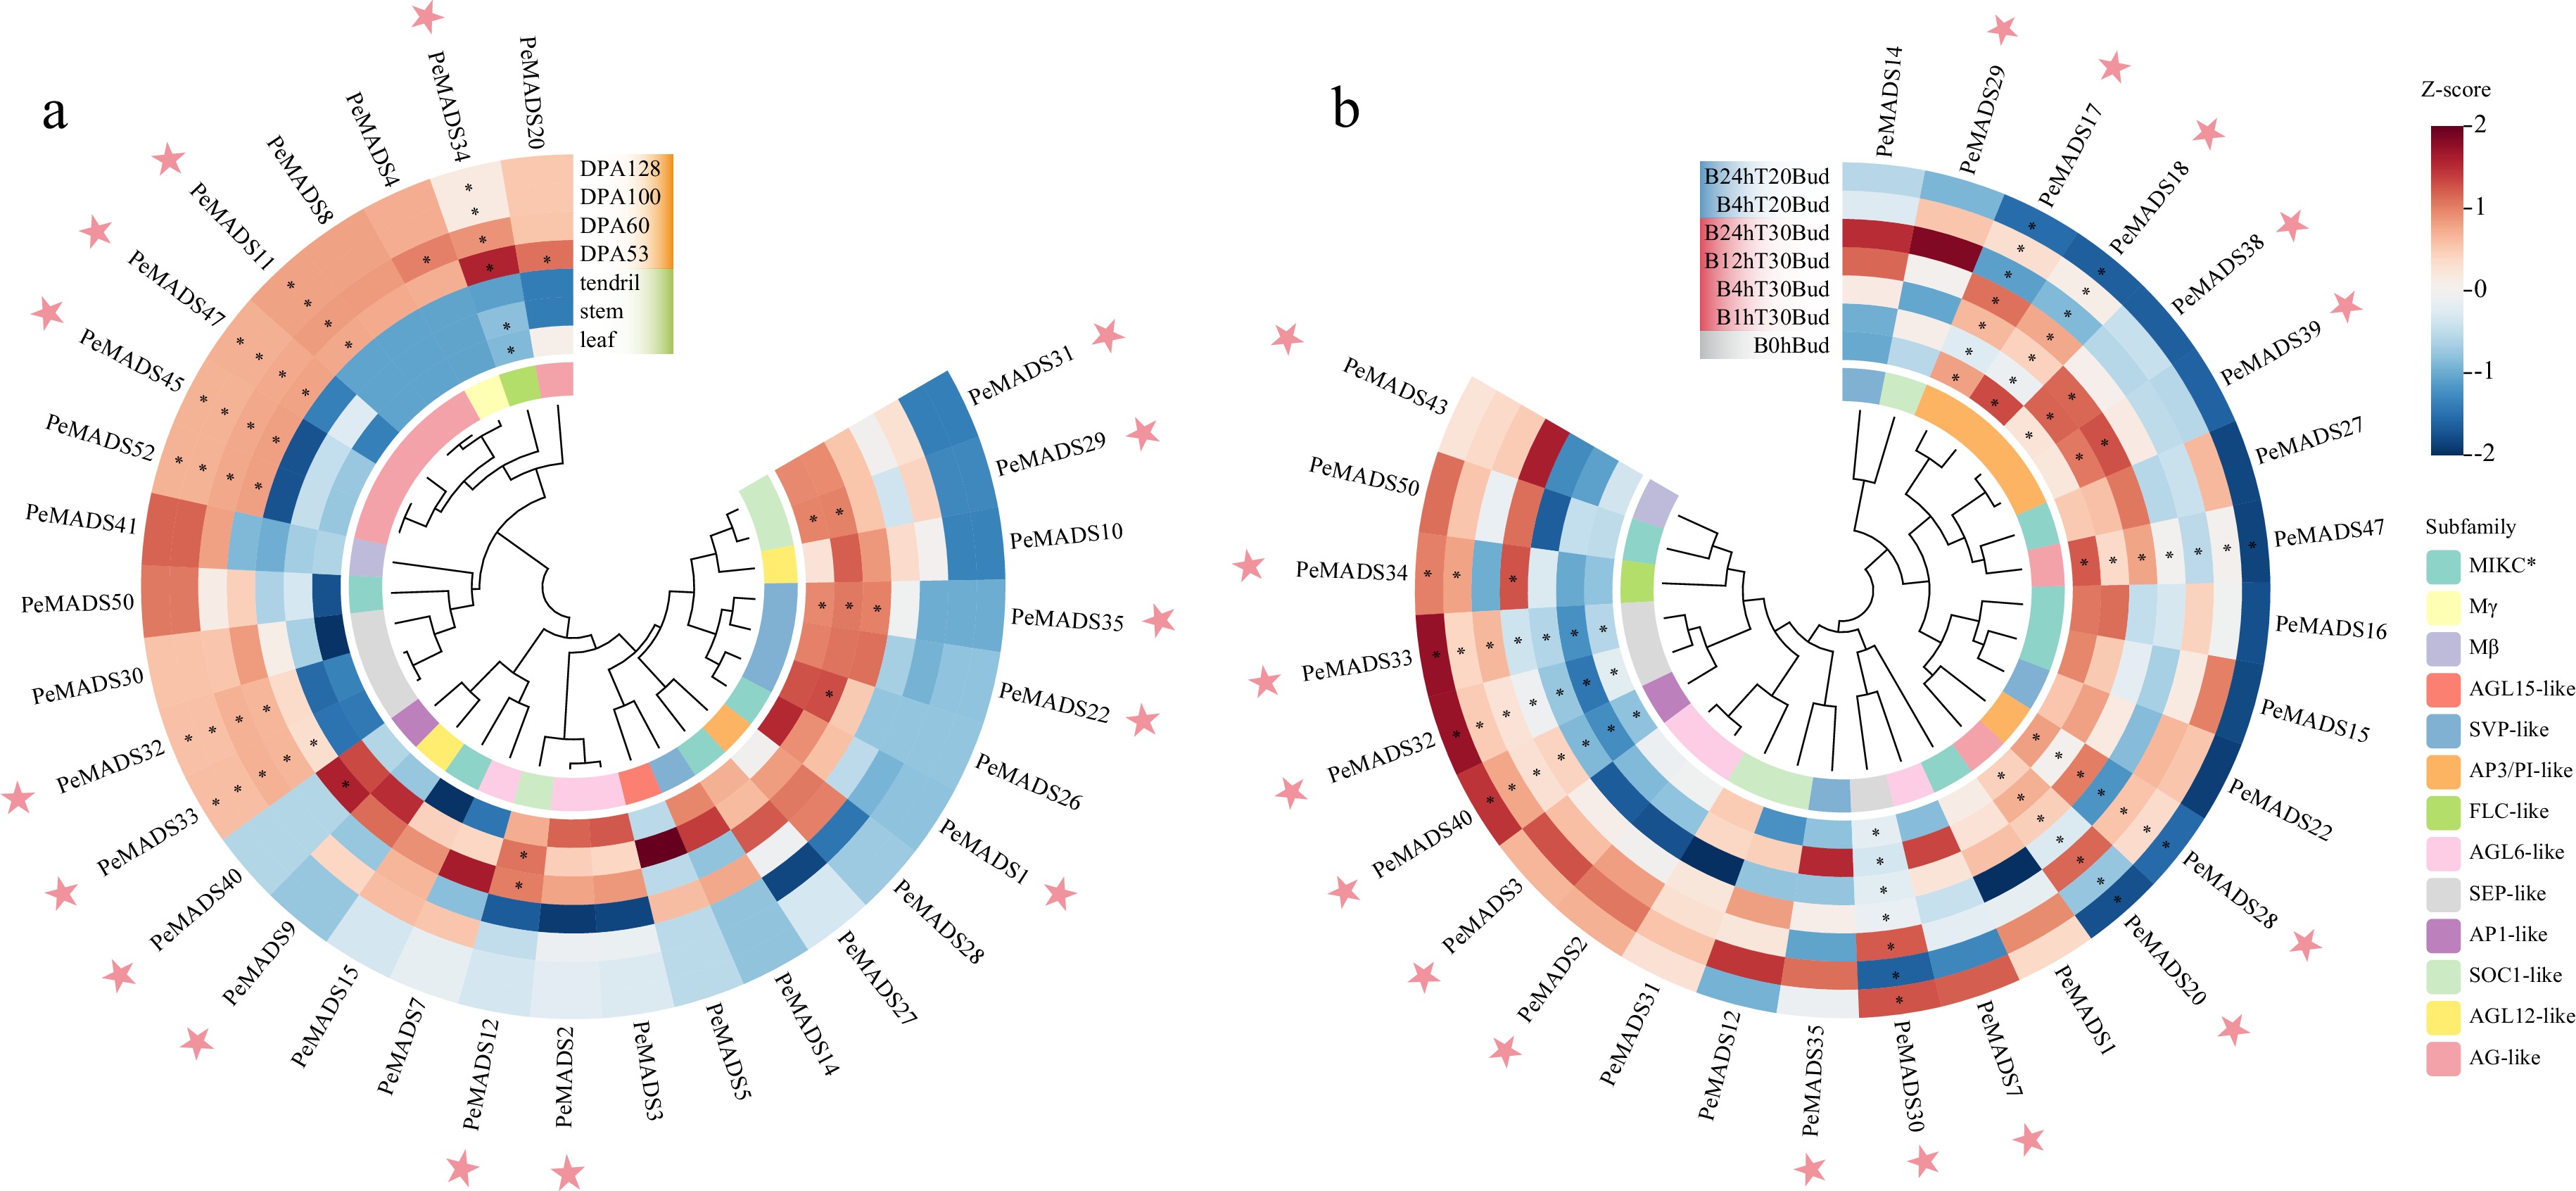
Figure 10.
Expression profiles of PeMADS genes in (a) non-floral organs and (b) under temperature stresses, DPA indicates days post anthesis; '1, 4, 12, 24 h' represents the time of stress treatment. Temperature of 20 °C (T20) is regarded as cold stress, while a temperature of 30 °C is regarded as heat stress (T30). The pink stars highlight the members with specific expression characteristics during fruit development or under temperature treatment.
-
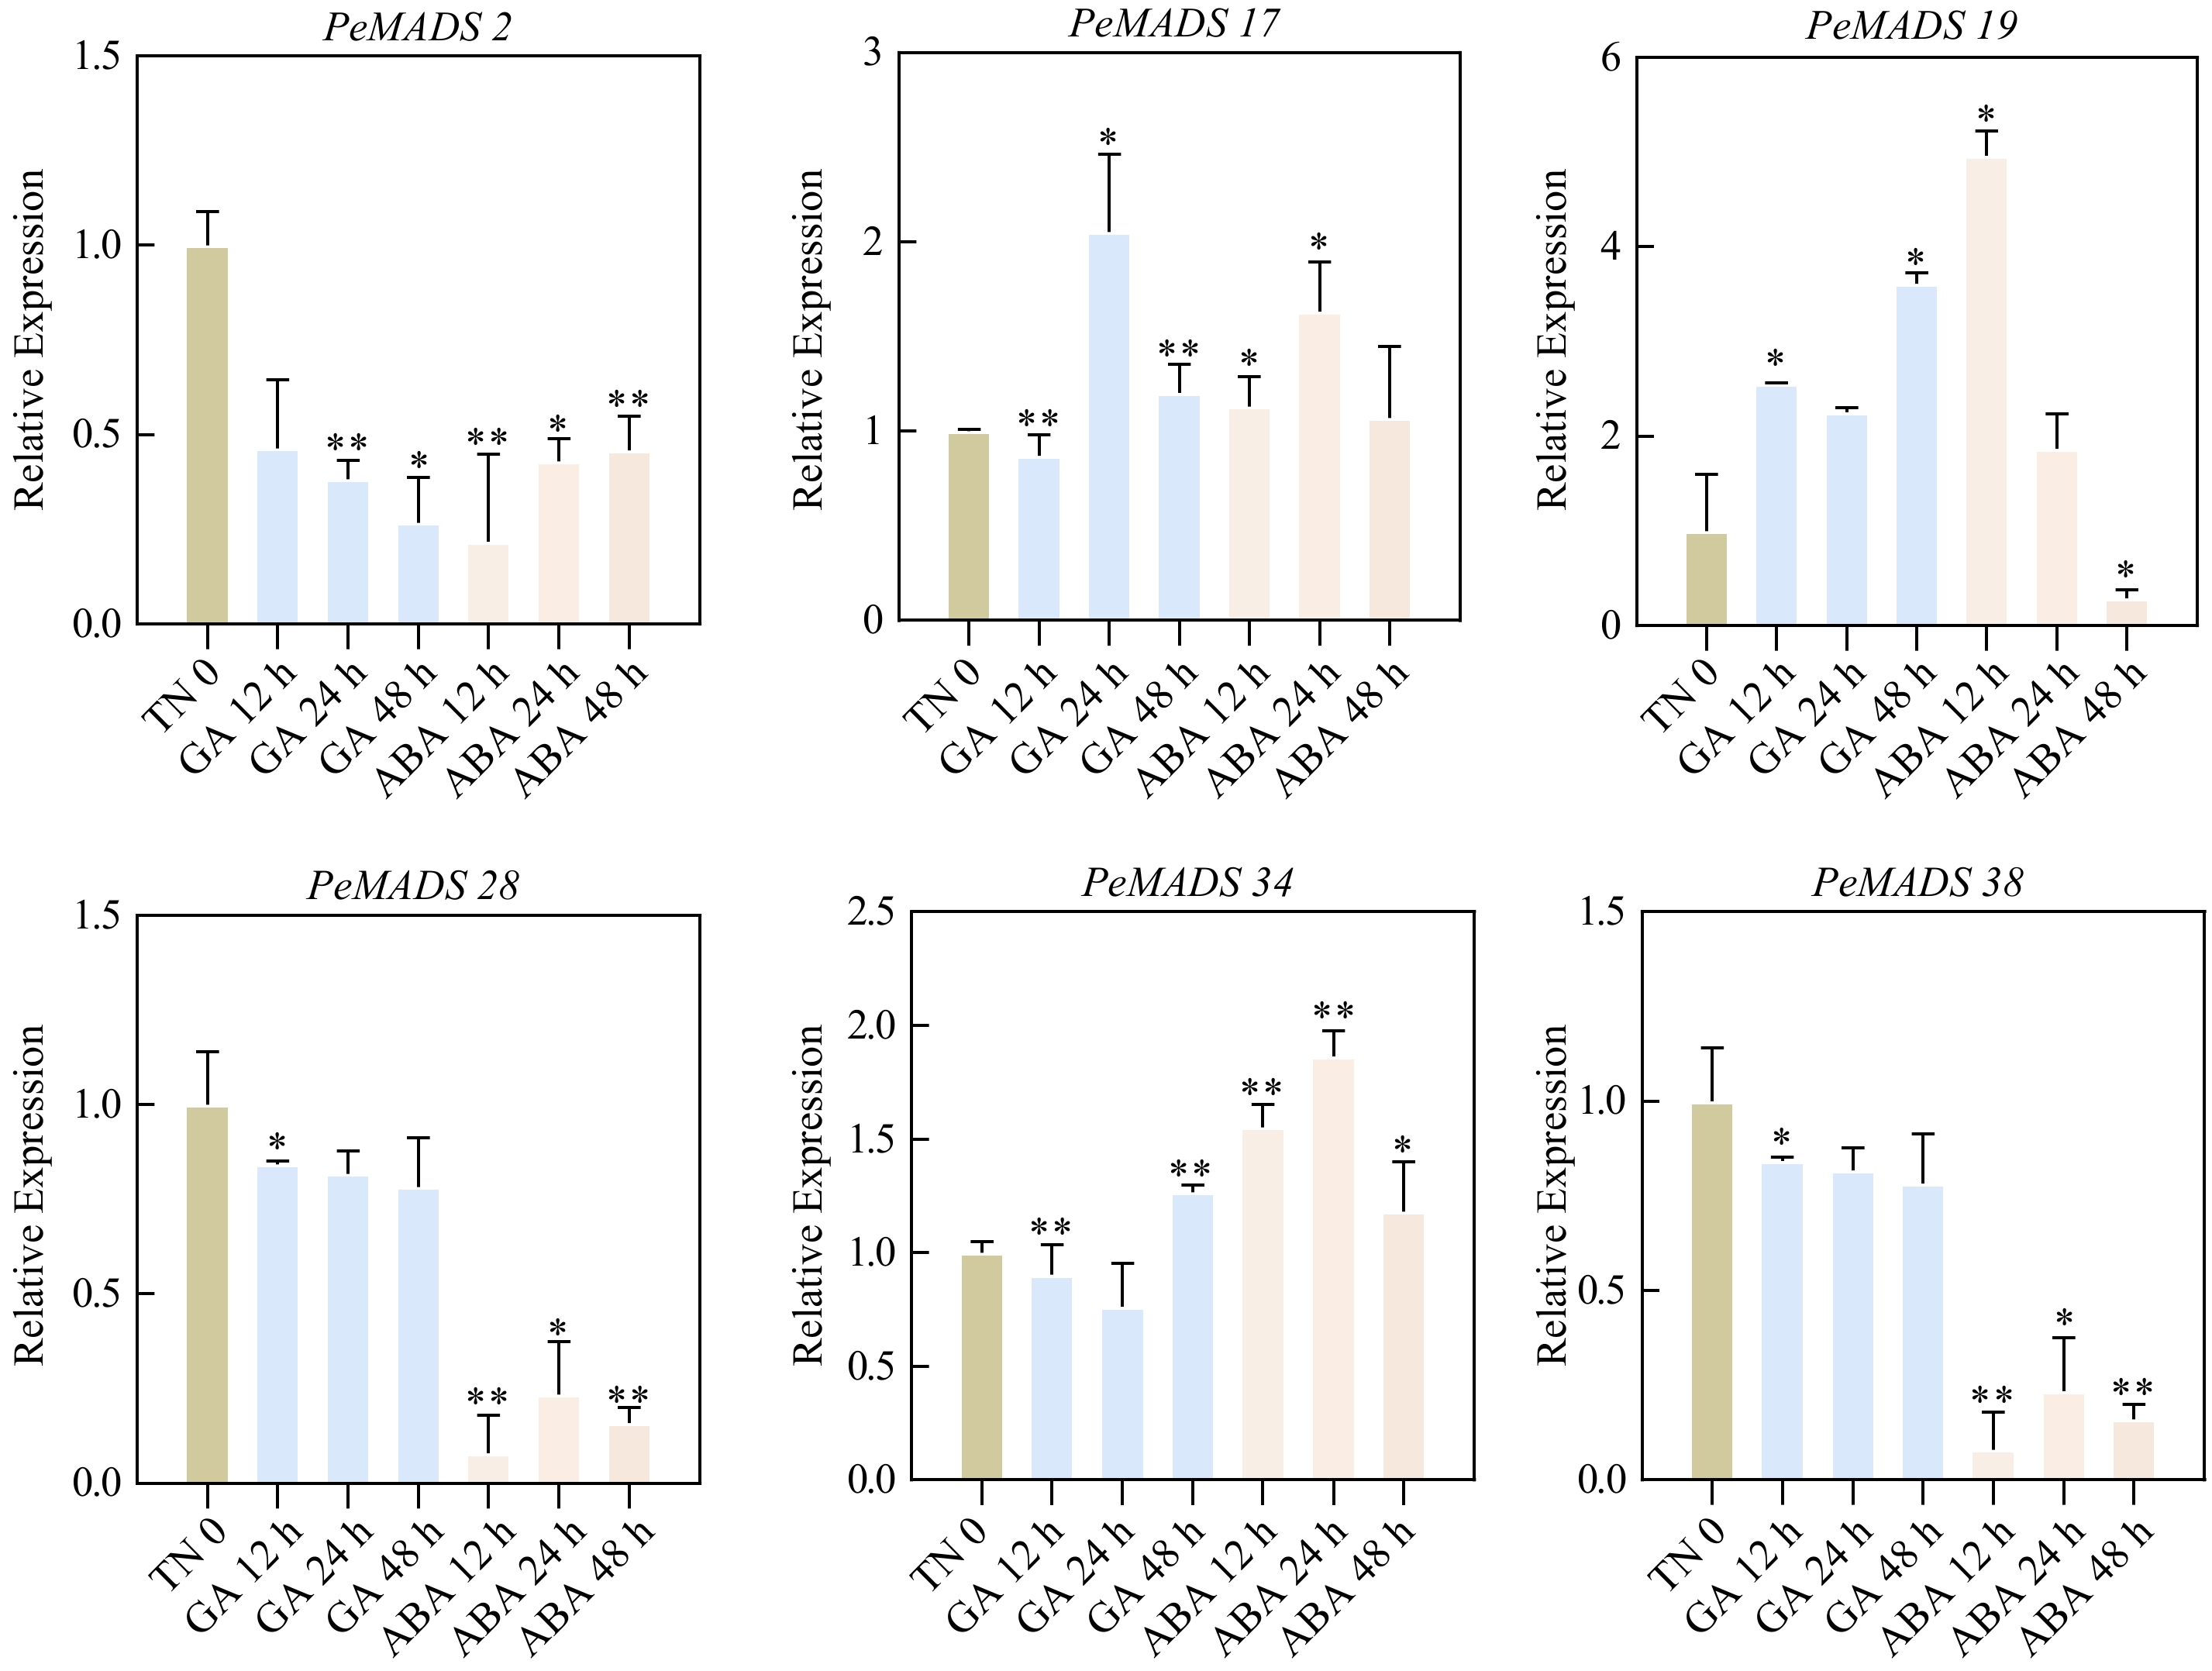
Figure 11.
Expression patterns of PeMADS genes in response to phytohormones. Leaf samples were collected at 0, 12, 24 and 48 h after GA and ABA treatments. Significant differences were analyzed by the Student's t-test (* p-value < 0.05, ** p-value < 0.01, *** p-value < 0.001, and **** p-value < 0.0001).
-
Gene name Gene ID Chromosome Size (aa) MW (Da) PI Instability
IndexA.I. GRAVY Predicted Location PeMADS1 P_edulia010000232.g LG01 355 40,132.20 6.36 42.66 75.27 −0.63 Nucleus PeMADS2 P_edulia010000334.g LG01 190 21,875.00 9.76 48.93 76.47 −0.826 Nucleus PeMADS3 P_edulia010000557.g LG01 194 22,380.57 9.73 48.13 76.91 −0.818 Nucleus PeMADS4 P_edulia010000858.g LG01 387 42,577.71 9 35.16 66.05 −0.687 Nucleus PeMADS5 P_edulia010002143.g LG01 225 25,469.32 10.31 48.64 72.8 −0.629 Nucleus PeMADS6 P_edulia010002220.g LG01 251 29,014.90 5.84 63.89 80 −0.551 Nucleus PeMADS7 P_edulia010002256.g LG01 650 71,572.97 8.88 42.57 89.43 −0.259 Nucleus PeMADS8 P_edulia010002353.g LG01 223 25,645.29 9.51 53.22 83.54 −0.658 Nucleus PeMADS9 P_edulia010002348.g LG01 223 25,567.89 8.11 57.08 92.29 −0.209 Mitochondria PeMADS10 P_edulia010002733.g LG01 223 25,520.75 8.12 58.33 90.54 −0.242 Mitochondria PeMADS11 P_edulia010002726.g LG01 223 25,663.32 9.51 50.74 82.24 −0.671 Nucleus PeMADS12 P_edulia010003864.g LG01 227 25,943.71 9.08 53 82.91 −0.609 Nucleus PeMADS13 P_edulia010004192.g LG01 128 14,242.54 10.33 37.36 91.33 −0.087 Nucleus PeMADS14 P_edulia010004199.g LG01 166 19,203.34 9.3 45.27 93.31 −0.031 Nucleus PeMADS15 P_edulia010004299.g LG01 342 38,721.37 6.08 55.69 74.18 −0.57 Nucleus PeMADS16 P_edulia010004354.g LG01 283 32,306.41 8.22 56.25 75.51 −0.63 Nucleus PeMADS17 P_edulia010004671.g LG01 274 31,672.19 9.28 43.23 80.47 −0.444 Nucleus PeMADS18 P_edulia010004713.g LG01 212 24,765.59 9.74 44.1 84.2 −0.322 Nucleus PeMADS19 P_edulia010005413.g LG01 154 17,785.60 9.61 43.32 87.34 −0.638 Nucleus PeMADS20 P_edulia020006530.g LG02 78 9,025.34 9.69 44.24 83.72 −0.615 Nucleus PeMADS21 P_edulia020007073.g LG02 244 28,034.94 6.48 56.57 85.53 −0.696 Nucleus PeMADS22 P_edulia030008390.g LG03 141 15,691.08 6.8 40.59 89.36 0.119 Nucleus PeMADS23 P_edulia030008412.g LG03 233 27,189.87 8.39 37.53 86.57 −0.842 Cytoplasm PeMADS24 P_edulia030008784.g LG03 255 29,597.75 7.69 62.04 85.25 −0.698 Nucleus PeMADS25 P_edulia030008868.g LG03 233 27,283.18 8.32 64.57 85.75 −0.738 Mitochondria PeMADS26 P_edulia030009361.g LG03 229 25,959.02 9.2 44.3 99.21 −0.374 Nucleus PeMADS27 P_edulia040010097.g LG04 296 34,731.28 8.36 74.87 100.41 −0.349 Nucleus PeMADS28 P_edulia040010305.g LG04 226 26,236.00 9.18 45.29 75.49 −0.773 Cytoplasm PeMADS29 P_edulia040010846.g LG04 66 7,697.02 10.69 39.17 79.7 −0.239 Nucleus PeMADS30 P_edulia050011612.g LG05 67 7,764.03 9.83 43.4 93.13 −0.452 Nucleus PeMADS31 P_edulia050012002.g LG05 117 12,998.97 10.21 46.38 66.67 −0.506 Nucleus PeMADS32 P_edulia060013073.g LG06 242 27,917.83 8.72 44.44 82.64 −0.695 Nucleus PeMADS33 P_edulia060013103.g LG06 168 19,304.06 8.43 50.78 91.19 −0.642 Nucleus PeMADS34 P_edulia060013465.g LG06 88 10,152.74 9.59 76.09 82.95 −0.448 Nucleus PeMADS35 P_edulia060013580.g LG06 240 27,317.30 9.17 49.12 84.17 −0.561 Nucleus PeMADS36 P_edulia060013765.g LG06 291 31,621.31 5.33 52.13 72.51 −0.417 Chloroplast PeMADS37 P_edulia060015308.g LG06 331 37,420.77 5.28 62.06 71 −0.684 Nucleus PeMADS38 P_edulia060015605.g LG06 221 25,409.11 9.17 40.8 83.8 −0.576 Nucleus PeMADS39 P_edulia060015604.g LG06 188 21,618.59 8.81 43.18 84.04 −0.624 Nucleus PeMADS40 P_edulia060016494.g LG06 243 28,153.00 7.13 57.79 91.11 −0.658 Nucleus PeMADS41 P_edulia060016711.g LG06 175 20,210.43 4.89 54.18 69.66 −1.058 Chloroplast PeMADS42 P_edulia060016709.g LG06 179 20,635.04 5.05 58.72 73.02 −1.001 Chloroplast PeMADS43 P_edulia060016710.g LG06 198 22,057.86 5.69 58.41 81.82 −0.657 Chloroplast PeMADS44 P_edulia070017407.g LG07 181 20,894.80 8.85 71.81 70.61 −0.809 Nucleus PeMADS45 P_edulia070017456.g LG07 248 28,225.44 9.58 47.5 90.48 −0.497 Nucleus PeMADS46 P_edulia070017776.g LG07 172 19,278.41 10 50.2 88.37 −0.621 Nucleus PeMADS47 P_edulia080019101.g LG08 214 24,404.50 9.66 53.65 70.23 −0.866 Nucleus PeMADS48 P_edulia080020106.g LG08 130 14,779.15 9.38 42.35 84.69 −0.338 Nucleus PeMADS49 P_edulia090020757.g LG09 206 23,473.42 6.98 44.32 67.57 −0.681 Nucleus PeMADS50 P_edulia090021063.g LG09 204 23,738.65 9.23 44.26 86.96 −0.739 Nucleus PeMADS51 P_edulia090021542.g LG09 214 24,401.79 9.06 59.69 67.48 −0.697 Nucleus PeMADS52 P_eduliaContig70023089.g Contig7 253 28,637.17 9.46 49.64 94.47 −0.316 Nucleus Table 1.
Characteristics about 52 PeMADS proteins of passion fruit
-
Duplicated gene pairs Ka Ks Ka/Ks Group Duplicated type PeMADS2 & PeMADS3 0 0.01 0 MIKCC/MIKCC Segmental PeMADS3 & PeMADS7 0.13 0.57 0.24 MIKCC/MIKCC Segmental PeMADS3 & PeMADS19 0.26 1.38 0.19 MIKCC/MIKCC Segmental PeMADS8 & PeMADS11 0.01 0.02 0.28 MIKCC/MIKCC Segmental PeMADS8 & PeMADS45 0.04 0.54 0.08 MIKCC/MIKCC Segmental PeMADS9 & PeMADS10 0.01 0.01 0.43 MIKCC/MIKCC Segmental PeMADS15 & PeMADS16 0 0.02 0.29 MIKC*/MIKC* Segmental PeMADS17 & PeMADS18 0.01 0.01 0.42 MIKCC/MIKCC Segmental PeMADS17 & PeMADS28 0.29 1.29 0.22 MIKCC/MIKCC Segmental PeMADS17 & PeMADS38 0.05 0.67 0.08 MIKCC/MIKCC Segmental PeMADS18 & PeMADS28 0.22 1.15 0.19 MIKCC/MIKCC Segmental PeMADS18 & PeMADS38 0.07 0.55 0.12 MIKCC/MIKCC Segmental PeMADS20 & PeMADS47 0.03 0.51 0.07 MIKCC/MIKCC Segmental PeMADS24 & PeMADS25 0 0.01 0.3 MIKCC/MIKCC Segmental PeMADS26 & PeMADS35 0.22 0.71 0.31 MIKCC/MIKCC Segmental PeMADS28 & PeMADS38 0.32 1.52 0.21 MIKCC/MIKCC Segmental PeMADS29 & PeMADS31 0.01 0.29 0.05 MIKCC/MIKCC Segmental PeMADS32 & PeMADS33 0.01 0.02 0.28 MIKCC/MIKCC Segmental PeMADS46 & PeMADS51 0.55 3.98 0.14 Mα/Mα Segmental PeMADS52 & PeMADS45 0.16 0.22 0.71 MIKCC/MIKCC Segmental PeMADS42 & PeMADS43 0.14 0.06 2.42 Mβ/Mβ tandem Table 2.
The Ka/Ks ratios of the duplicated PeMADS gene pairs.
Figures
(11)
Tables
(2)