-
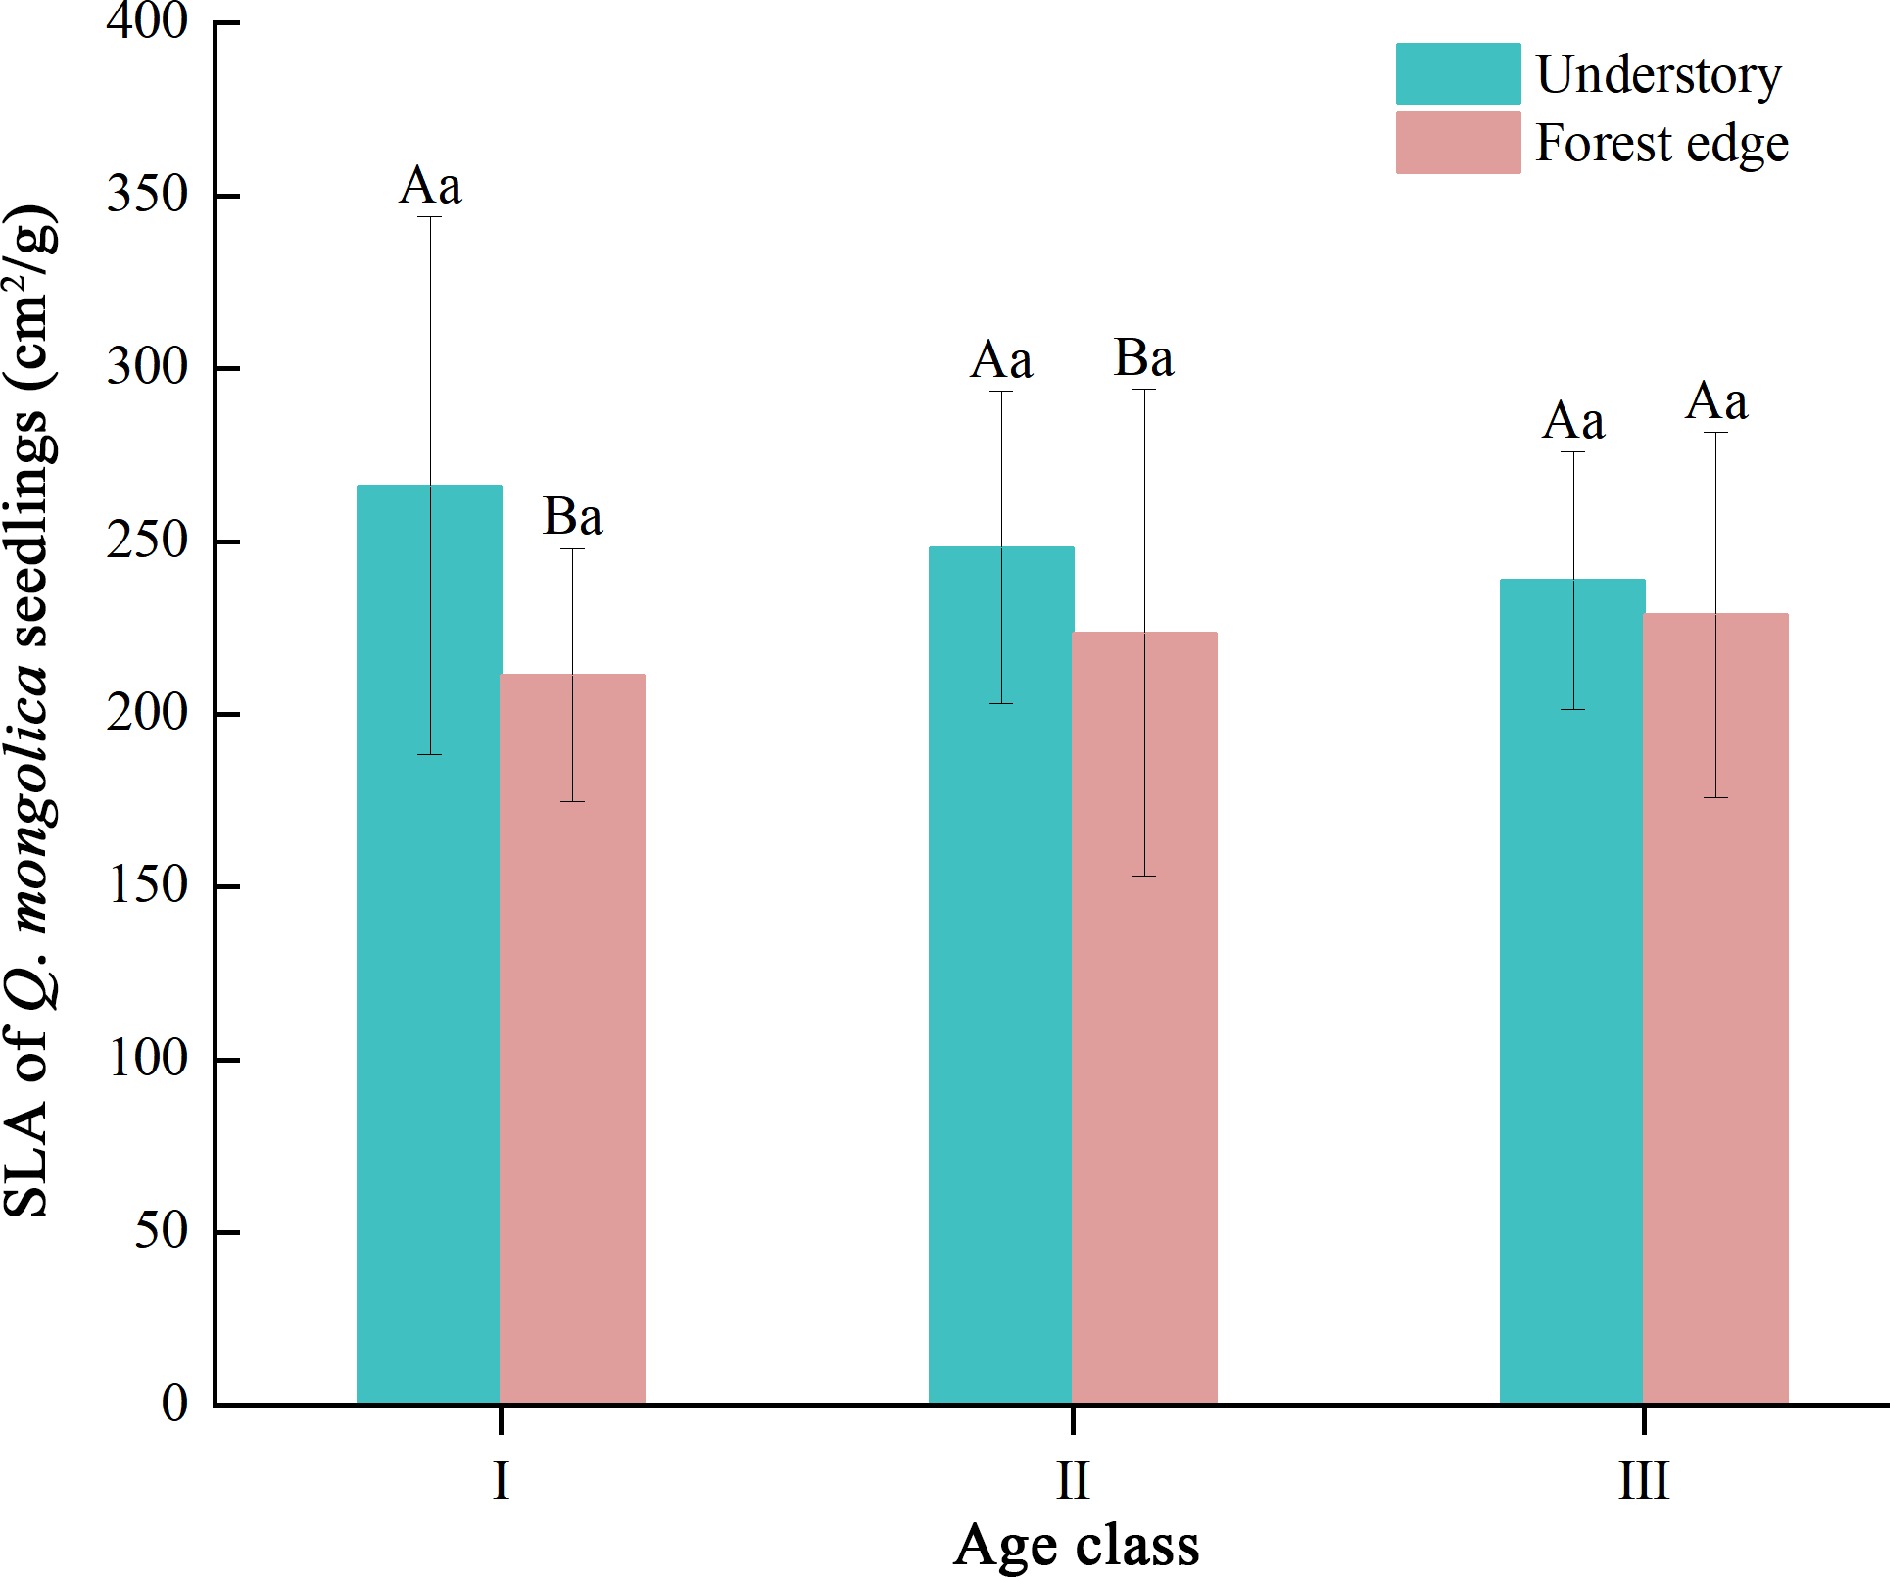
Figure 1.
SLA of Q. mongolica seedlings. SLA indicates the specific leaf area of the plant, while Roman numerals (I, II, III) represent different age classes. Different upper case letters indicate significant differences in indicators between different light environments at the same age (p < 0.05); different lower case letters indicate significant differences in indicators between age classes at the same light environment (p < 0.05).
-
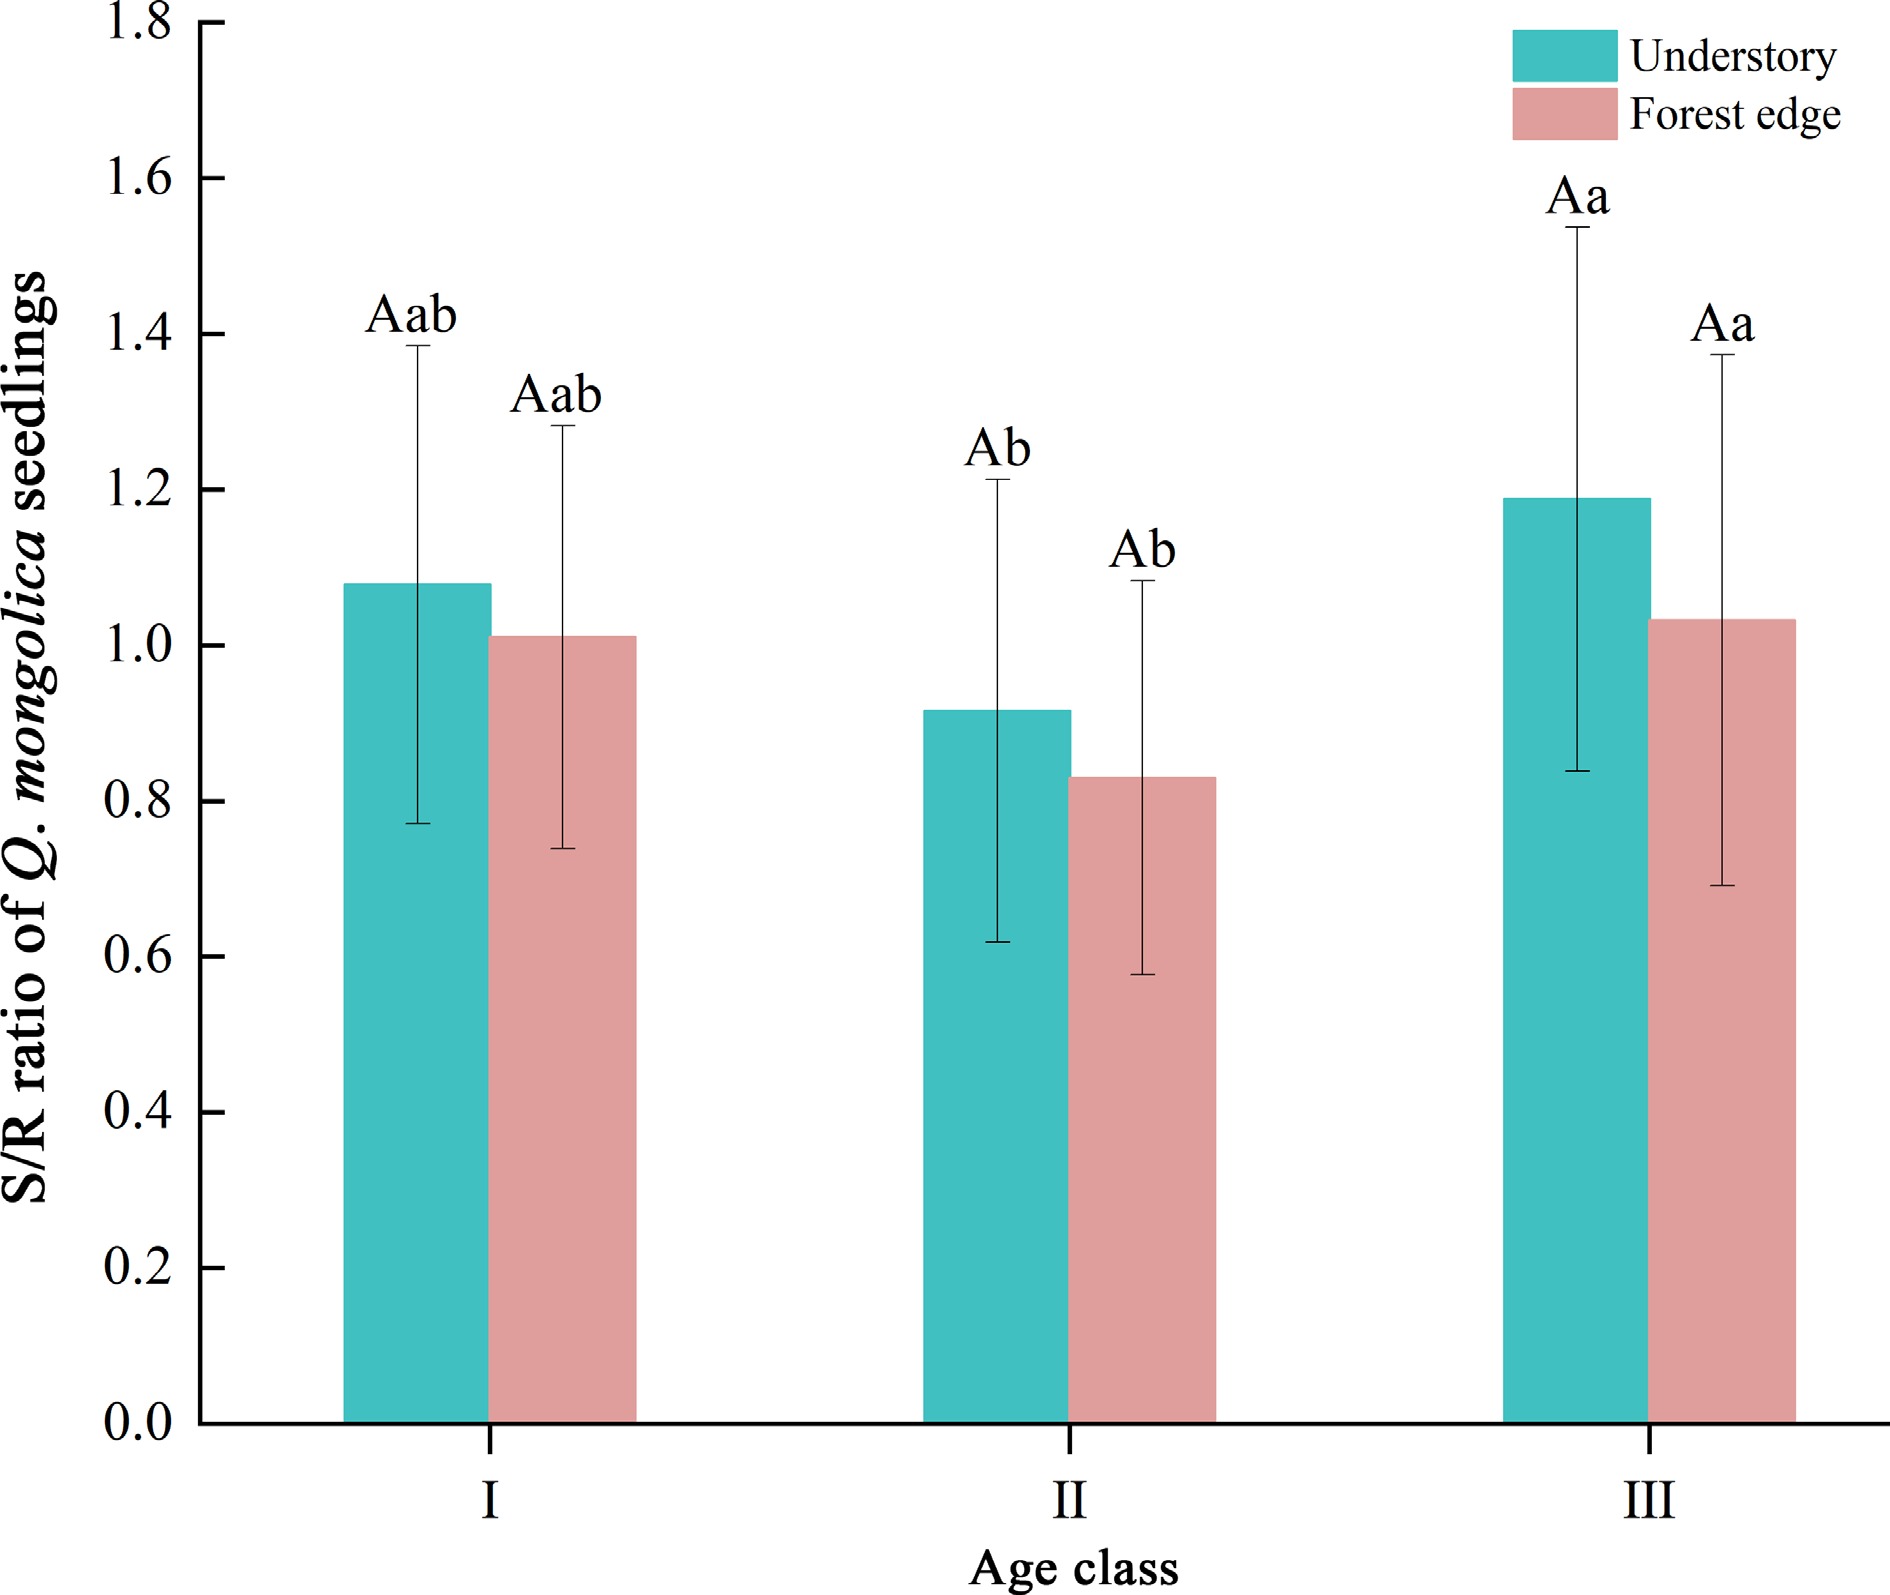
Figure 2.
S/R ratio of seedlings of Q. mongolica. The S/R ratio indicates the ratio of shoot to root of the plant, while Roman numerals (I, II, III) represent different age classes. Different upper case letters indicate significant differences in indicators between different light environments at the same age (p < 0.05); different lower case letters indicate significant differences in indicators between age classes at the same light environment (p < 0.05).
-
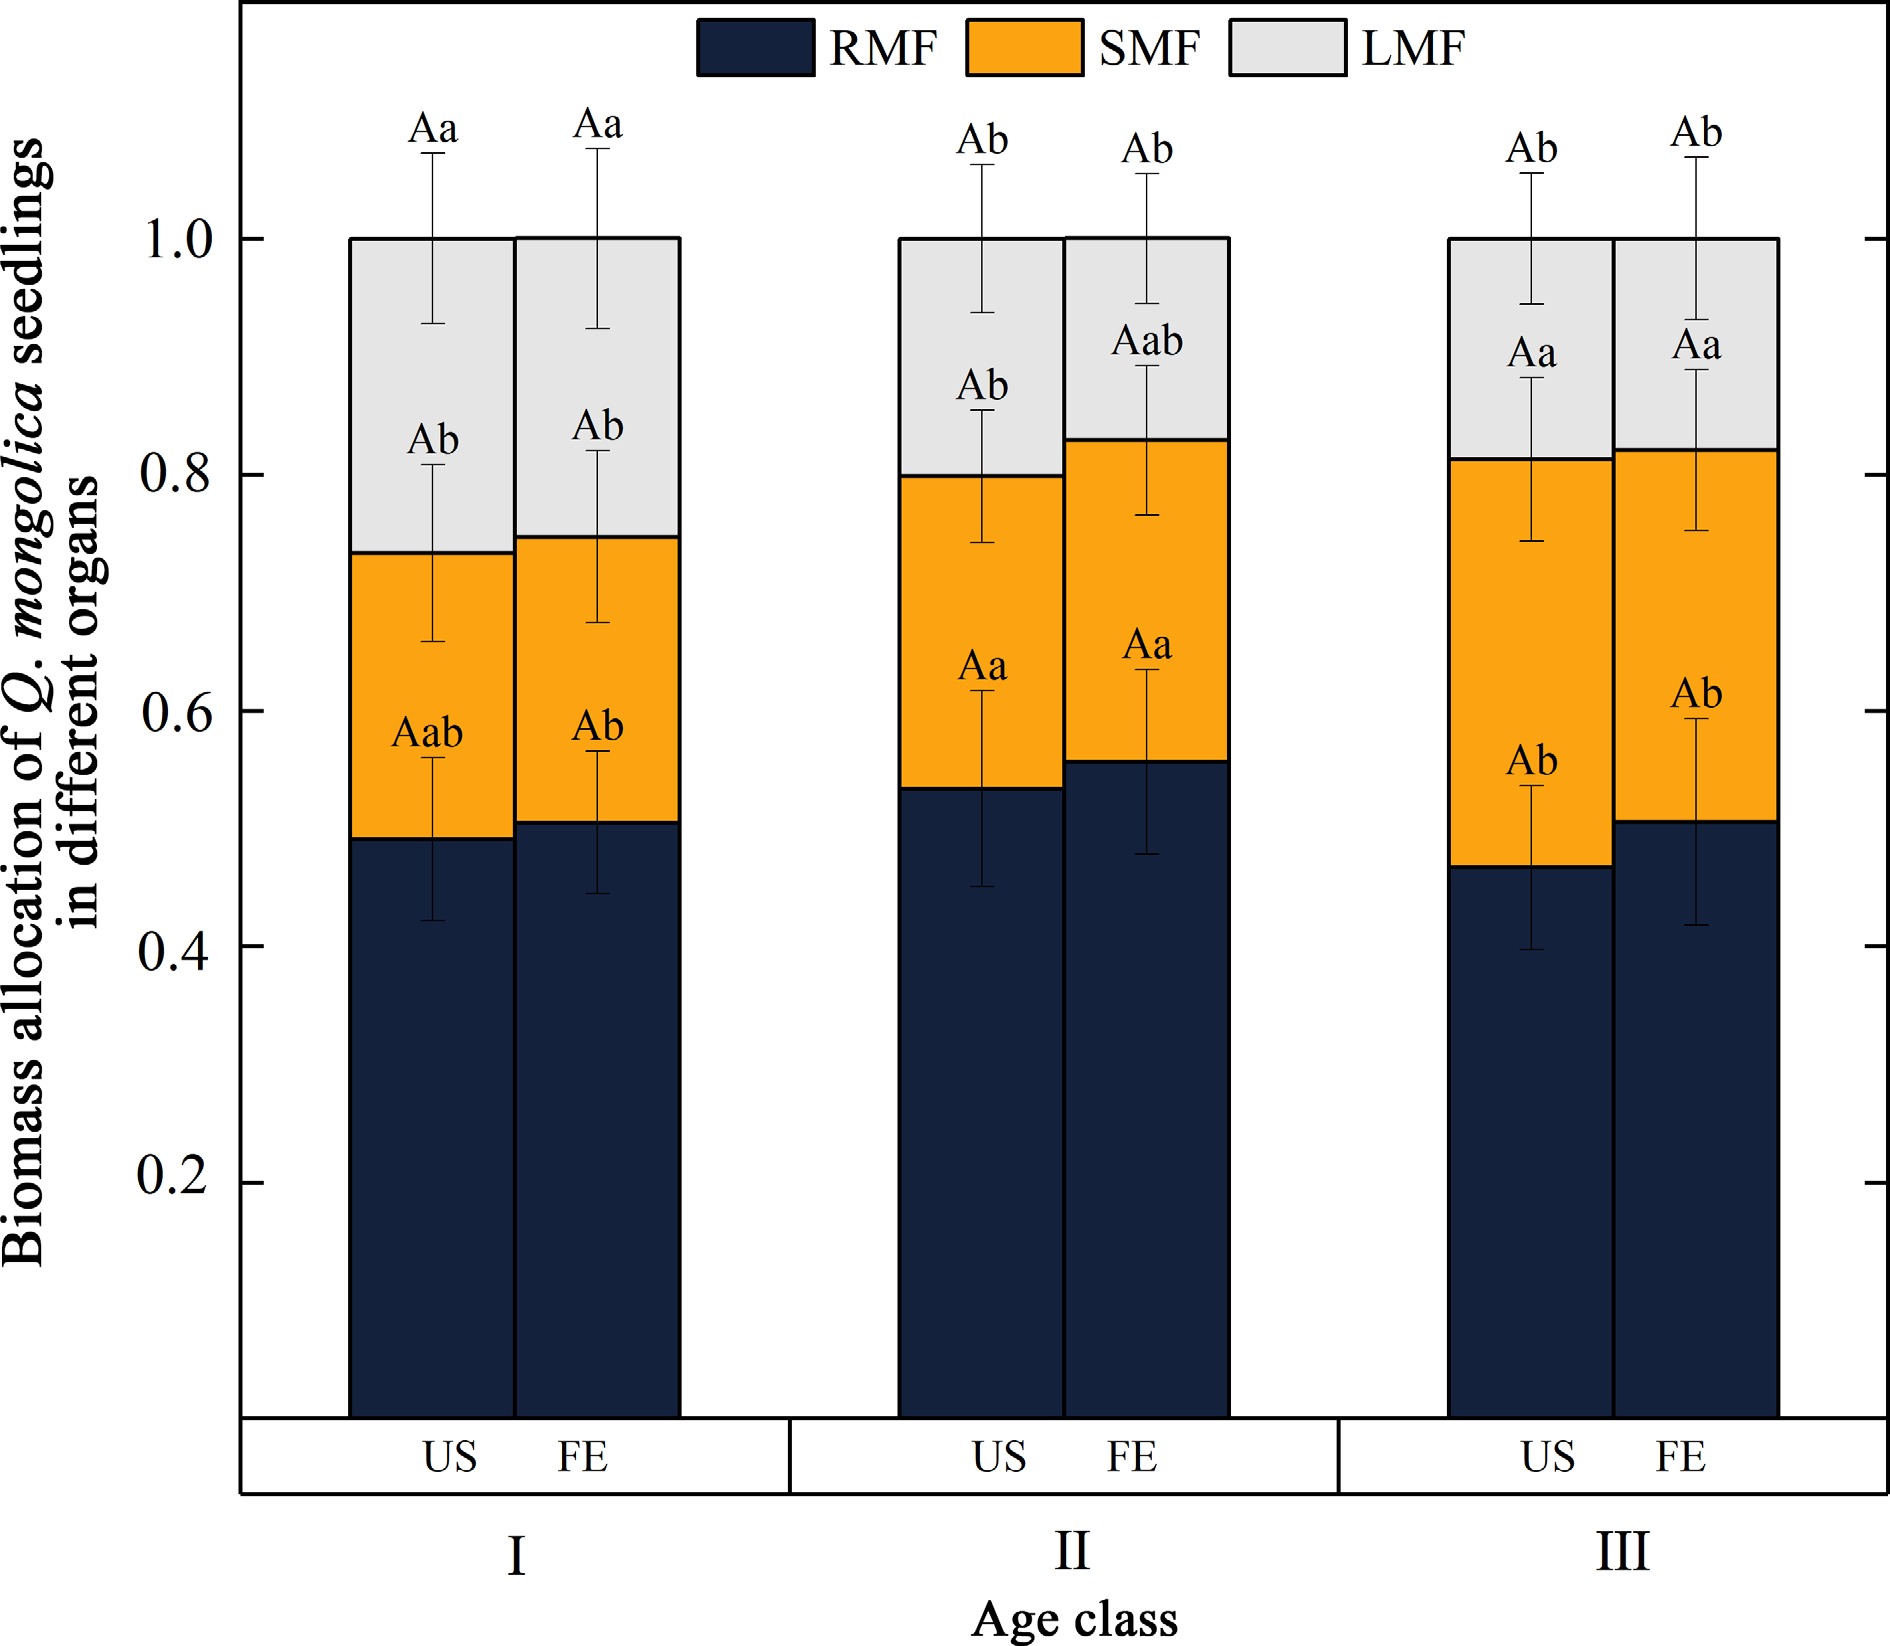
Figure 3.
Pattern of biomass allocation in Q. mongolica seedlings. (RMF) represents root mass fraction, (SMF) represents stem mass fraction, and (LMF) represents leaf mass fraction. (I, II, and III) stand for different age classes. Light environments include US (forest understory) and FE (forest edge). Different capital letters indicate significant differences in the indicators between different light environments at the same age (p < 0.05); different lower case letters indicate significant differences in the indicators between age classes at the same light environment (p < 0.05).
-
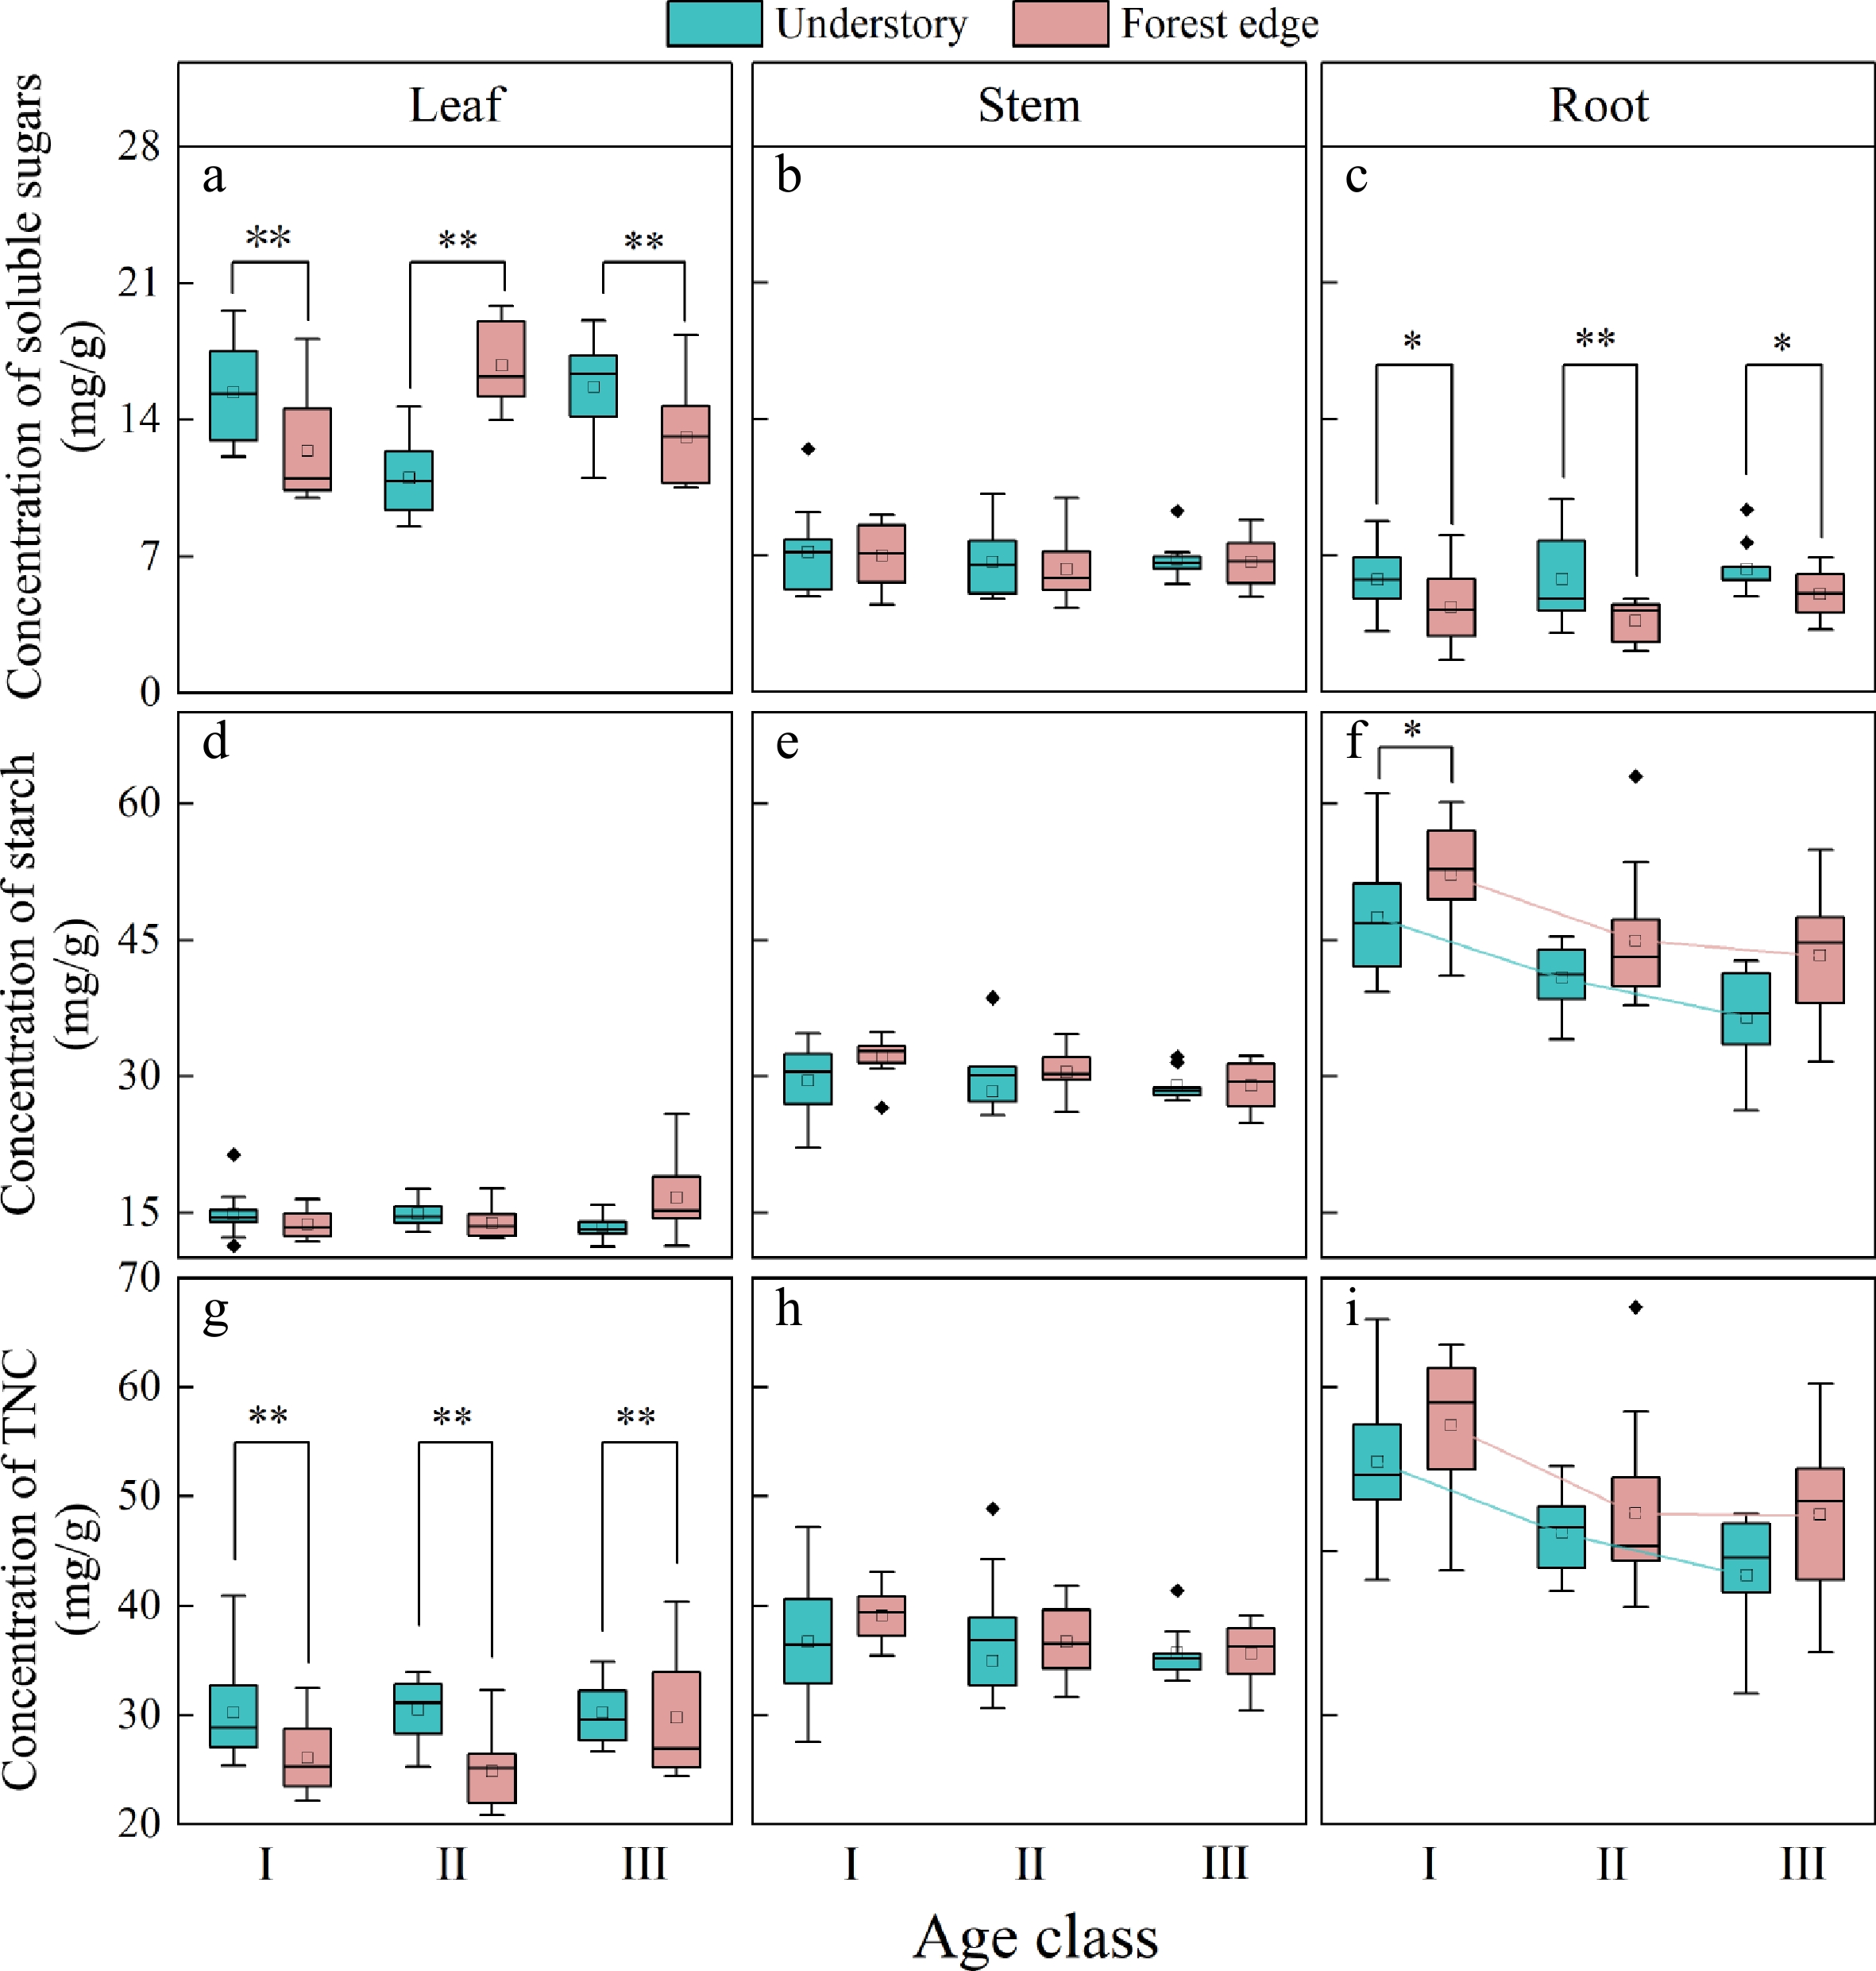
Figure 4.
NSC concentration of the individual organs in Q. mongolica seedlings. (a) Soluble sugar concentration in the leaves, (b) soluble sugar concentration in the stems, (c) soluble sugar concentration in the roots, (d) starch concentration in the leaves, (e) starch concentration in the stems, (f) starch concentration in the roots, (g) TNC concentration in the leaves, (h) TNC concentration in the stems, (i) TNC concentration in the roots. I, II, and III represent age classes. * stands for significance at a level of 0.05; **stands for significance at a level of 0.01.
-
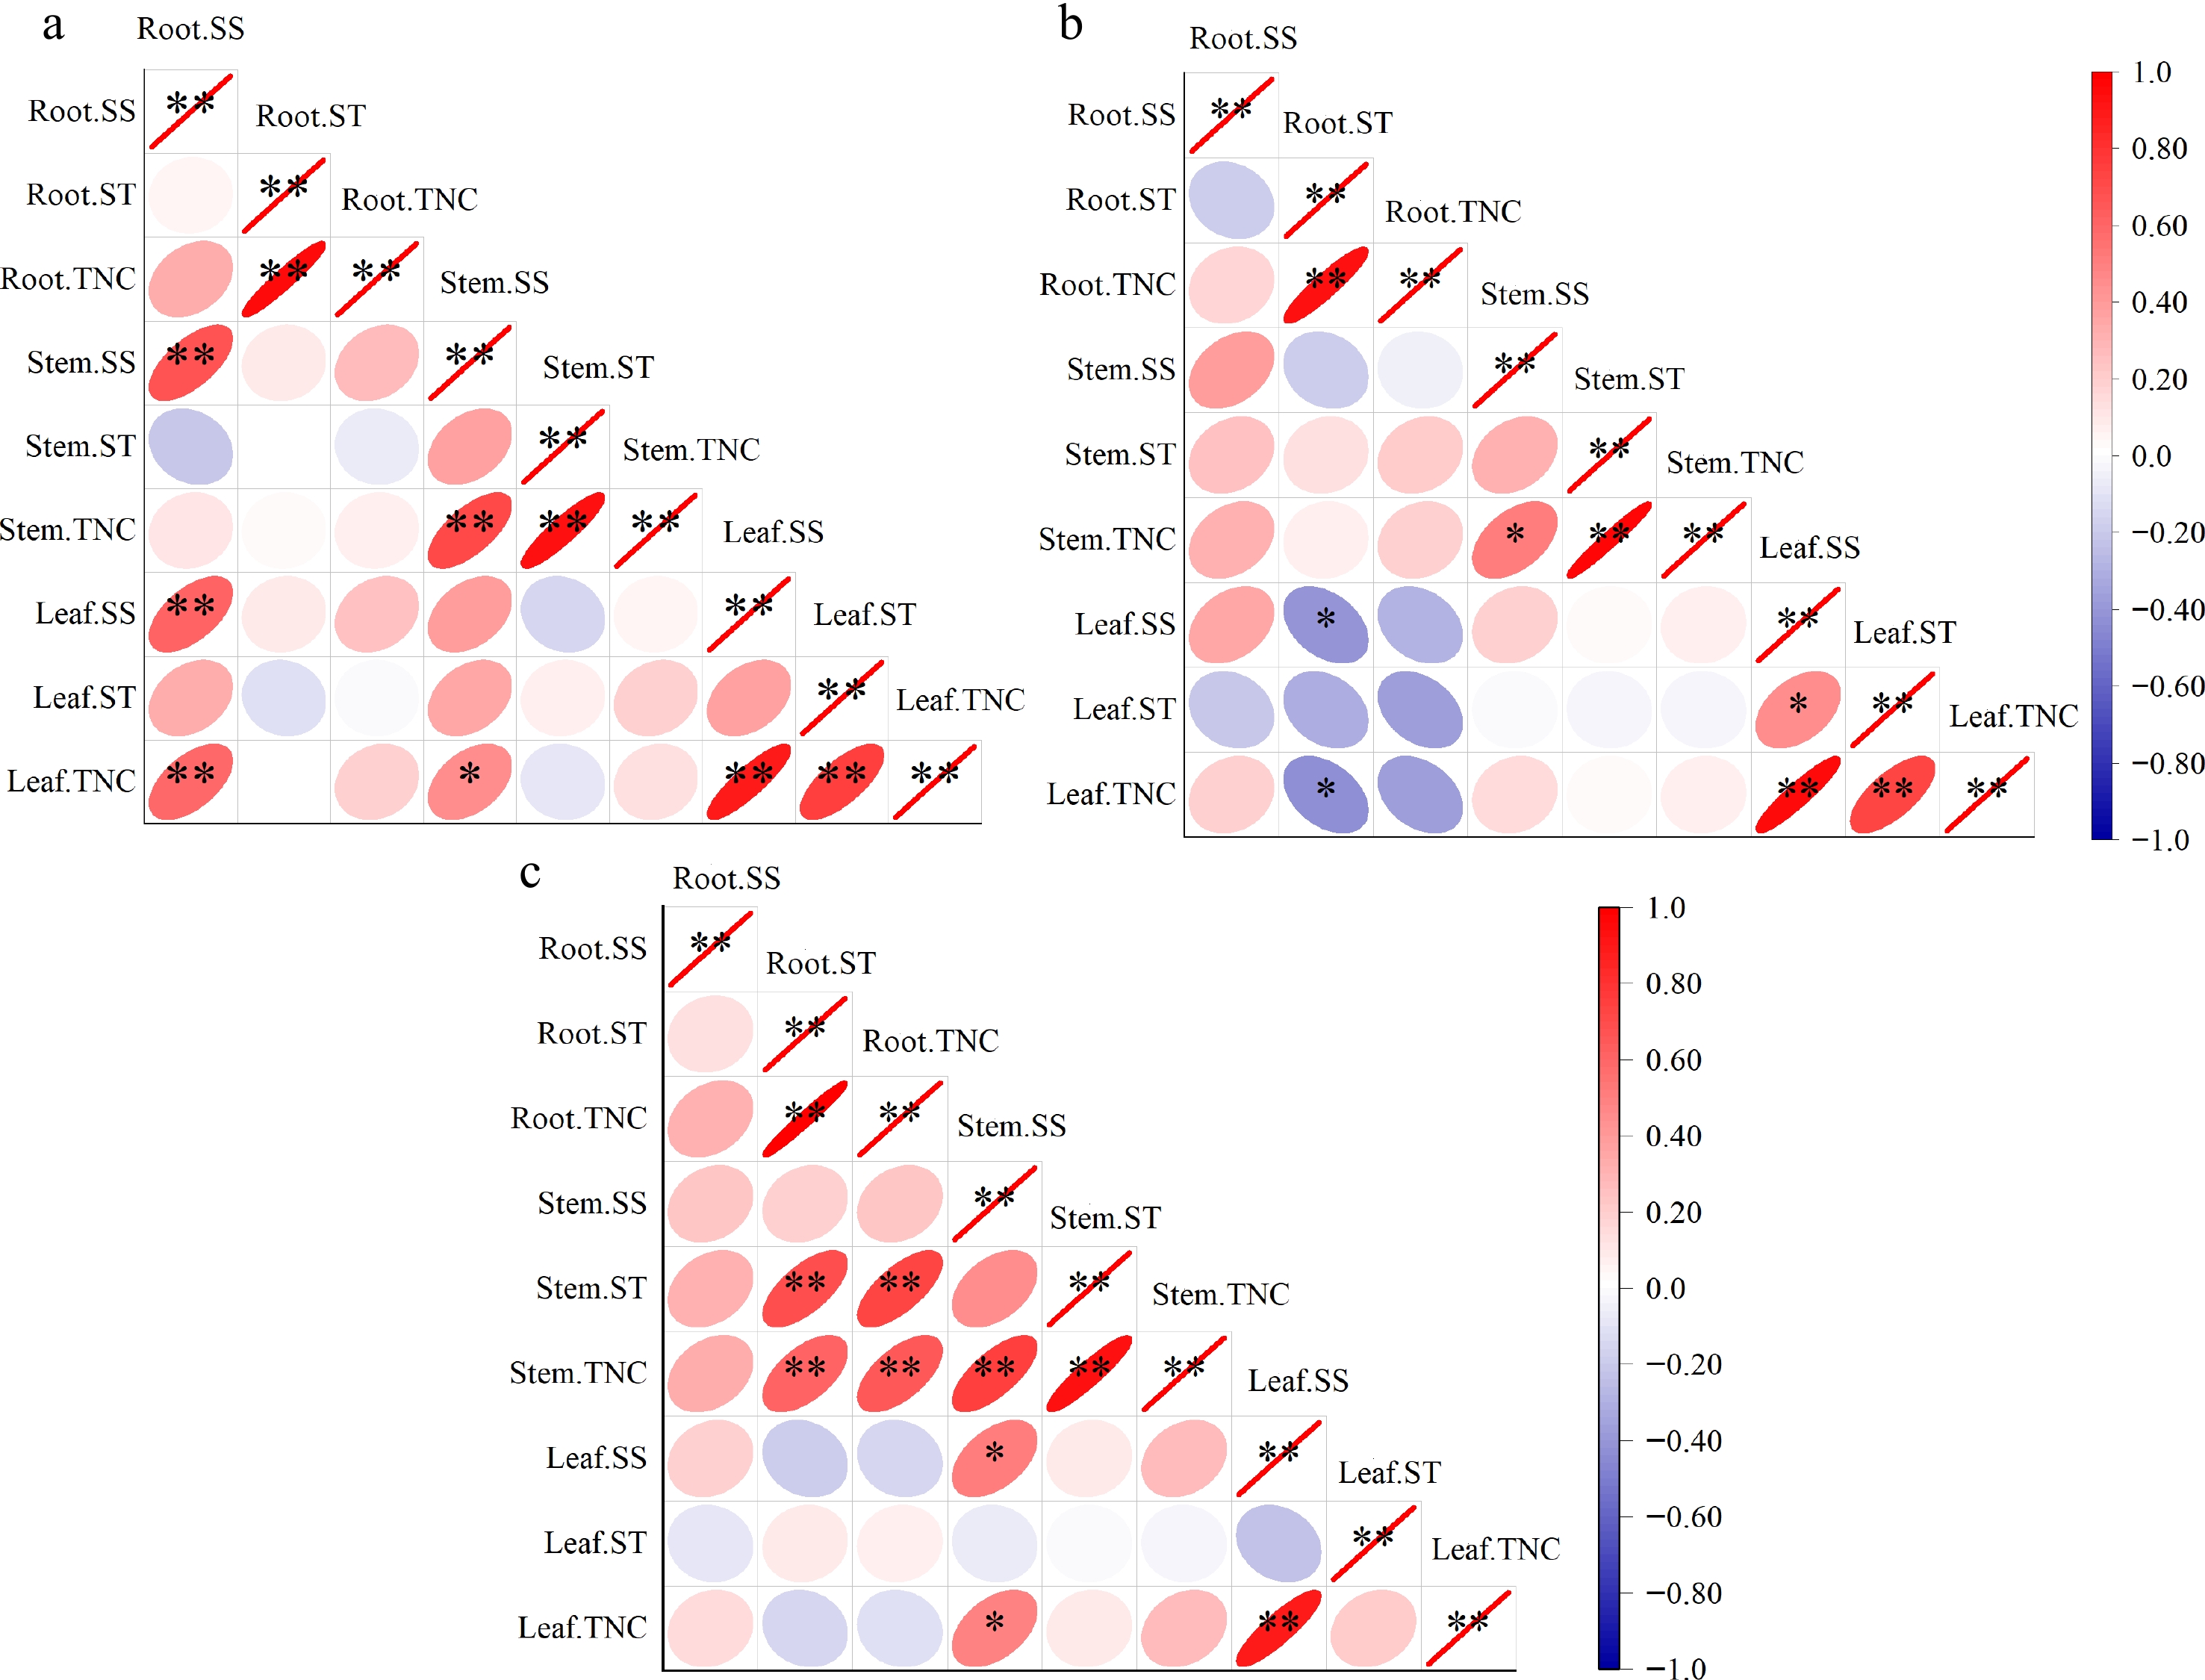
Figure 5.
Correlation analysis between the NSC concentrations of Q. mongolica seedlings in different age classes (Pearson). (a) 1−2 years old, (b) 3−4 years old, (c) 5−6 years old. Red stands for a positive correlation and blue for a negative correlation. The darker the colour, the higher the correlation. * stands for significance at a level of 0.05; ** stands for significance at a level of 0.01.
-
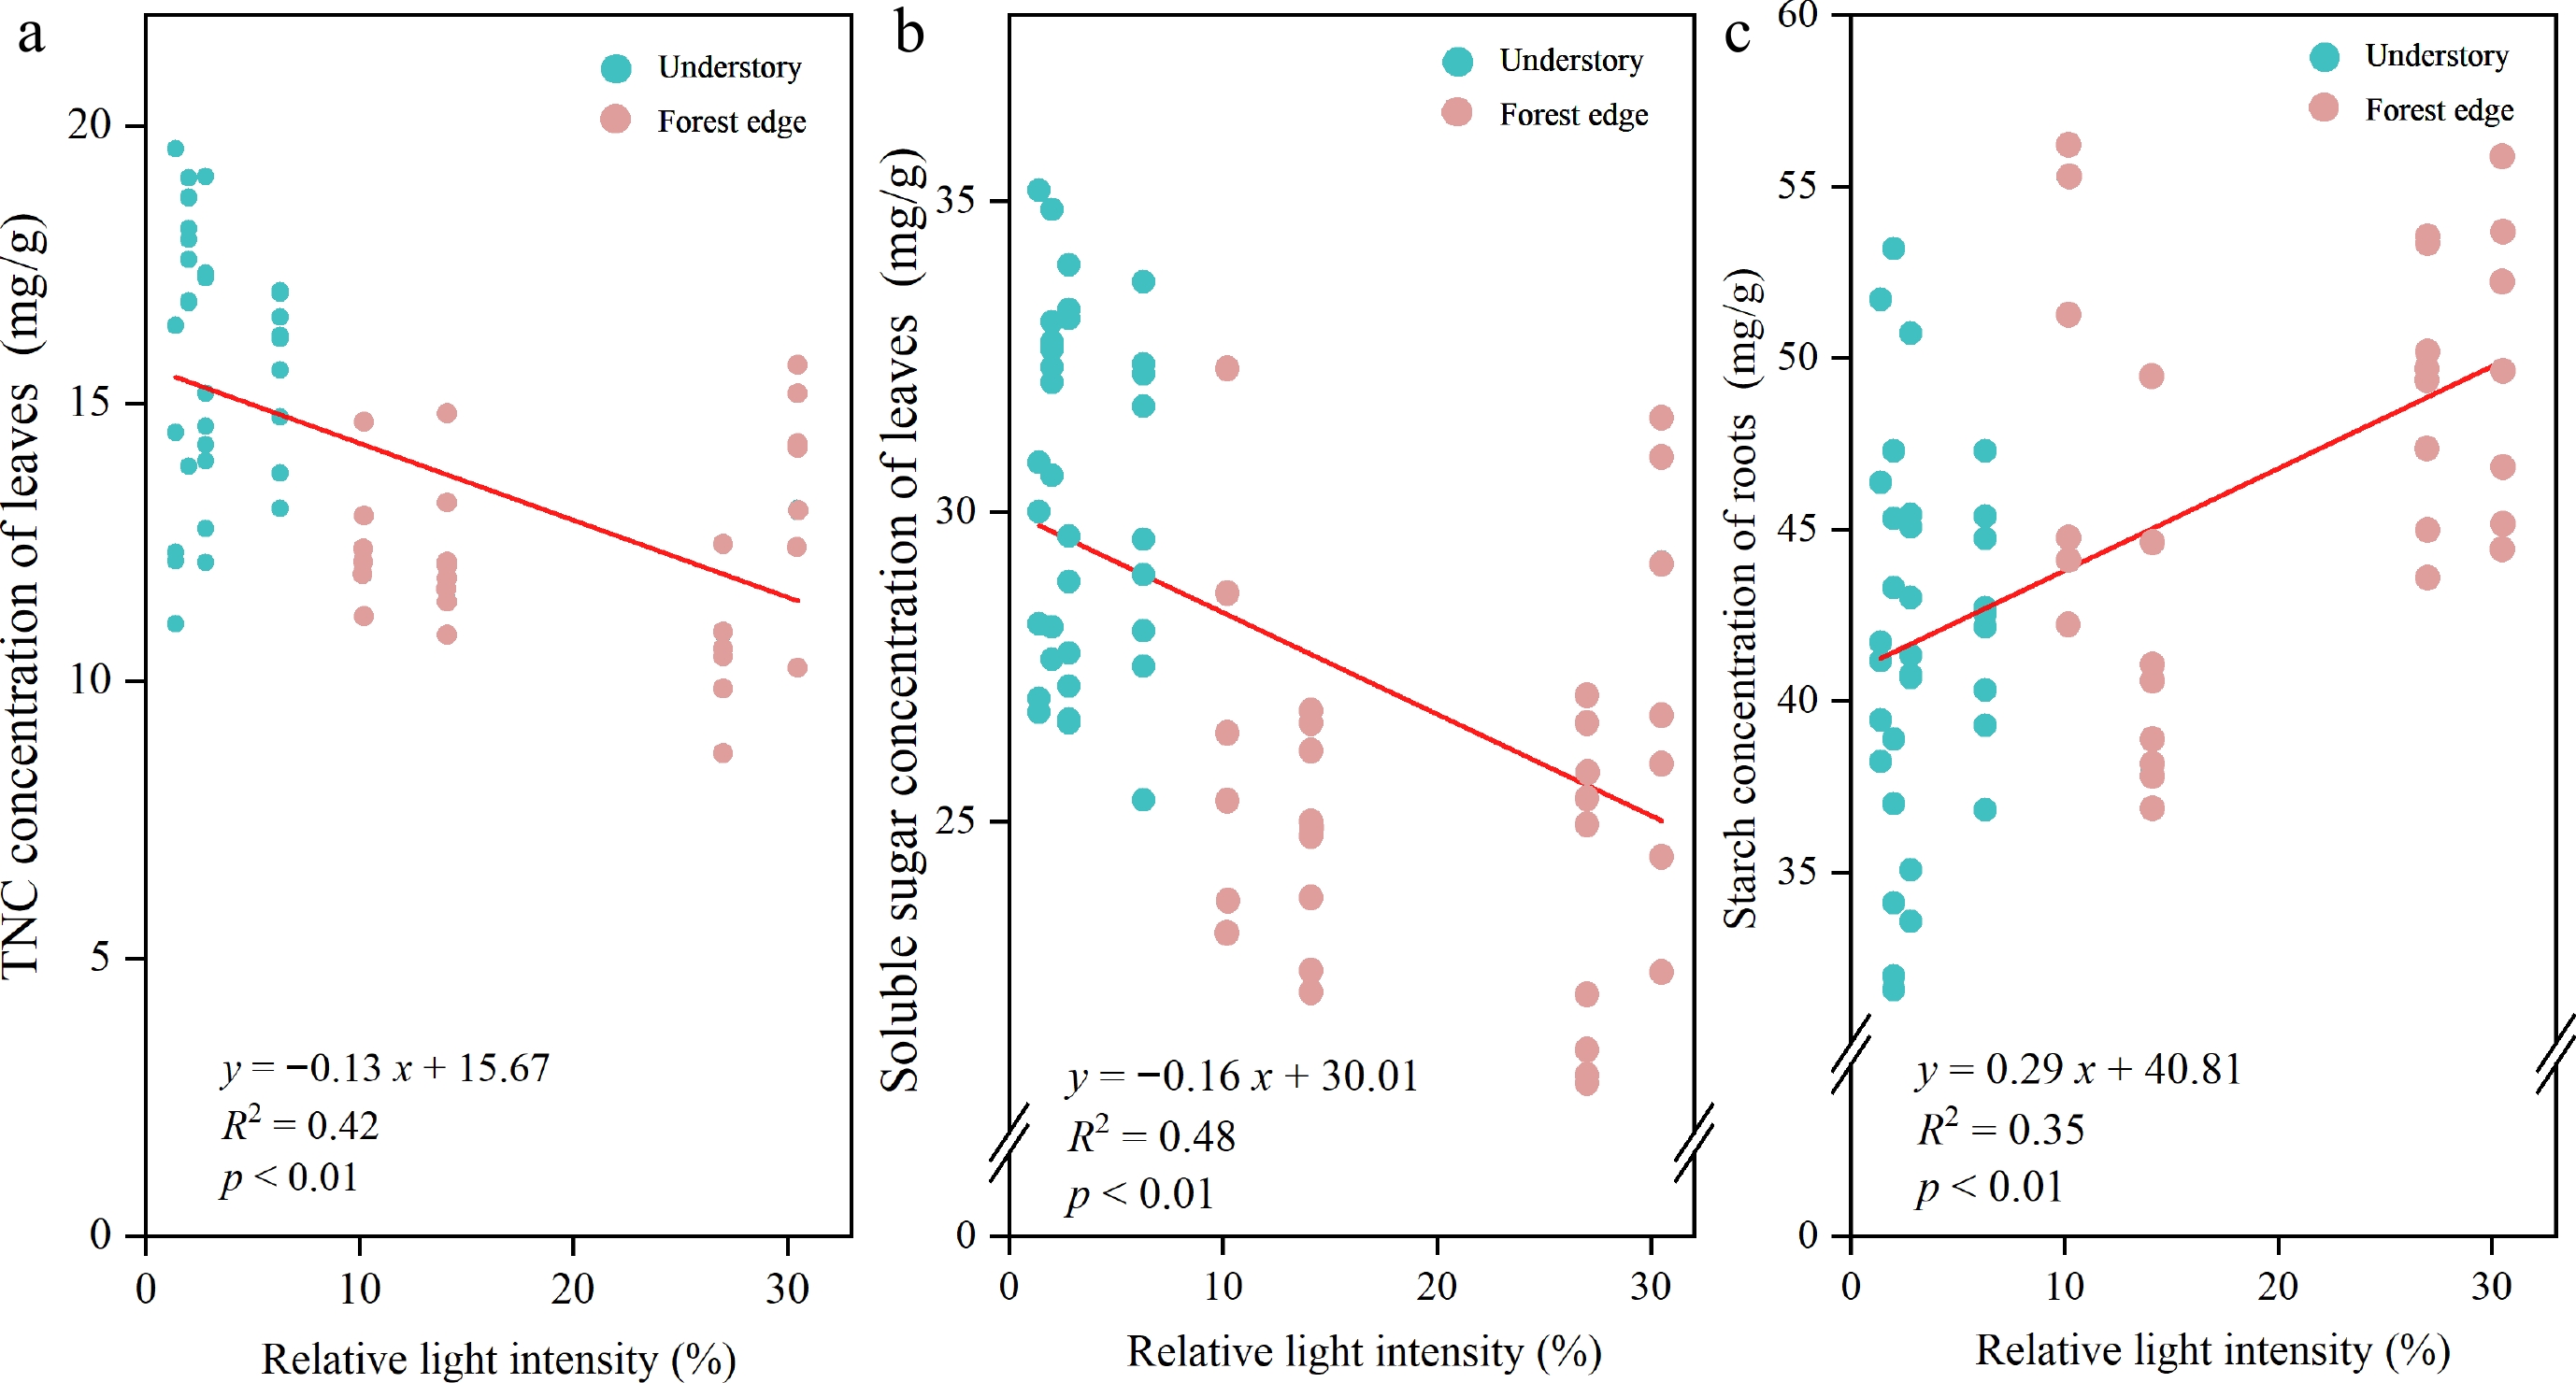
Figure 6.
The correlation relationships between the relative light intensity and the (a) TNC concentration in the leaves, (b) the soluble sugar concentration in the leaves and (c) the starch concentration in the roots. The equation of the linear regression, the r-square and the p-values are also shown in the graph.
-
Plantation Area
(hm2)Average
DBH (cm)Average tree
height (m)Stand density
(plant/hm2)Q. mongolica 1.2526 15.03 12.99 2,050 F. chinensis 0.8904 25.16 17.33 375 B. platyphylla 1.2722 9.88 10.26 1,675 P. sylvestris 1.2259 14.74 13.10 1,600 Species included Quercus mongolica Fisch. ex Ledeb., Fraxinus chinensis subsp. rhynchophylla (Hance) E. Murray, Betula platyphylla Sukaczev and Pinus sylvestris var. mongholica Litv. Table 1.
Plantations from which seedlings were collected, the area of each plantation, the average tree height and the average diameter at breast height (DBH).
-
Plantation Light environment Age class Height
(cm) ± SDBasal diameter
(mm) ± SDF. chinensis Understory 1−2a 20.83 ± 3.13 2.99 ± 0.52 3−4a 41.51 ± 4.08 4.87 ± 0.69 5−6a 66.33 ± 1.69 6.82 ± 0.49 Forest edge 1−2a 16.15 ± 1.63 2.52 ± 0.29 3−4a 43.13 ± 5.78 4.95 ± 0.65 5−6a 66.29 ± 3.55 6.93 ± 0.86 P. sylvestris Understory 1−2a 20.58 ± 4.53 2.98 ± 0.61 3−4a 39.56 ± 4.91 5.06 ± 0.42 5−6a 62.33 ± 5.39 6.94 ± 0.11 Forest edge 1−2a 21.67 ± 2.19 2.94 ± 0.30 3−4a 42.75 ± 4.76 4.48 ± 0.42 5−6a 65.71 ± 2.94 6.63 ± 0.44 B. platyphylla Understory 1−2a 26.53 ± 3.98 3.31 ± 0.36 3−4a 45.09 ± 4.52 5.21 ± 0.56 5−6a 65.26 ± 3.40 6.23 ± 0.19 Forest edge 1−2a 23.16 ± 5.63 3.52 ± 0.22 3−4a 37.52 ± 2.53 4.89 ± 0.45 5-6a 61.73 ± 1.79 6.61 ± 0.44 Q. mongolica Understory 1−2a 20.16 ± 4.74 2.94 ± 0.56 3−4a 40.75 ± 6.64 4.94 ± 0.73 5−6a — — Forest edge 1−2a 19.16 ± 2.73 2.86 ± 0.59 3−4a 40.01 ± 4.94 4.47 ± 0.26 5−6a — — Species included Quercus mongolica Fisch. ex Ledeb., Fraxinus chinensis subsp. rhynchophylla (Hance) E. Murray, Betula platyphylla Sukaczev and Pinus sylvestris var. mongholica Litv. Table 2.
Average height and basal diameter (± SD) of Q. mongolica seedlings of all age classes in the forest understory and at the forest edge in four plantations.
-
Plantation Relative light intensity (%) Forest understory Forest edge Q. mongolica 1.4 10.2 F. chinensis 2.0 30.5 B. platyphylla 2.8 14.1 P. sylvestris 6.3 27.0 Table 3.
Relative light intensity of the sample plot.
-
Abbreviation Full name Definition Units US Forest understory Under the forest canopy, beyond 10 meters from the boundary, the canopy closure is around 80%. − FE Forest edge At the edge of the forest, within 10 meters from the boundary, the canopy closure is around 50%. − RLI Relative light intensity The light intensity at the observation point / full light intensity. g/g SLA Specific leaf area Specific leaf area / leaf dry mass. cm2/g LMF Leaf mass fraction Leaf dry mass / total plant dry mass. g/g SMF Stem mass fraction Stem dry mass / total plant dry mass. mg/g RMF Root mass fraction Root dry mass / total plant dry mass. g/g S/R ratio Shoot to root ratio (leaf + stem dry mass) / root dry mass. g/g SS Soluble sugar − g/g ST Starch − mg/g TNC Total non-structural carbohydrates Startch +Soluble sugar concentration. mg/g Table 4.
Abbreviations used in this article together with their definitions and units.
-
Functional traits Seedling
ageLight environment Light environment
* seedling ageMarginal R2/
Conditional R2SLA 0.11 <0.01** <0.01** 0.081/0.123 RMF <0.01** 0.12 0.87 0.095/0.324 SMF <0.01** 0.85 0.54 0.167/0.224 LMF <0.01** 0.09 0.63 0.233/0.398 S/R ratio <0.01** 0.1 0.92 0.086/0.296 SLA (specific leaf area), RMF (root mass fraction), SMF (stem mass fraction), LMF (leaf mass fraction) and S/R ratio (shoot-to-root ratio). Significance levels: * p < 0.05, ** p < 0.01. Table 5.
p-values of linear mixed-effects models assessing the significance of fixed and interaction effects of light environment and seedling age on the functional traits of Q. mongolica seedlings, as well as the model conditional R2 and the marginal R2 of the model.
-
Organs NSC Seedling age Light environment Light environment * seedling age Marginal R2/
Conditional R2Root SS 0.282 <0.01** <0.01** 0.221/0.414 ST <0.01** <0.01** <0.01** 0.362/0.458 TNC <0.01** 0.08 <0.01** 0.288/0.414 Stem SS 0.38 0.5 0.97 0.028/0.186 ST 0.33 0.15 0.61 0.069/0.133 TNC 0.24 0.28 0.7 0.058/0.175 Leaf SS 0.33 <0.01** 0.31 0.373/0.609 ST 0.08 0.86 <0.01** 0.143/0.419 TNC 0.12 <0.01** 0.08 0.262/0.402 SS (soluble sugars), ST (starch), TNC (total non-structural carbohydrates). Significance levels: * p < 0.05, ** p < 0.01. Table 6.
p-values of the linear mixed-effects models assessing the significance of the fixed and interaction effects of light environment and seedling age on NSC in Q. mongolica seedlings, as well as the model conditional R2 and the marginal R2 of the model.
-
Indicators Age class I Marginal R2/
Conditional R2Age class II Marginal R2/
Conditional R2Age class III Marginal R2/
Conditional R2SLA <0.01** 0.208/0.229 0.42 0.003/0.018 0.77 0.006/0.206 RMF 0.35 0.011/0.157 0.43 0.011/0.402 0.74 0.001/0.659 SMF 0.61 0.003/0.262 0.57 0.006/0.281 0.28 0.048/0.148 LMF 0.73 0.001/0.338 0.10 0.051/0.371 0.79 0.001/0.461 S/R ratio 0.29 0.013/0.143 0.36 0.015/0.373 0.61 0.005/0.496 Root SS 0.02* 0.132/0.443 0.07 0.248/0.704 0.03* 0.216/0.216 Root ST 0.14 0.128/0.458 <0.01** 0.106/0.354 0.04* 0.137/0.477 Root TNC 0.10 0.053/0.578 0.03* 0.021/0.282 0.12 0.093/0.336 Stem SS 0.77 0.026/0.334 0.57 0.011/0.215 0.39 0.024/0.422 Stem ST 0.06 0.131/0.362 0.46 0.023/0.023 0.86 0.001/0.288 Stem TNC 0.14 0.064/0.385 0.58 0.013/0.056 0.85 0.001/0.335 Leaf SS 0.04* 0.202/0.698 <0.01** 0.532/0.590 0.03* 0.395/0.841 Leaf ST 0.18 0.076/0.076 0.10 0.091/0.298 0.15 0.015/0.876 Leaf TNC 0.02* 0.214/0.395 <0.01** 0.462/0.462 0.01* 0.061/0.855 SLA (specific leaf area), RMF (root mass fraction), SMF (stem mass fraction), LMF (leaf mass fraction), S/R ratio (shoot-to-root ratio), SS (soluble sugars), ST (starch) and TNC (total non-structural carbohydrates). Significance levels: * p < 0.05, ** p < 0.01. Table 7.
p-values for linear mixed-effects models measuring the effects of light environment on functional traits and NSC concentrations in seedlings of different age classes, and conditional R2 and marginal R2 for the models.
Figures
(6)
Tables
(7)