-
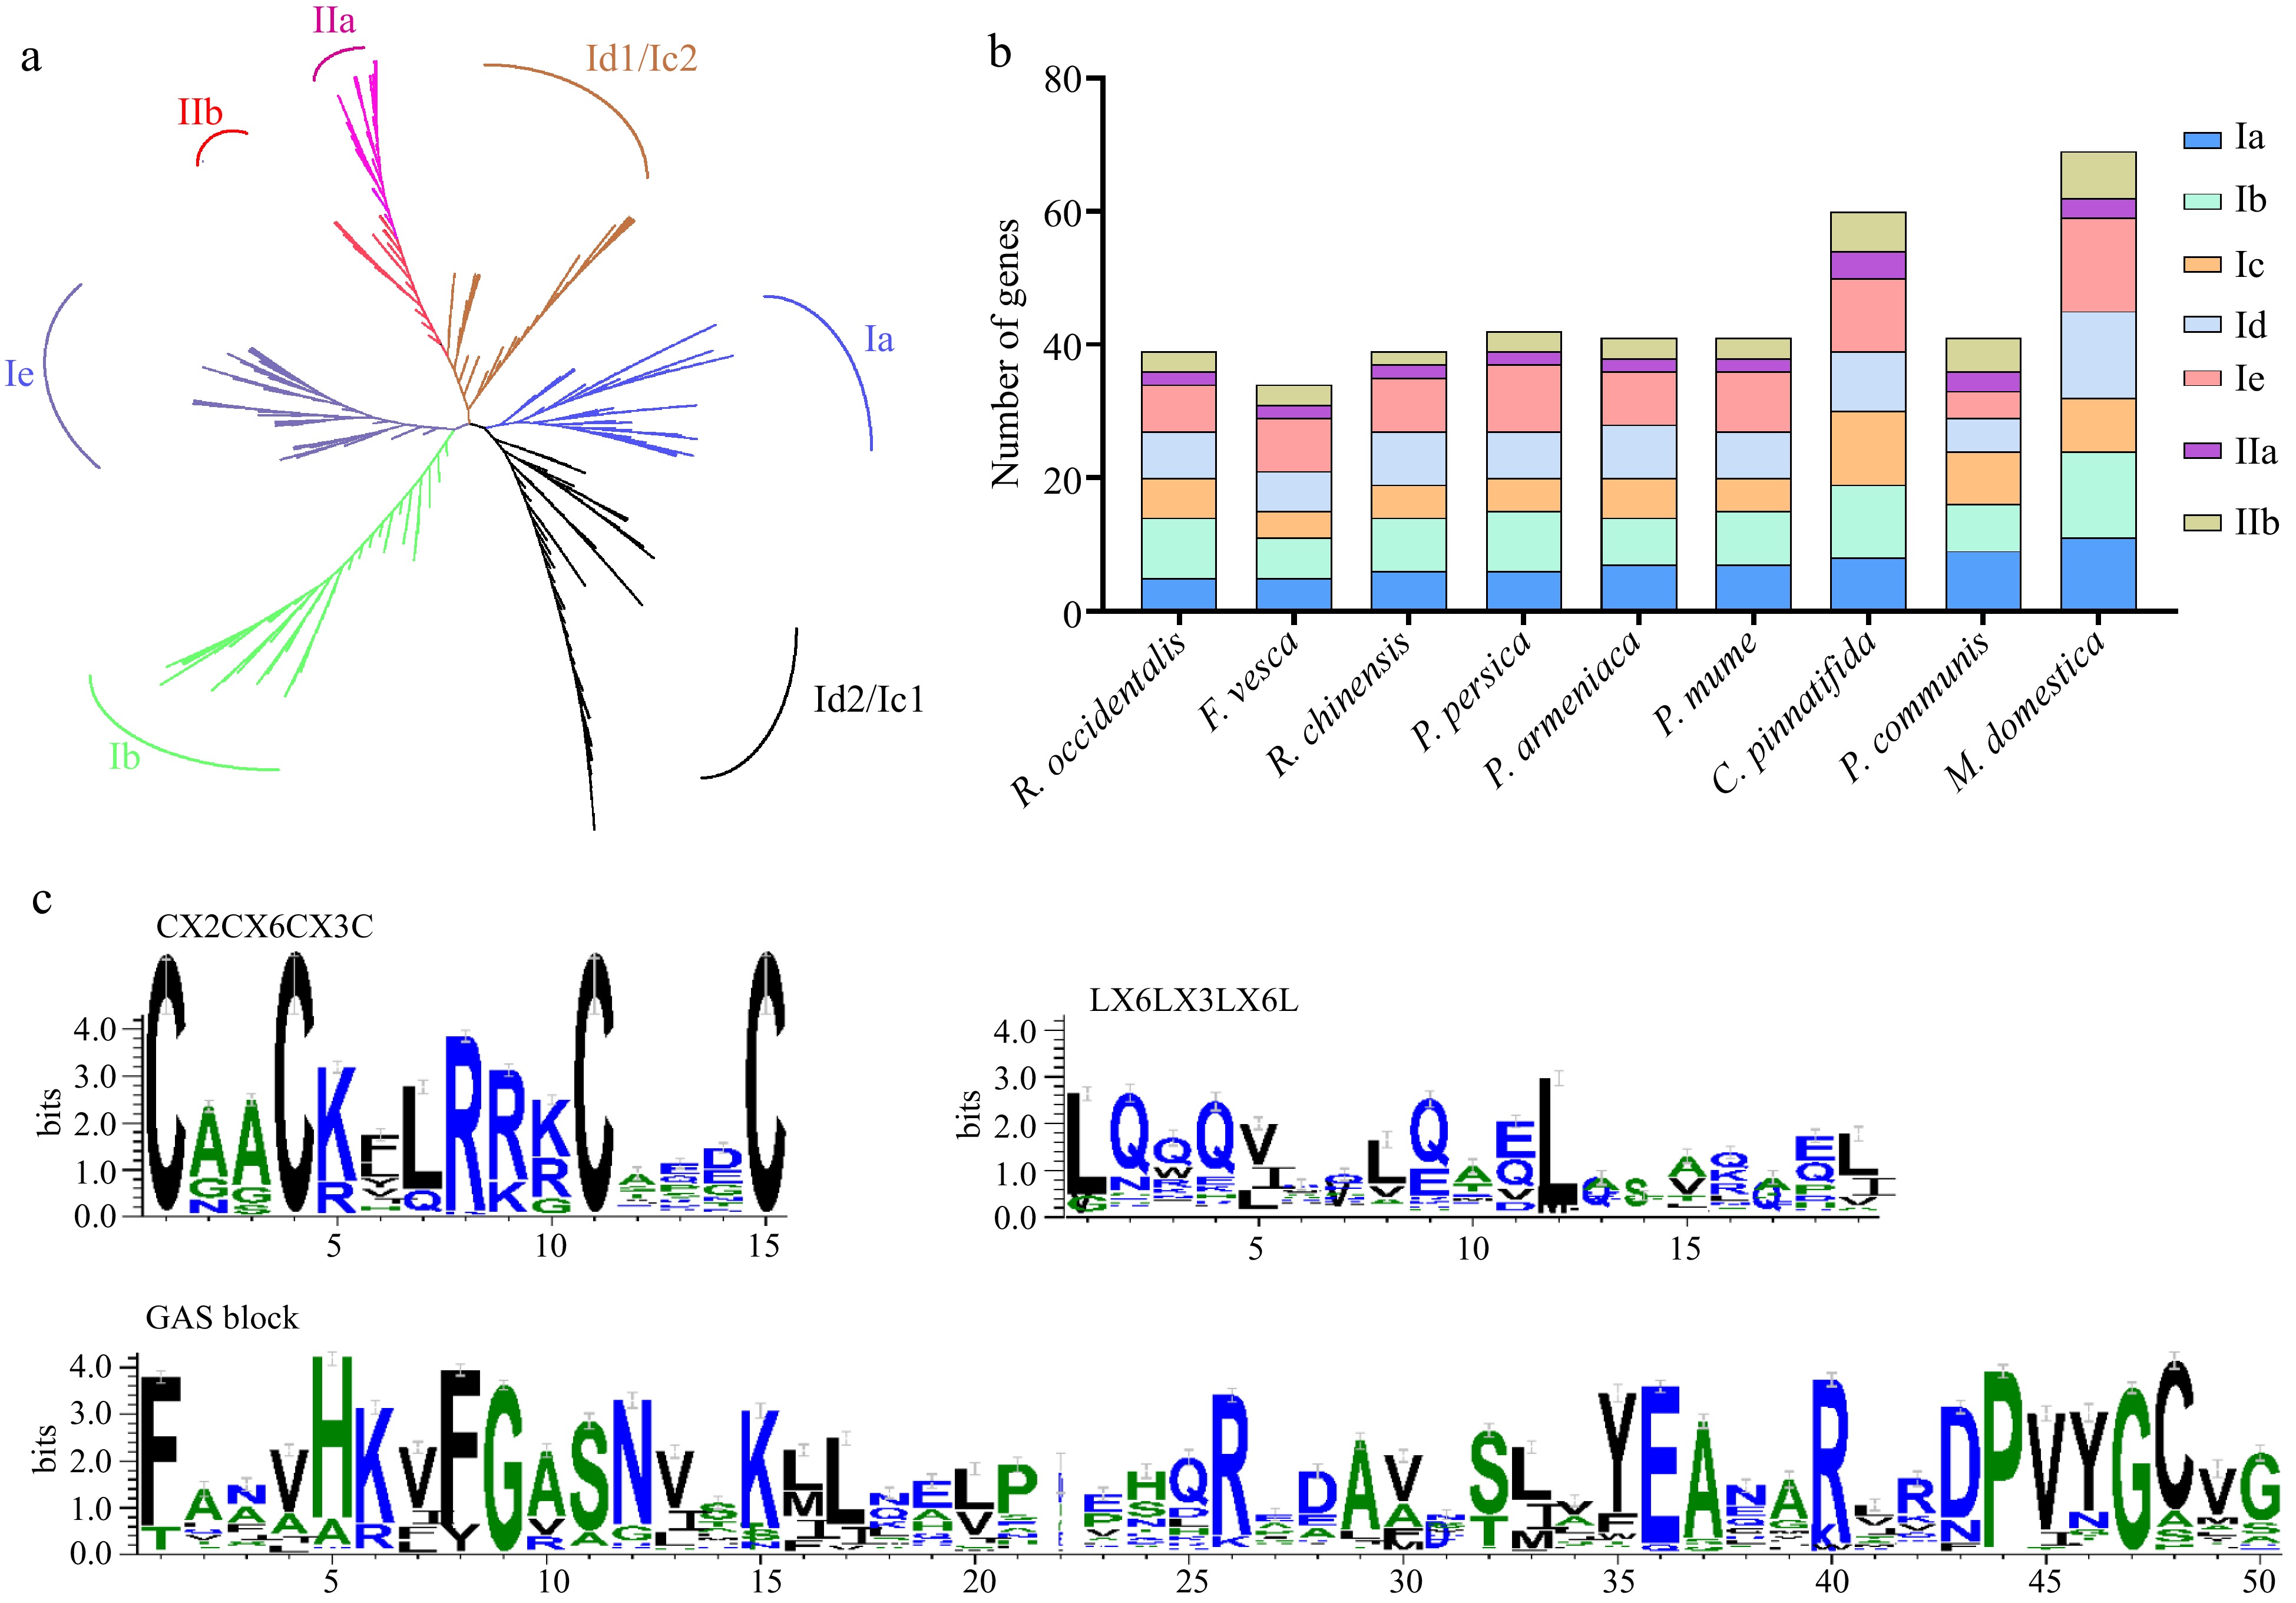
Figure 1.
Phylogenetic tree, conserved domains, and the gene numbers of the subfamily in nine Rosaceae species. (a) ML phylogenetic tree of LBD proteins in 11 plant genomes. (b) The number of genes identified in different classes of the LBD family. (c) Analysis of three conserved domains of LBD proteins in nine Rosaceae genomes.
-

Figure 2.
Phylogenetic evolutionary tree, motifs distributions, and domains of the subclass Ia subfamily members.
-
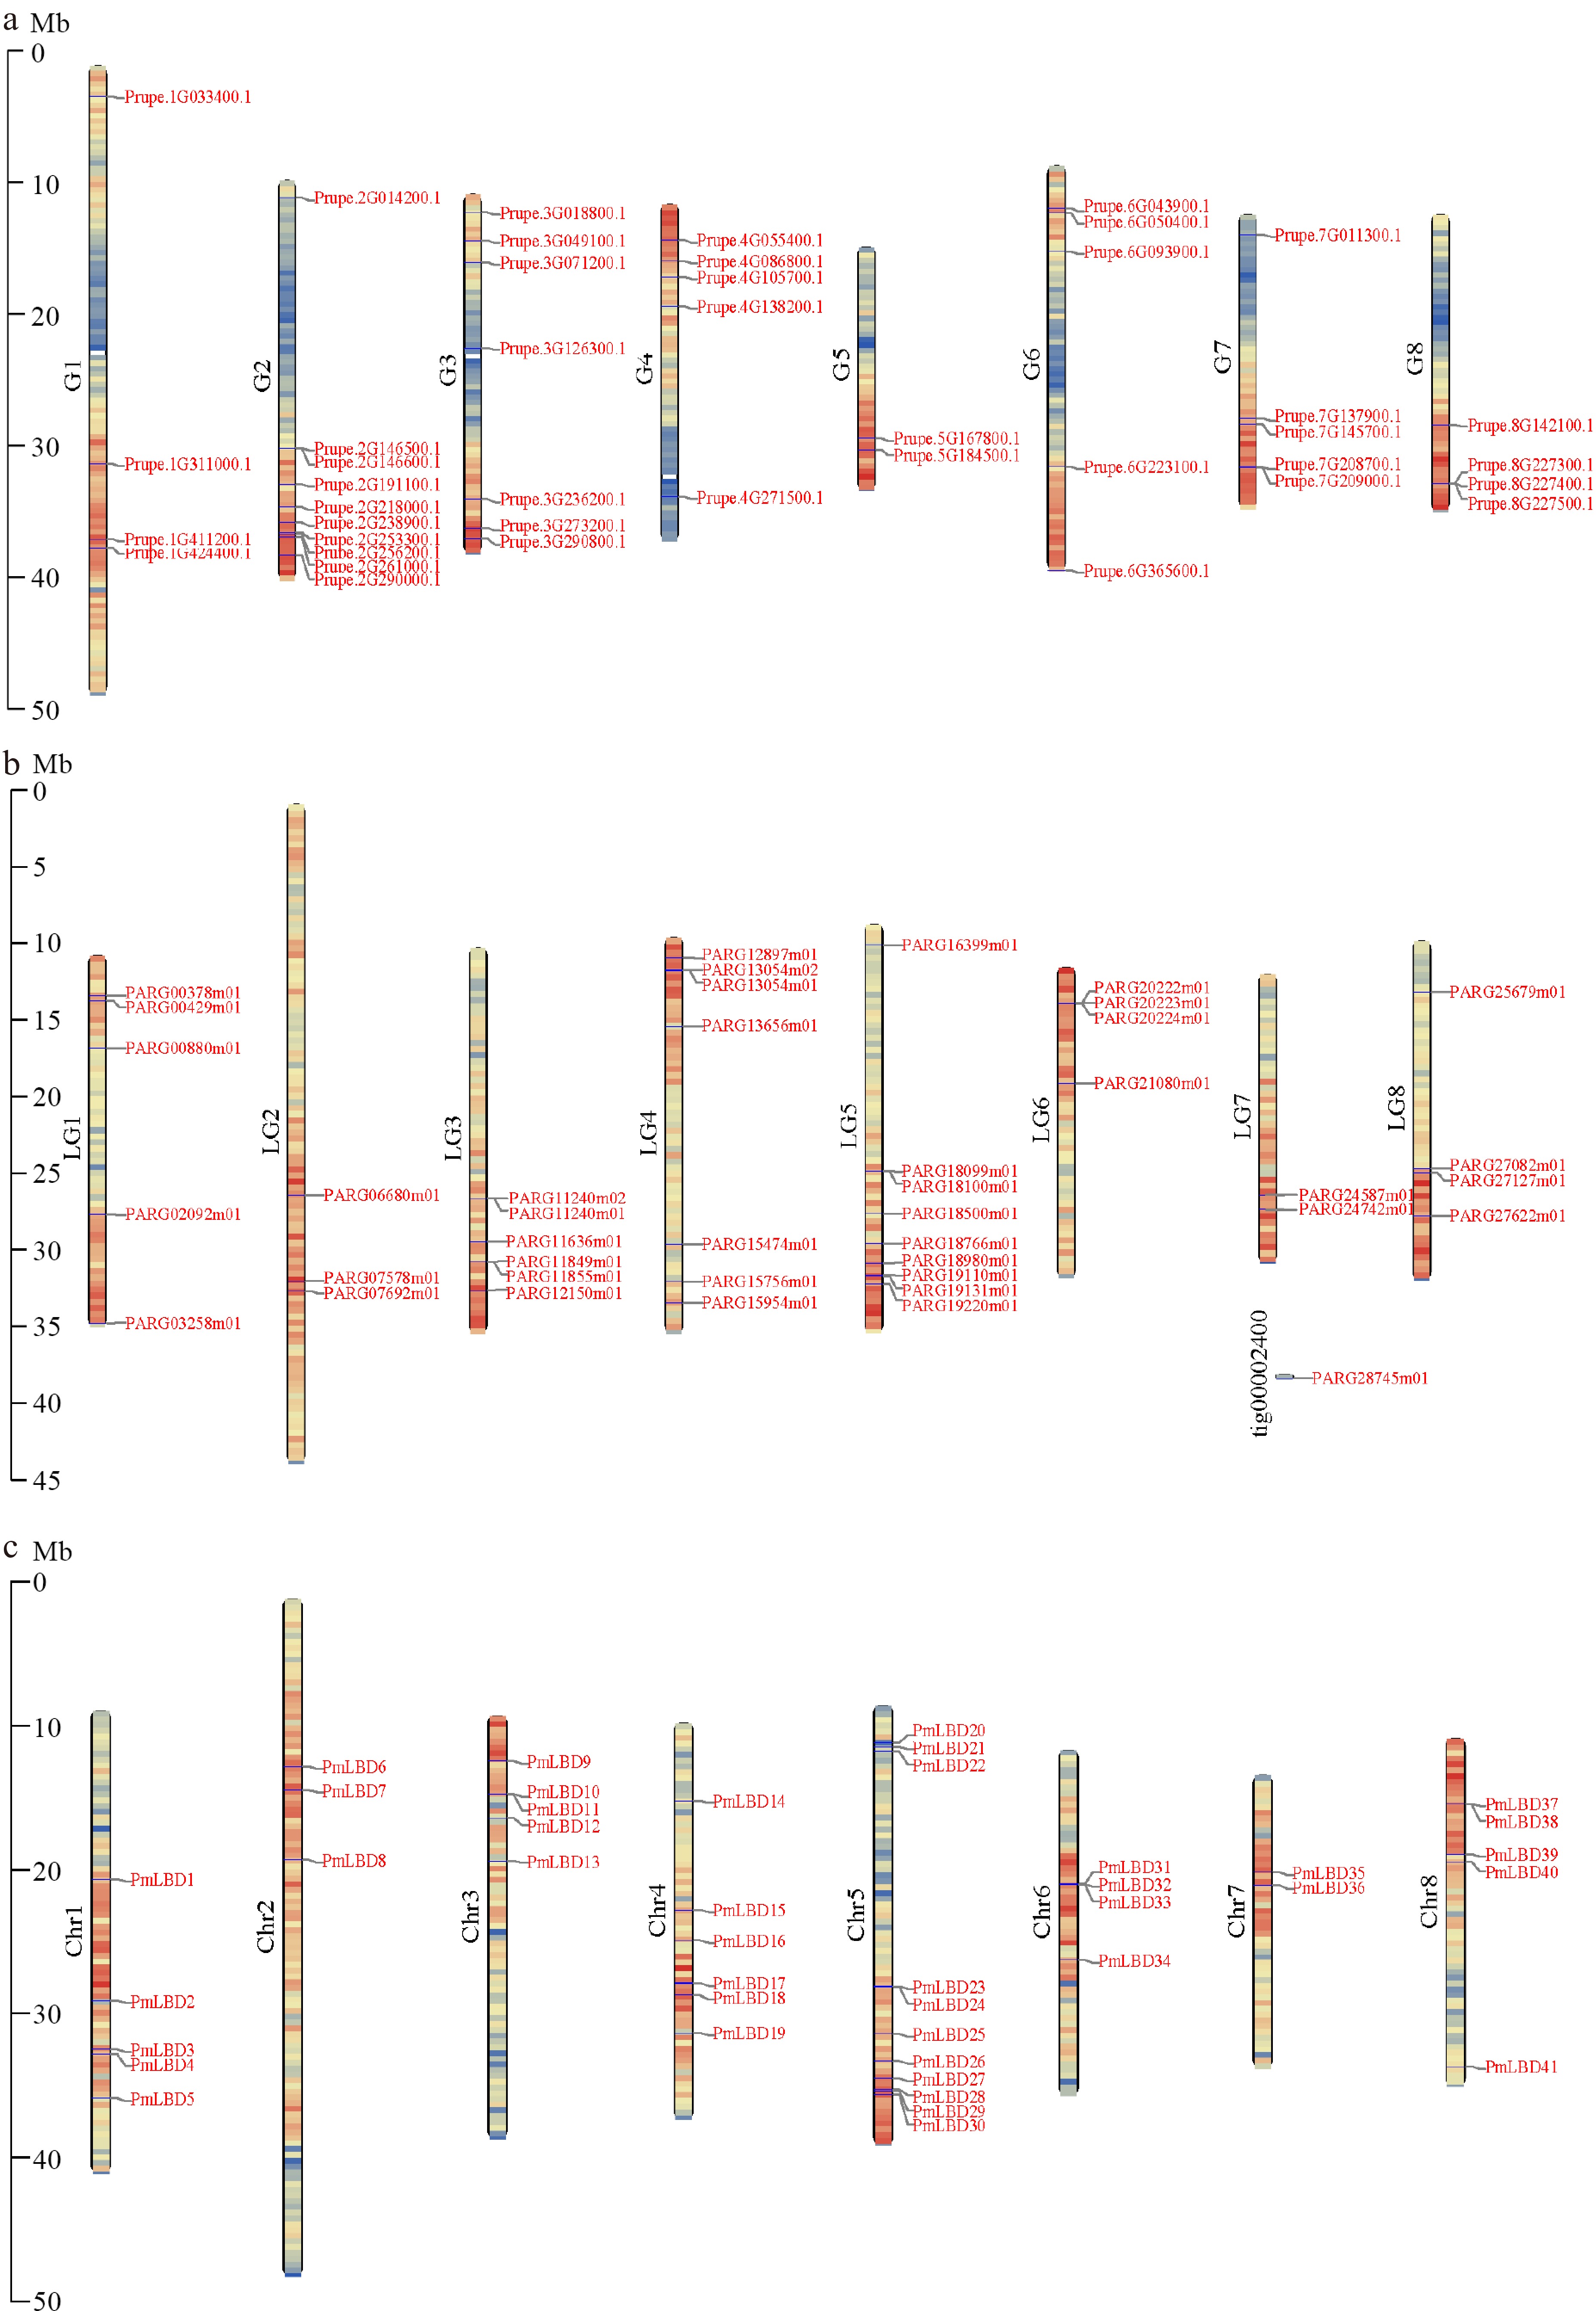
Figure 3.
Chromosome distribution of LBDs in the Amygdaloideae. (a) Chromosome distribution of LBDs in P. persica. (b) Chromosome distribution of LBDs in P. armeniaca. (c) Chromosome distribution of LBDs in P. mume.
-

Figure 4.
Collinearity of segmental duplication gene pairs of LBDs in six Rosaceae species. (a) Collinearity of segmental duplication gene pairs of LBDs in R. occidentalis. (b) Collinearity of segmental duplication gene pairs of LBDs in F. vesca. (c) Collinearity of segmental duplication gene pairs of LBDs in R. chinensis. (d) Collinearity of segmental duplication gene pairs of LBDs in P. persica. (e) Collinearity of segmental duplication gene pairs of LBDs in P. armeniaca. (f) Collinearity of segmental duplication gene pairs of LBDs in P. mume. The red lines represent the segment duplication (SD) gene pairs of the LBDs.
-
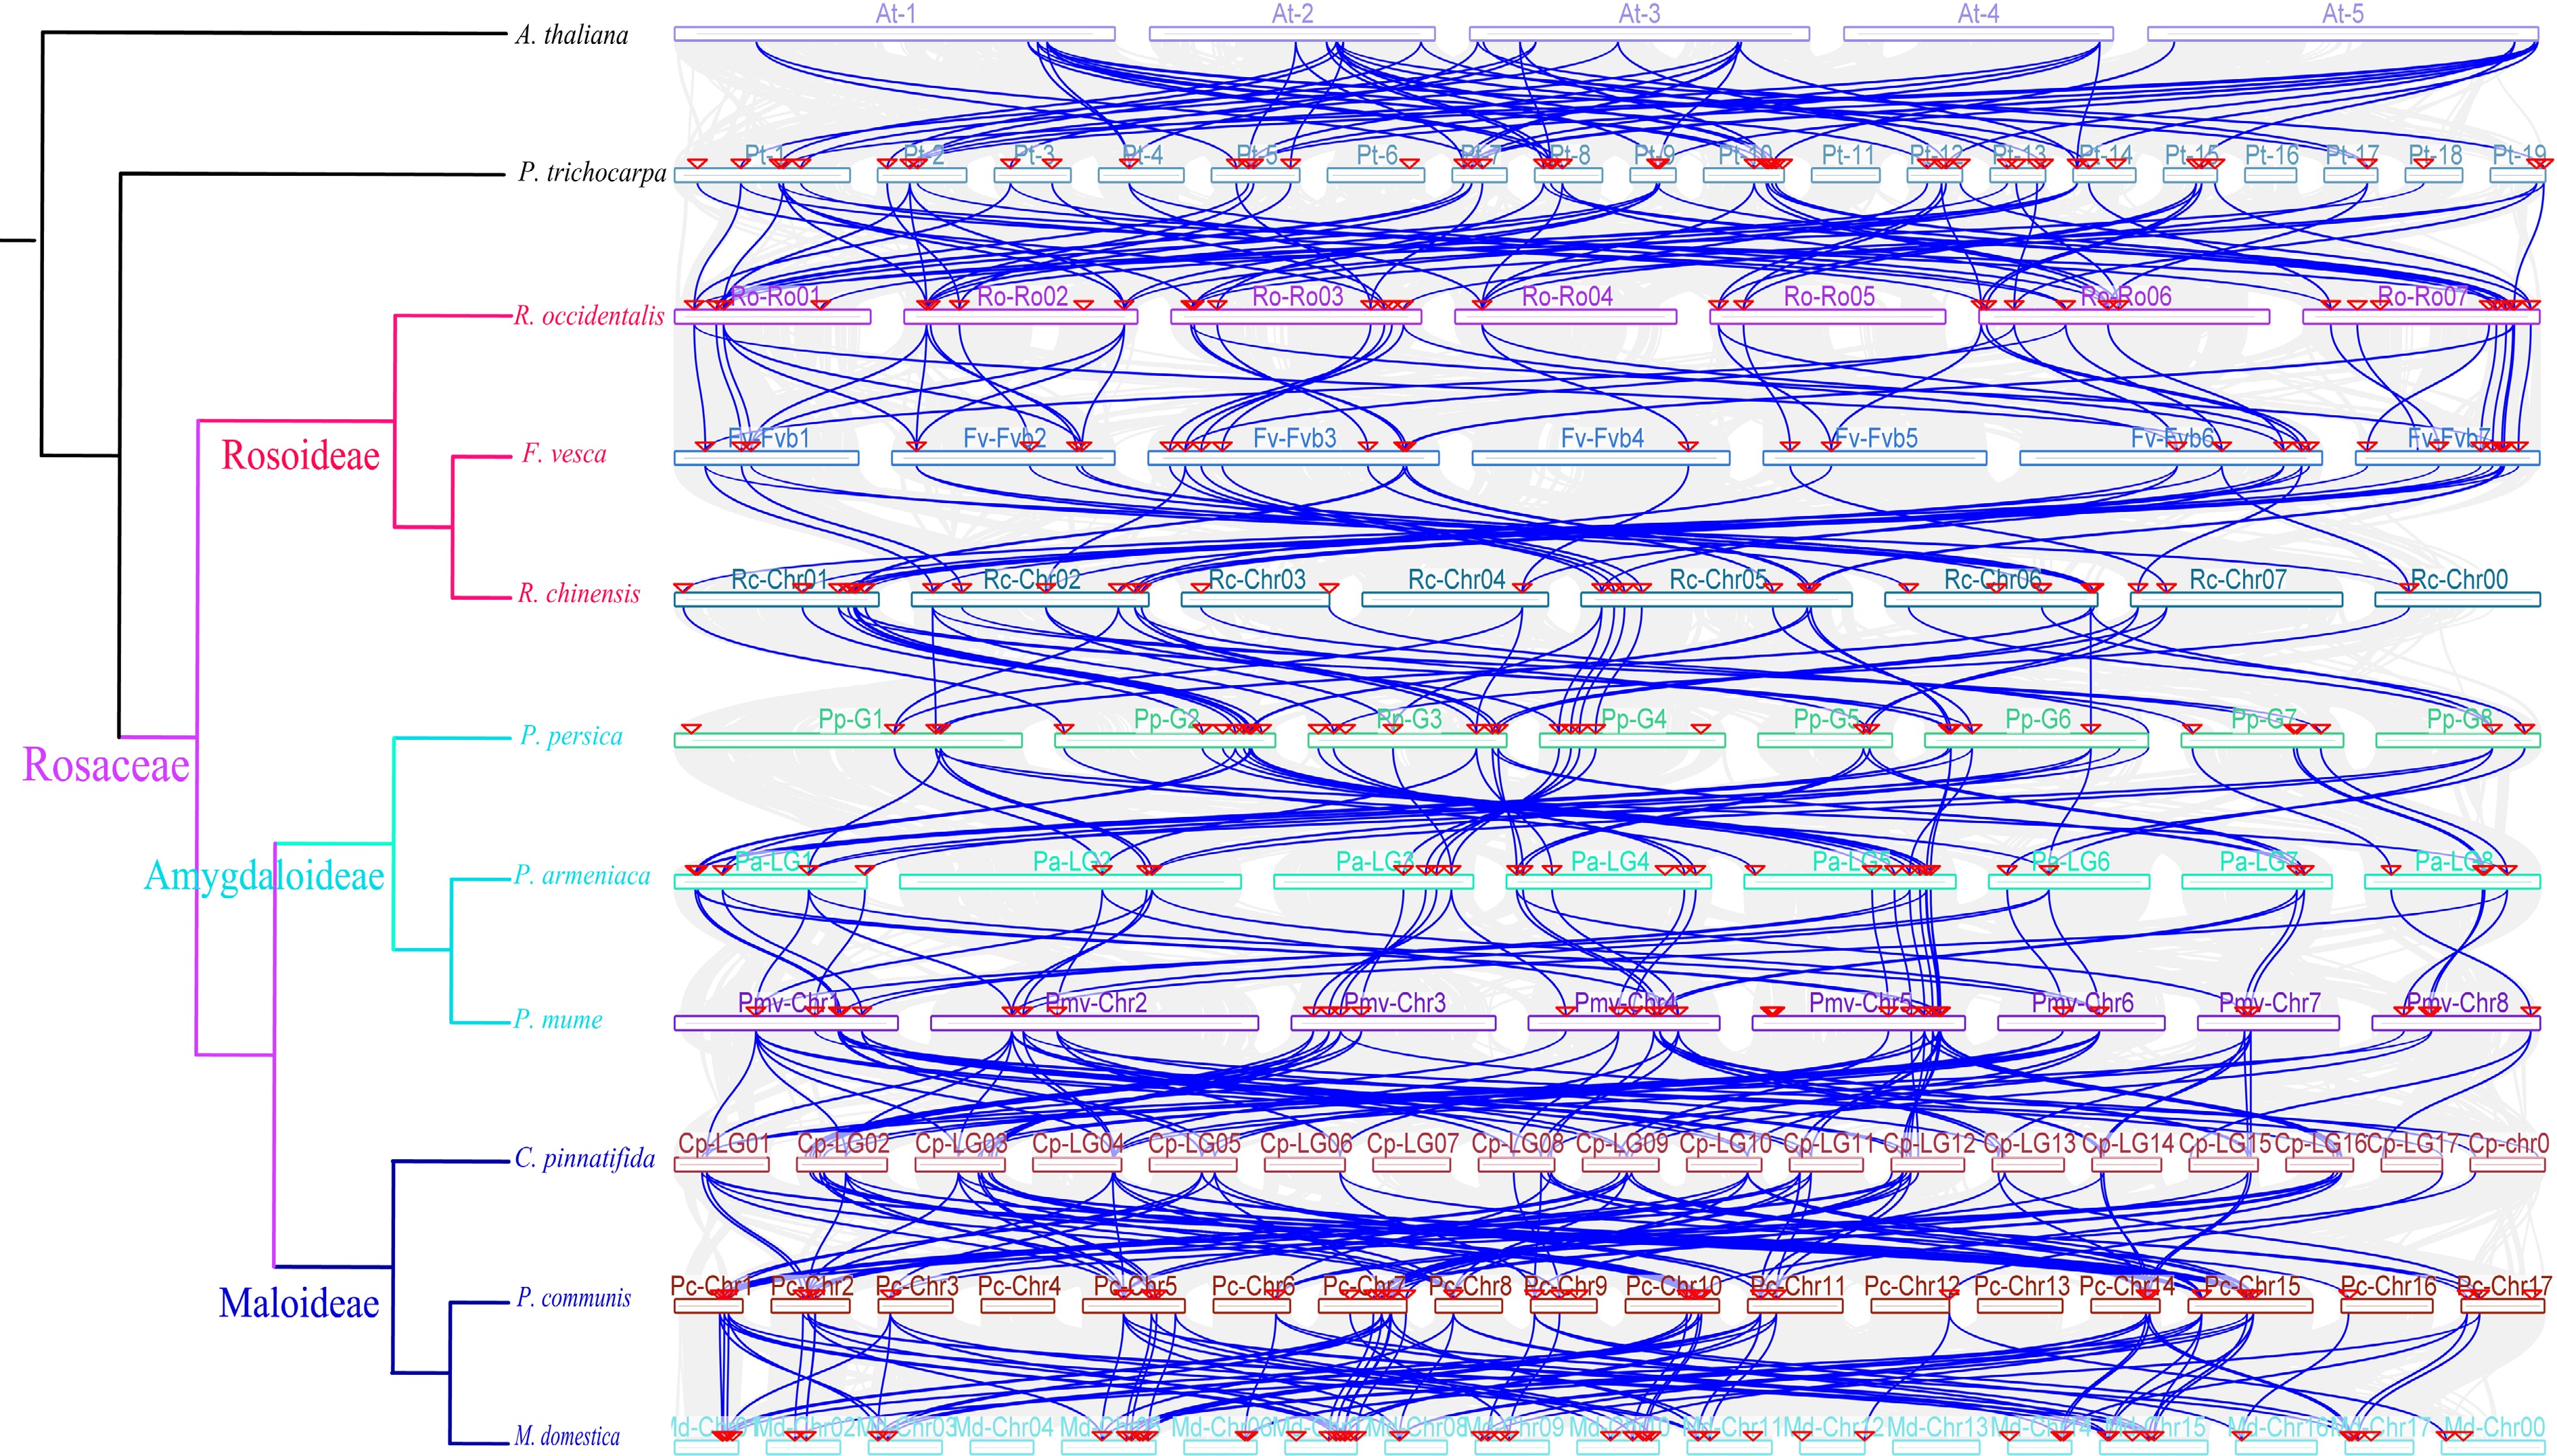
Figure 5.
Collinearity analysis of LBDs in different genomes. Colored circular rectangles denote the chromosomes of different plants. The green lines represent gene pairs with a collinear relationship. The grey lines represent other collinear gene pairs of non-LBD gene family members across genomes.
-
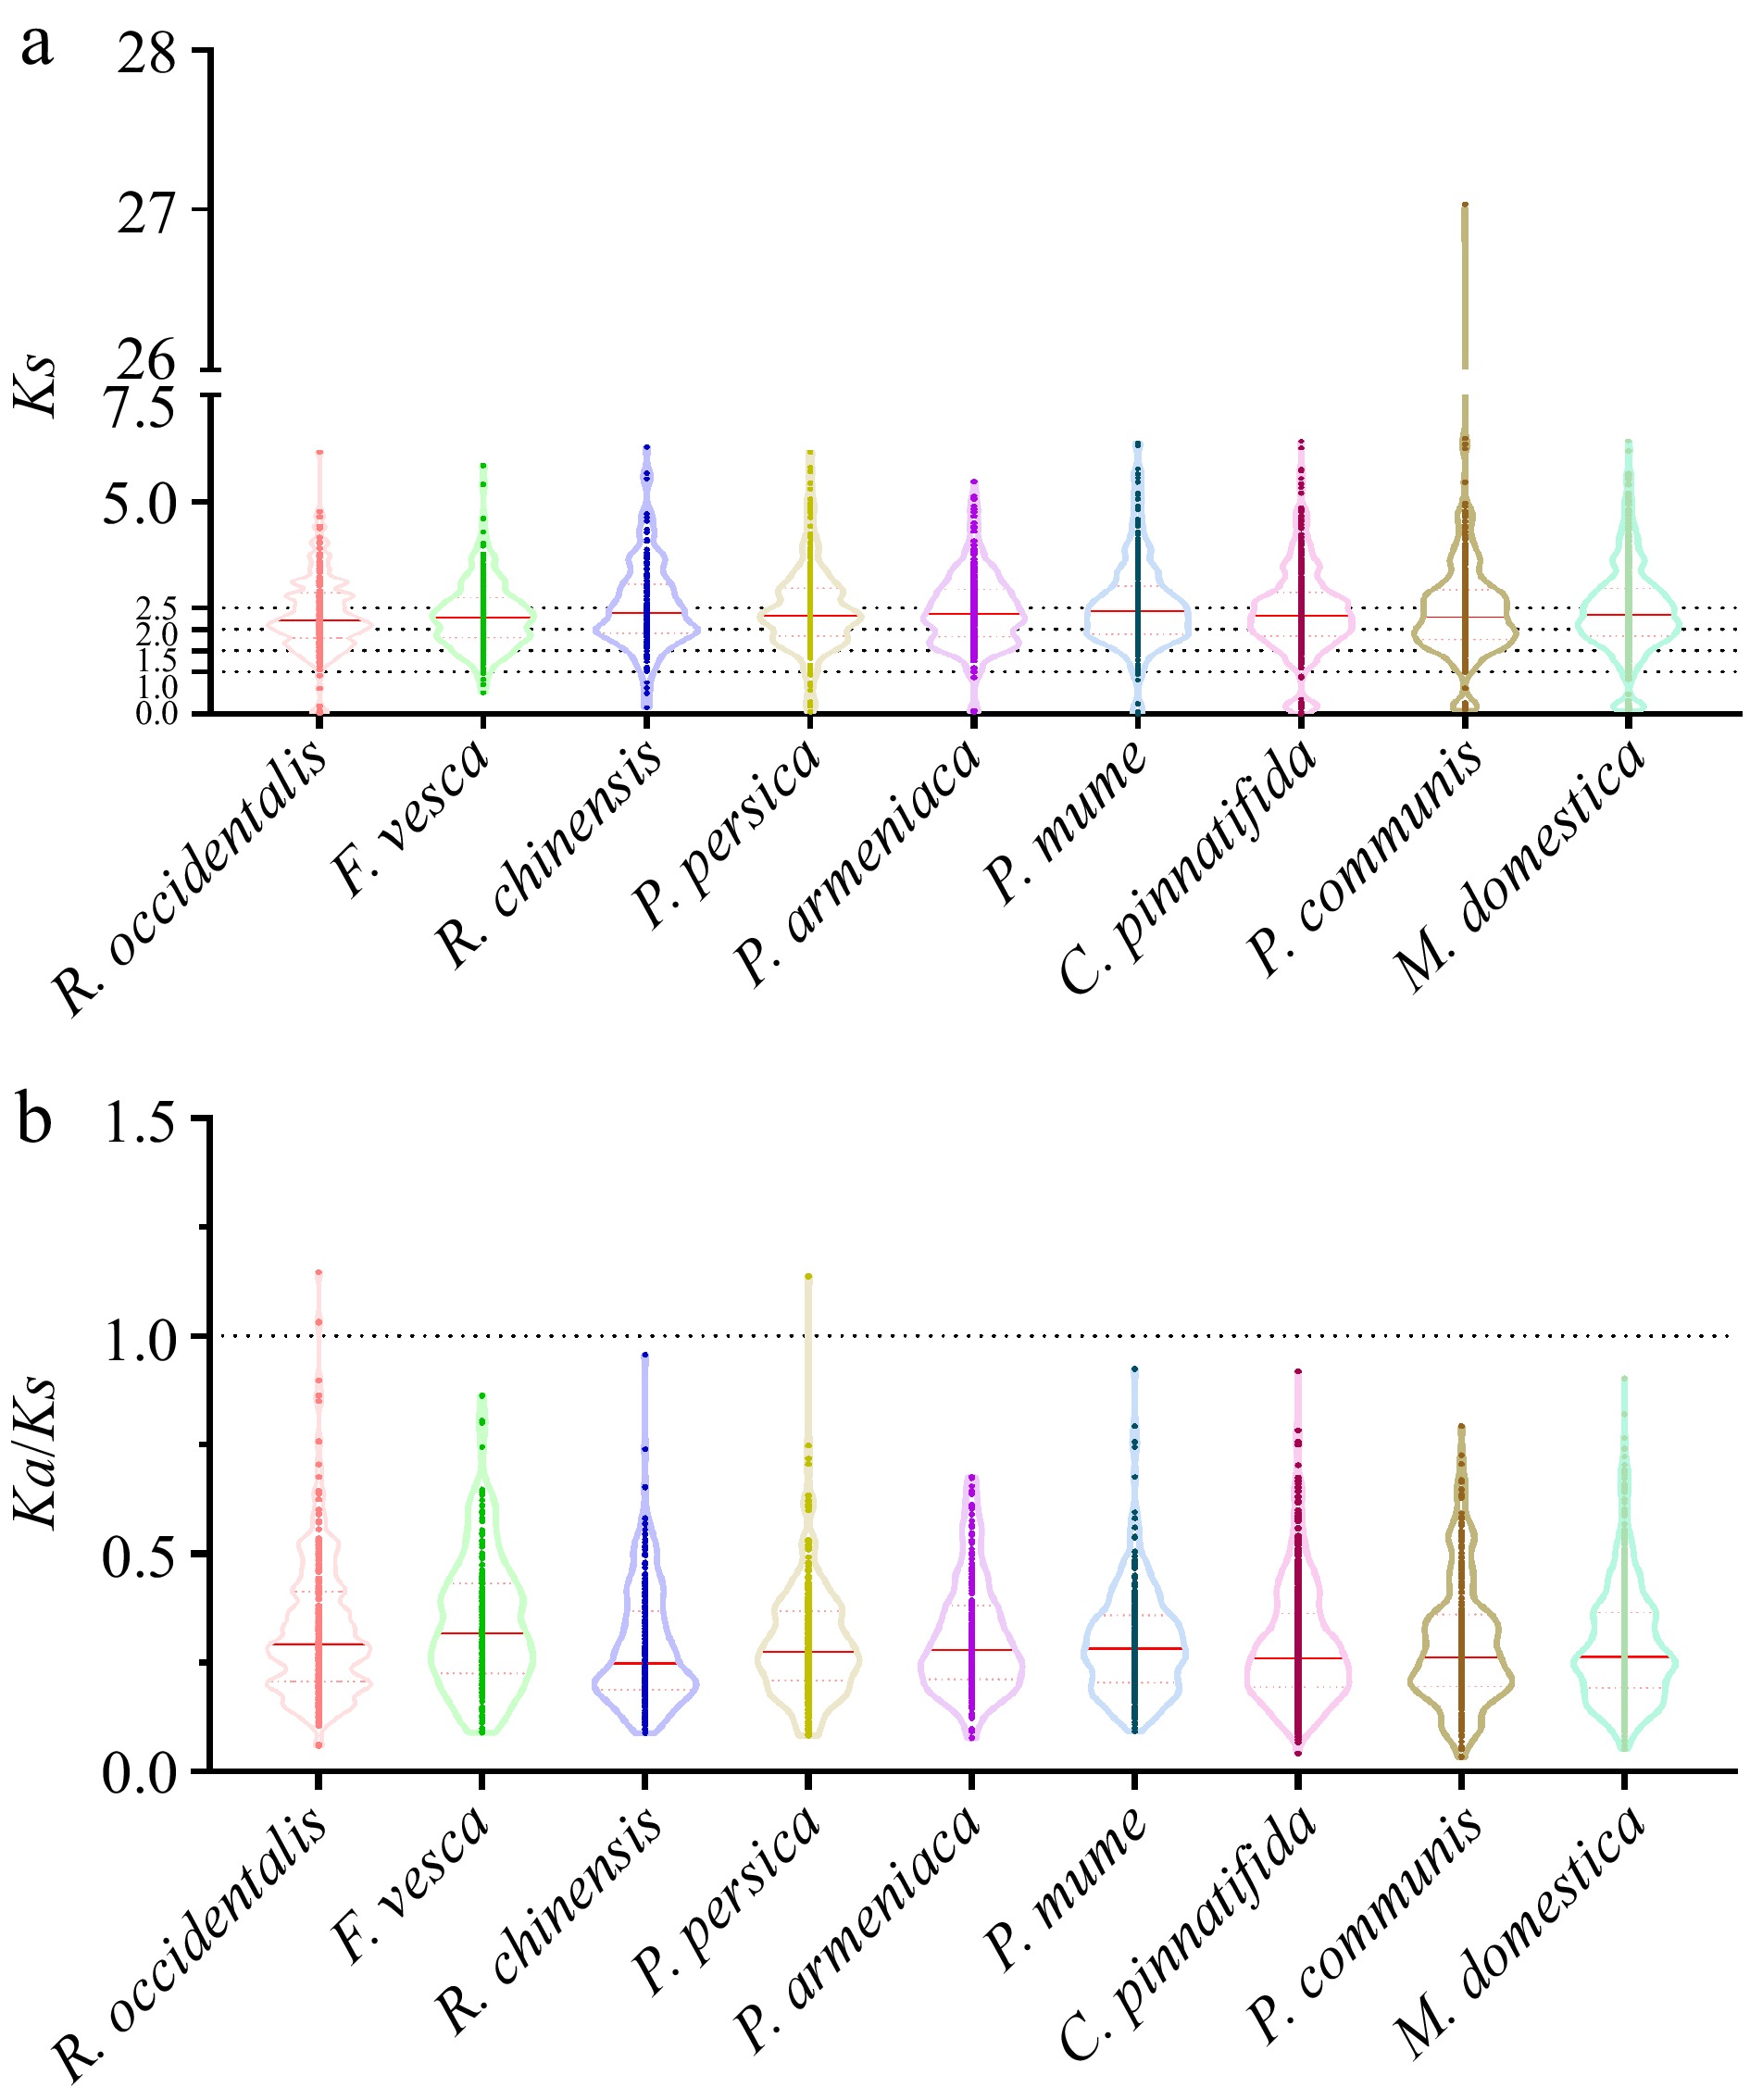
Figure 6.
The Ks and Ka/Ks values of LBDs in nine Rosaceae genomes. (a) The distribution of Ks values among LBDs in nine Rosaceae genomes. (b) The distribution of Ka/Ks values among LBDs in nine Rosaceae genomes.
-
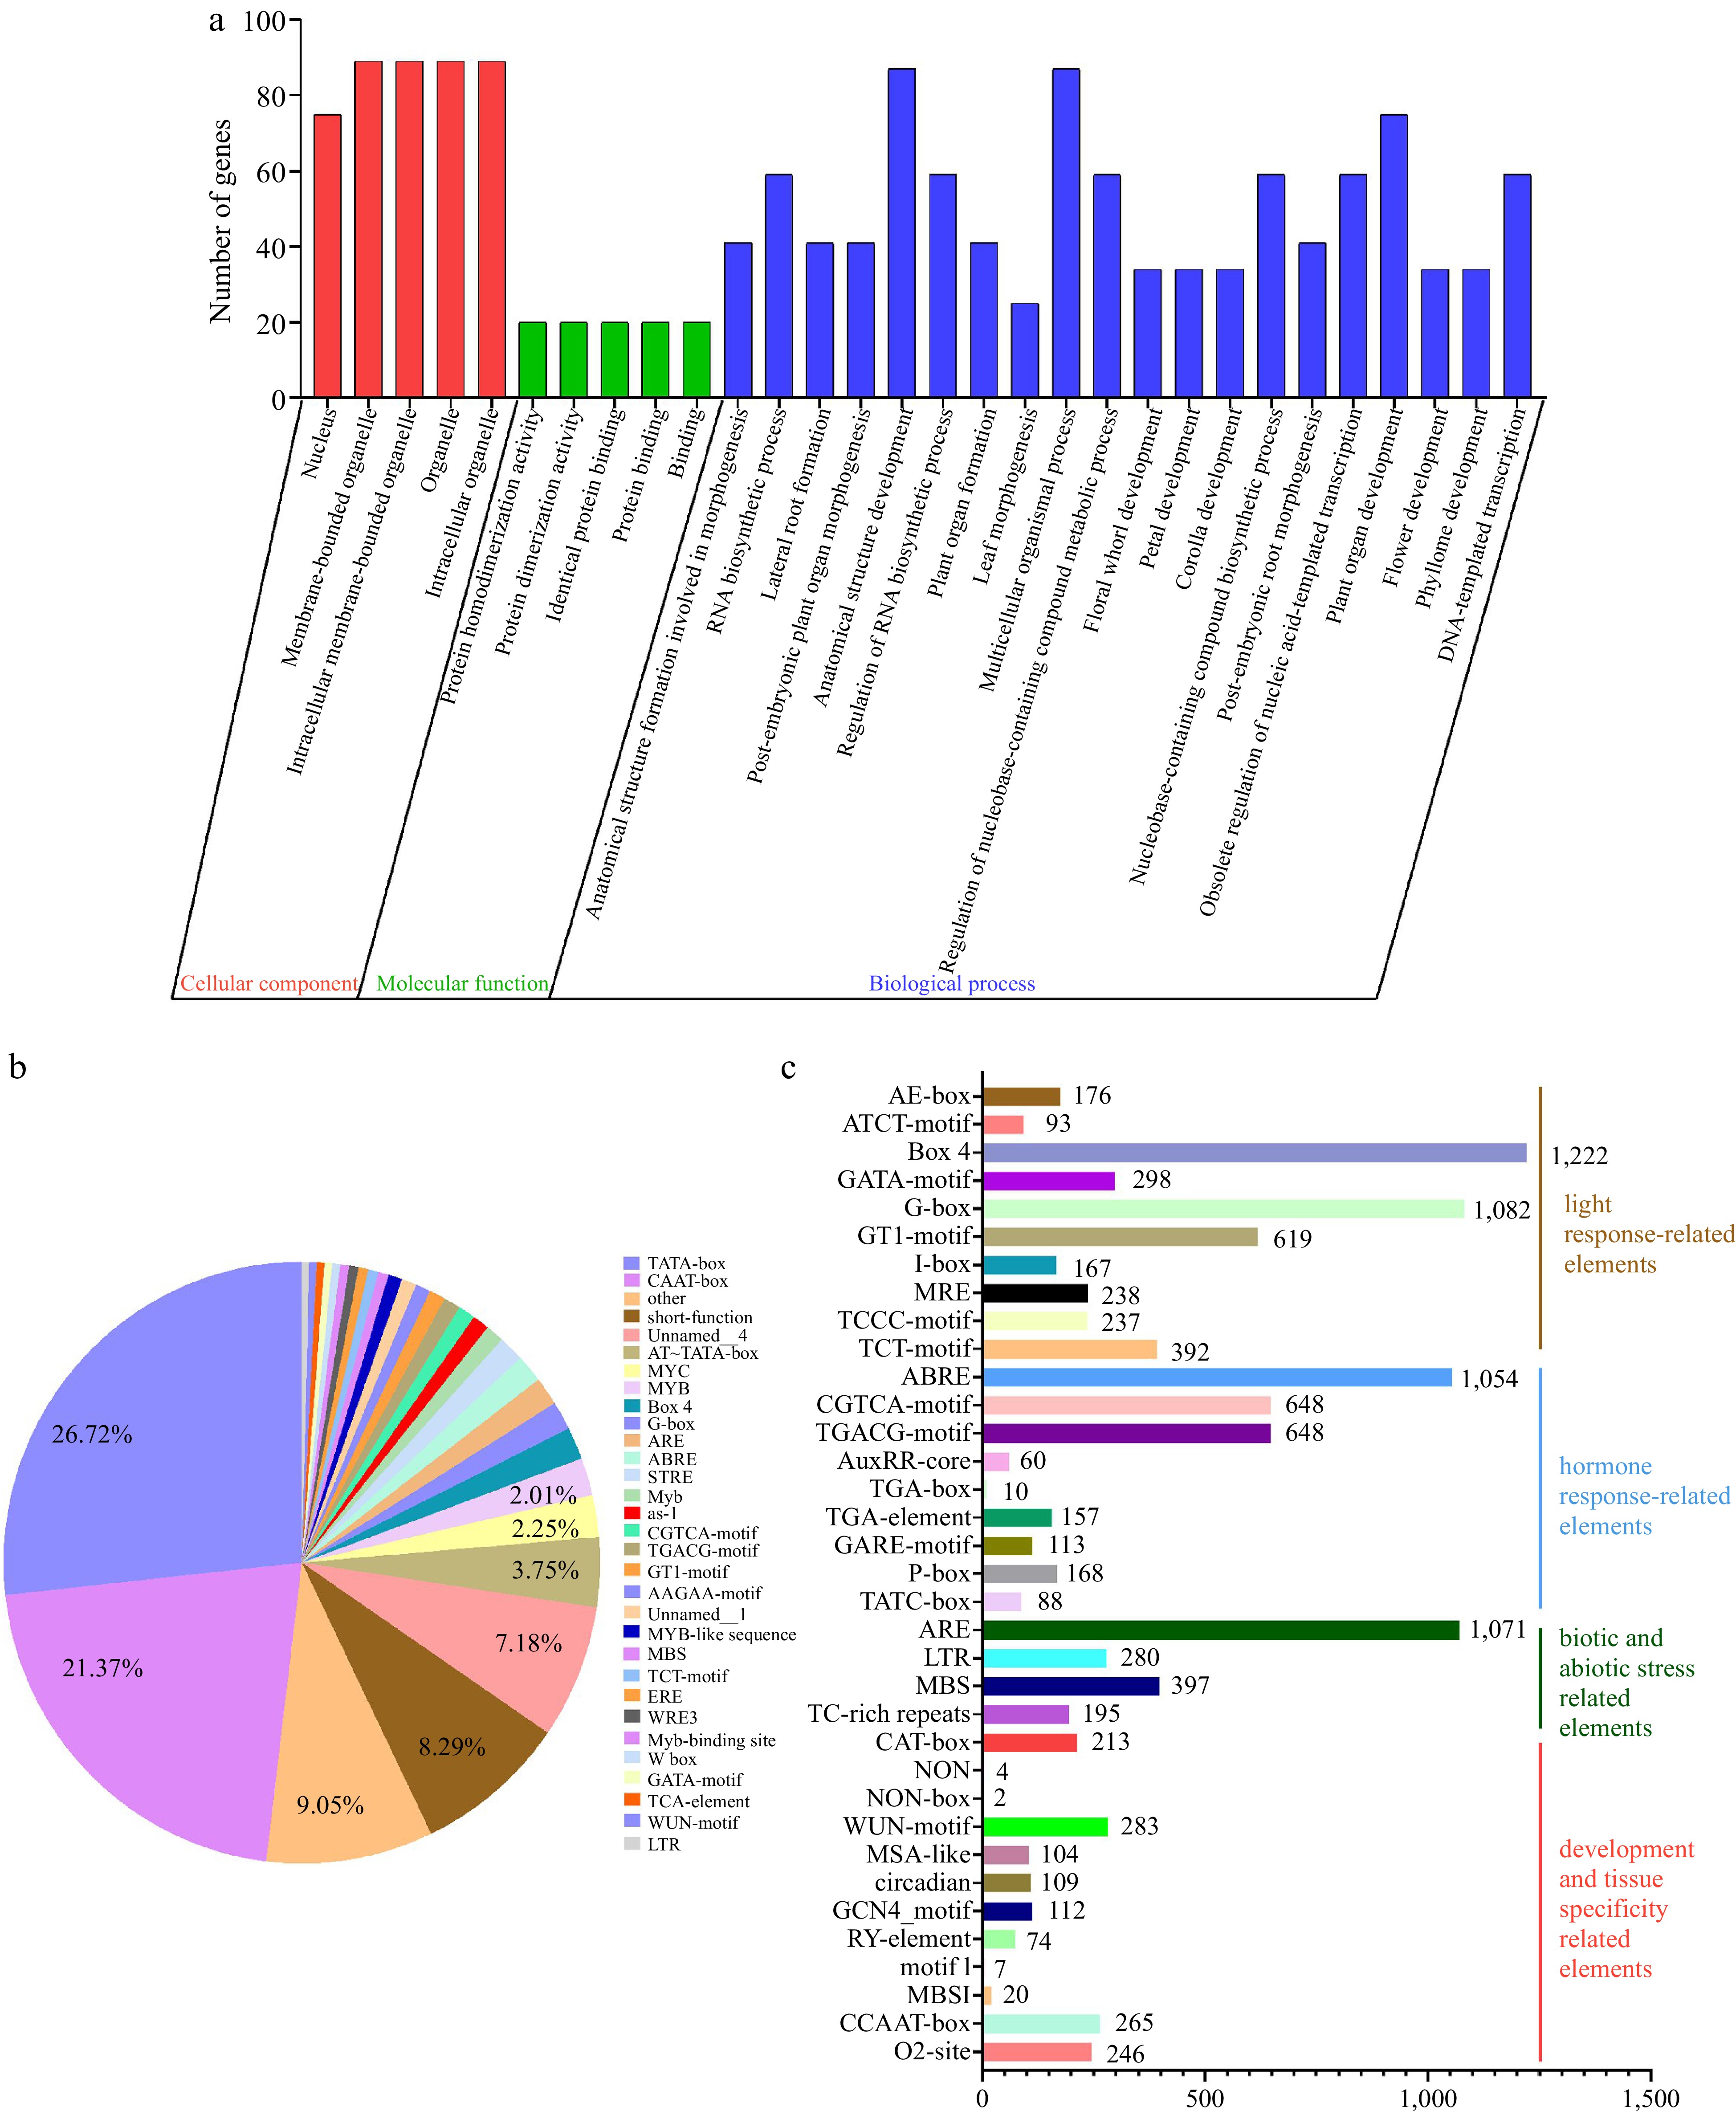
Figure 7.
GO and cis-elements analysis of LBDs in nine Rosaceae species. (a) GO analysis of LBDs in nine Rosaceae species. (b) The proportion of cis-elements predicted in the promoters of LBDs. (c) Numbers of the cis-elements involved in light response, hormone response, biotic and abiotic stress, development, and tissue specificity.
-

Figure 8.
Expression pattern of PmLBDs in different tissues and different developmental stages of flower buds. (a) Hierarchical clustering of expression profiles of PmLBDs in different tissues (bud, fruit, leaf, root, and stem). (b) Expression profiles of PmLBDs in the flower bud during dormancy release.
-

Figure 9.
Expression pattern of PmLBDs in different locations and seasons. (a) Hierarchical clustering of expression profiles of PmLBDs in different locations. (b) Hierarchical clustering of expression profiles of PmLBDs in different seasons. BJ, Beijing; CF, Chifeng; GZL, Gongzhuling.
-

Figure 10.
Expression pattern of PmLBDs in upright and weeping branches. U1−U8, eight developmental stages of upright branches in the mei F1 population; W1−W8, eight developmental stages of weeping branches in the mei F1 population.
-
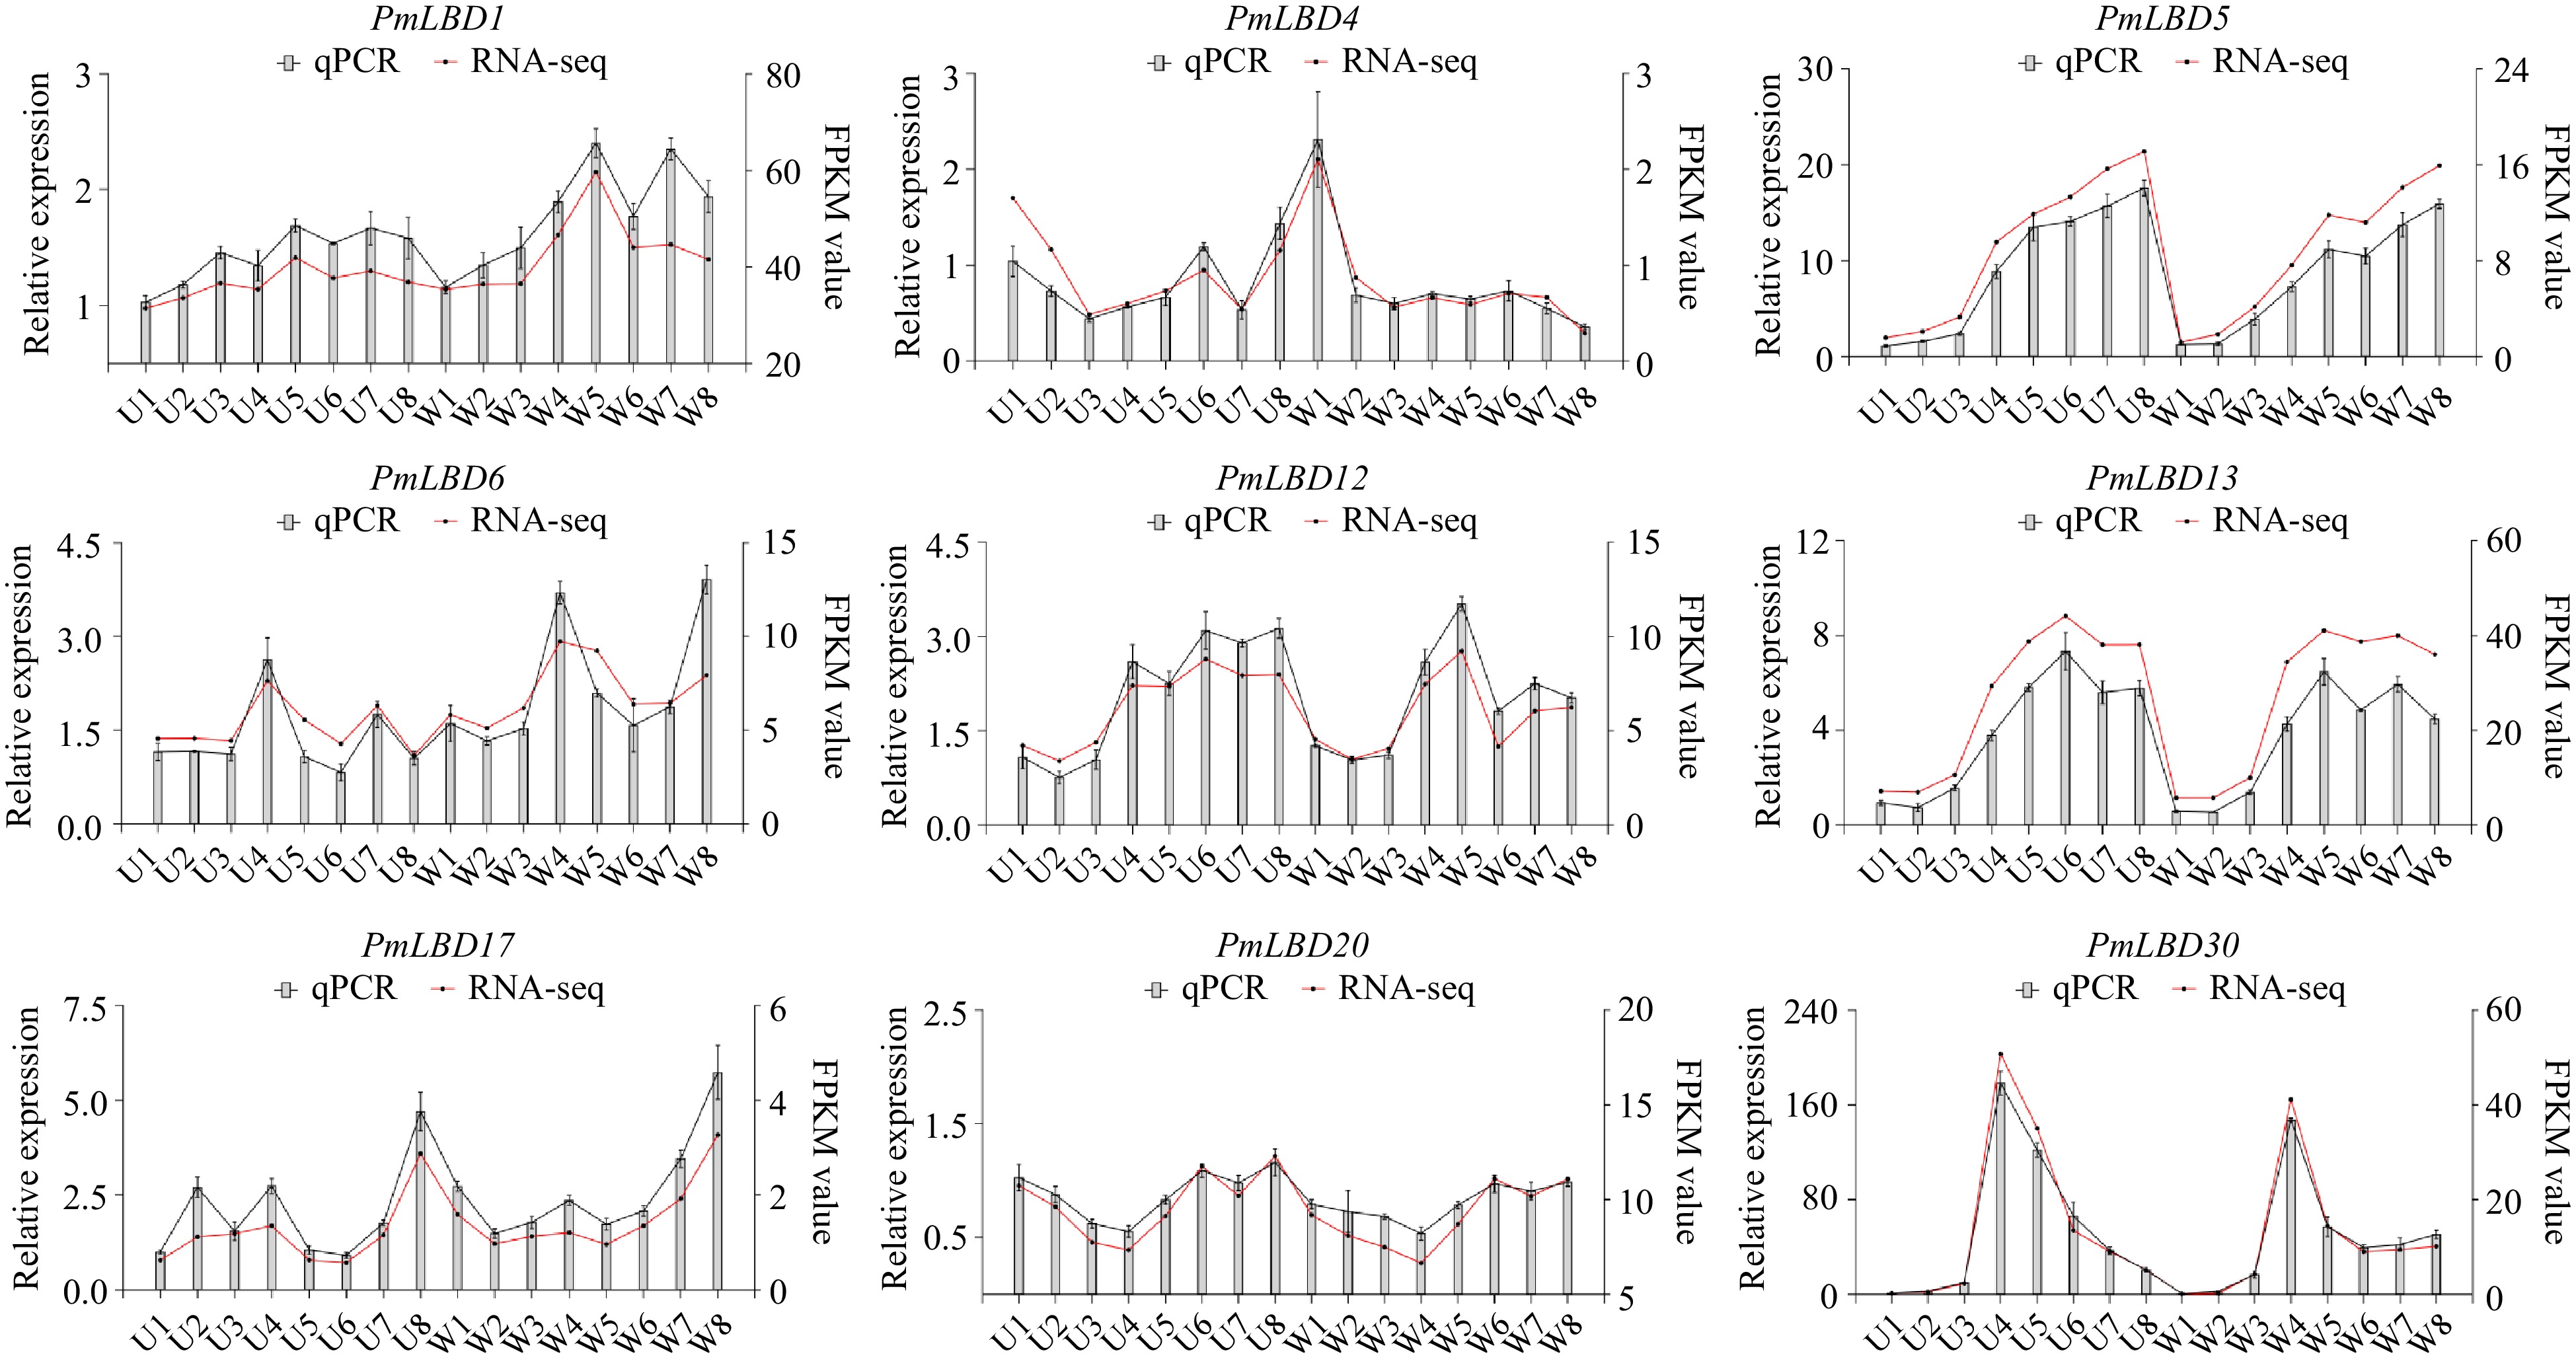
Figure 11.
qRT-PCR analysis of nine PmLBDs in upright and weeping branches. U1−U8, eight developmental stages of upright branches in the mei F1 population; W1−W8, eight developmental stages of weeping branches in the mei F1 population. The relative quantification method (2−ΔΔCᴛ) was used to evaluate quantitative variation. Error bars represent standard error for three replicates.
-
Traditional subfamily Genus name Common name Species name Chromosome number Genome gene number Identified LBDs Proportion
of LBDsRosoideae Rubus Black raspberry Rubus occidentalis 8 33,286 39 0.12% Fragaria Strawberry Fragaria vesca 7 28,588 34 0.12% Rosa Chinese rose Rosa chinensis 7 39,669 39 0.10% Amygdaloideae Prunus Peach Prunus persica 8 47,089 42 0.09% Prunus Apricot Prunus armeniaca 8 30,436 41 0.13% Prunus Mei Prunus mume var. tortuosa 8 26,015 41 0.16% Maloideae Crataegus Hawthorn Crataegus pinnatifida 17 40,571 60 0.15% Pyrus European pear Pyrus communis 17 37,445 41 0.11% Malus Apple Malus domestica 'HFTH1' 17 44,677 69 0.15% Table 1.
Number of LBDs in nine Rosaceae species.
Figures
(11)
Tables
(1)