-
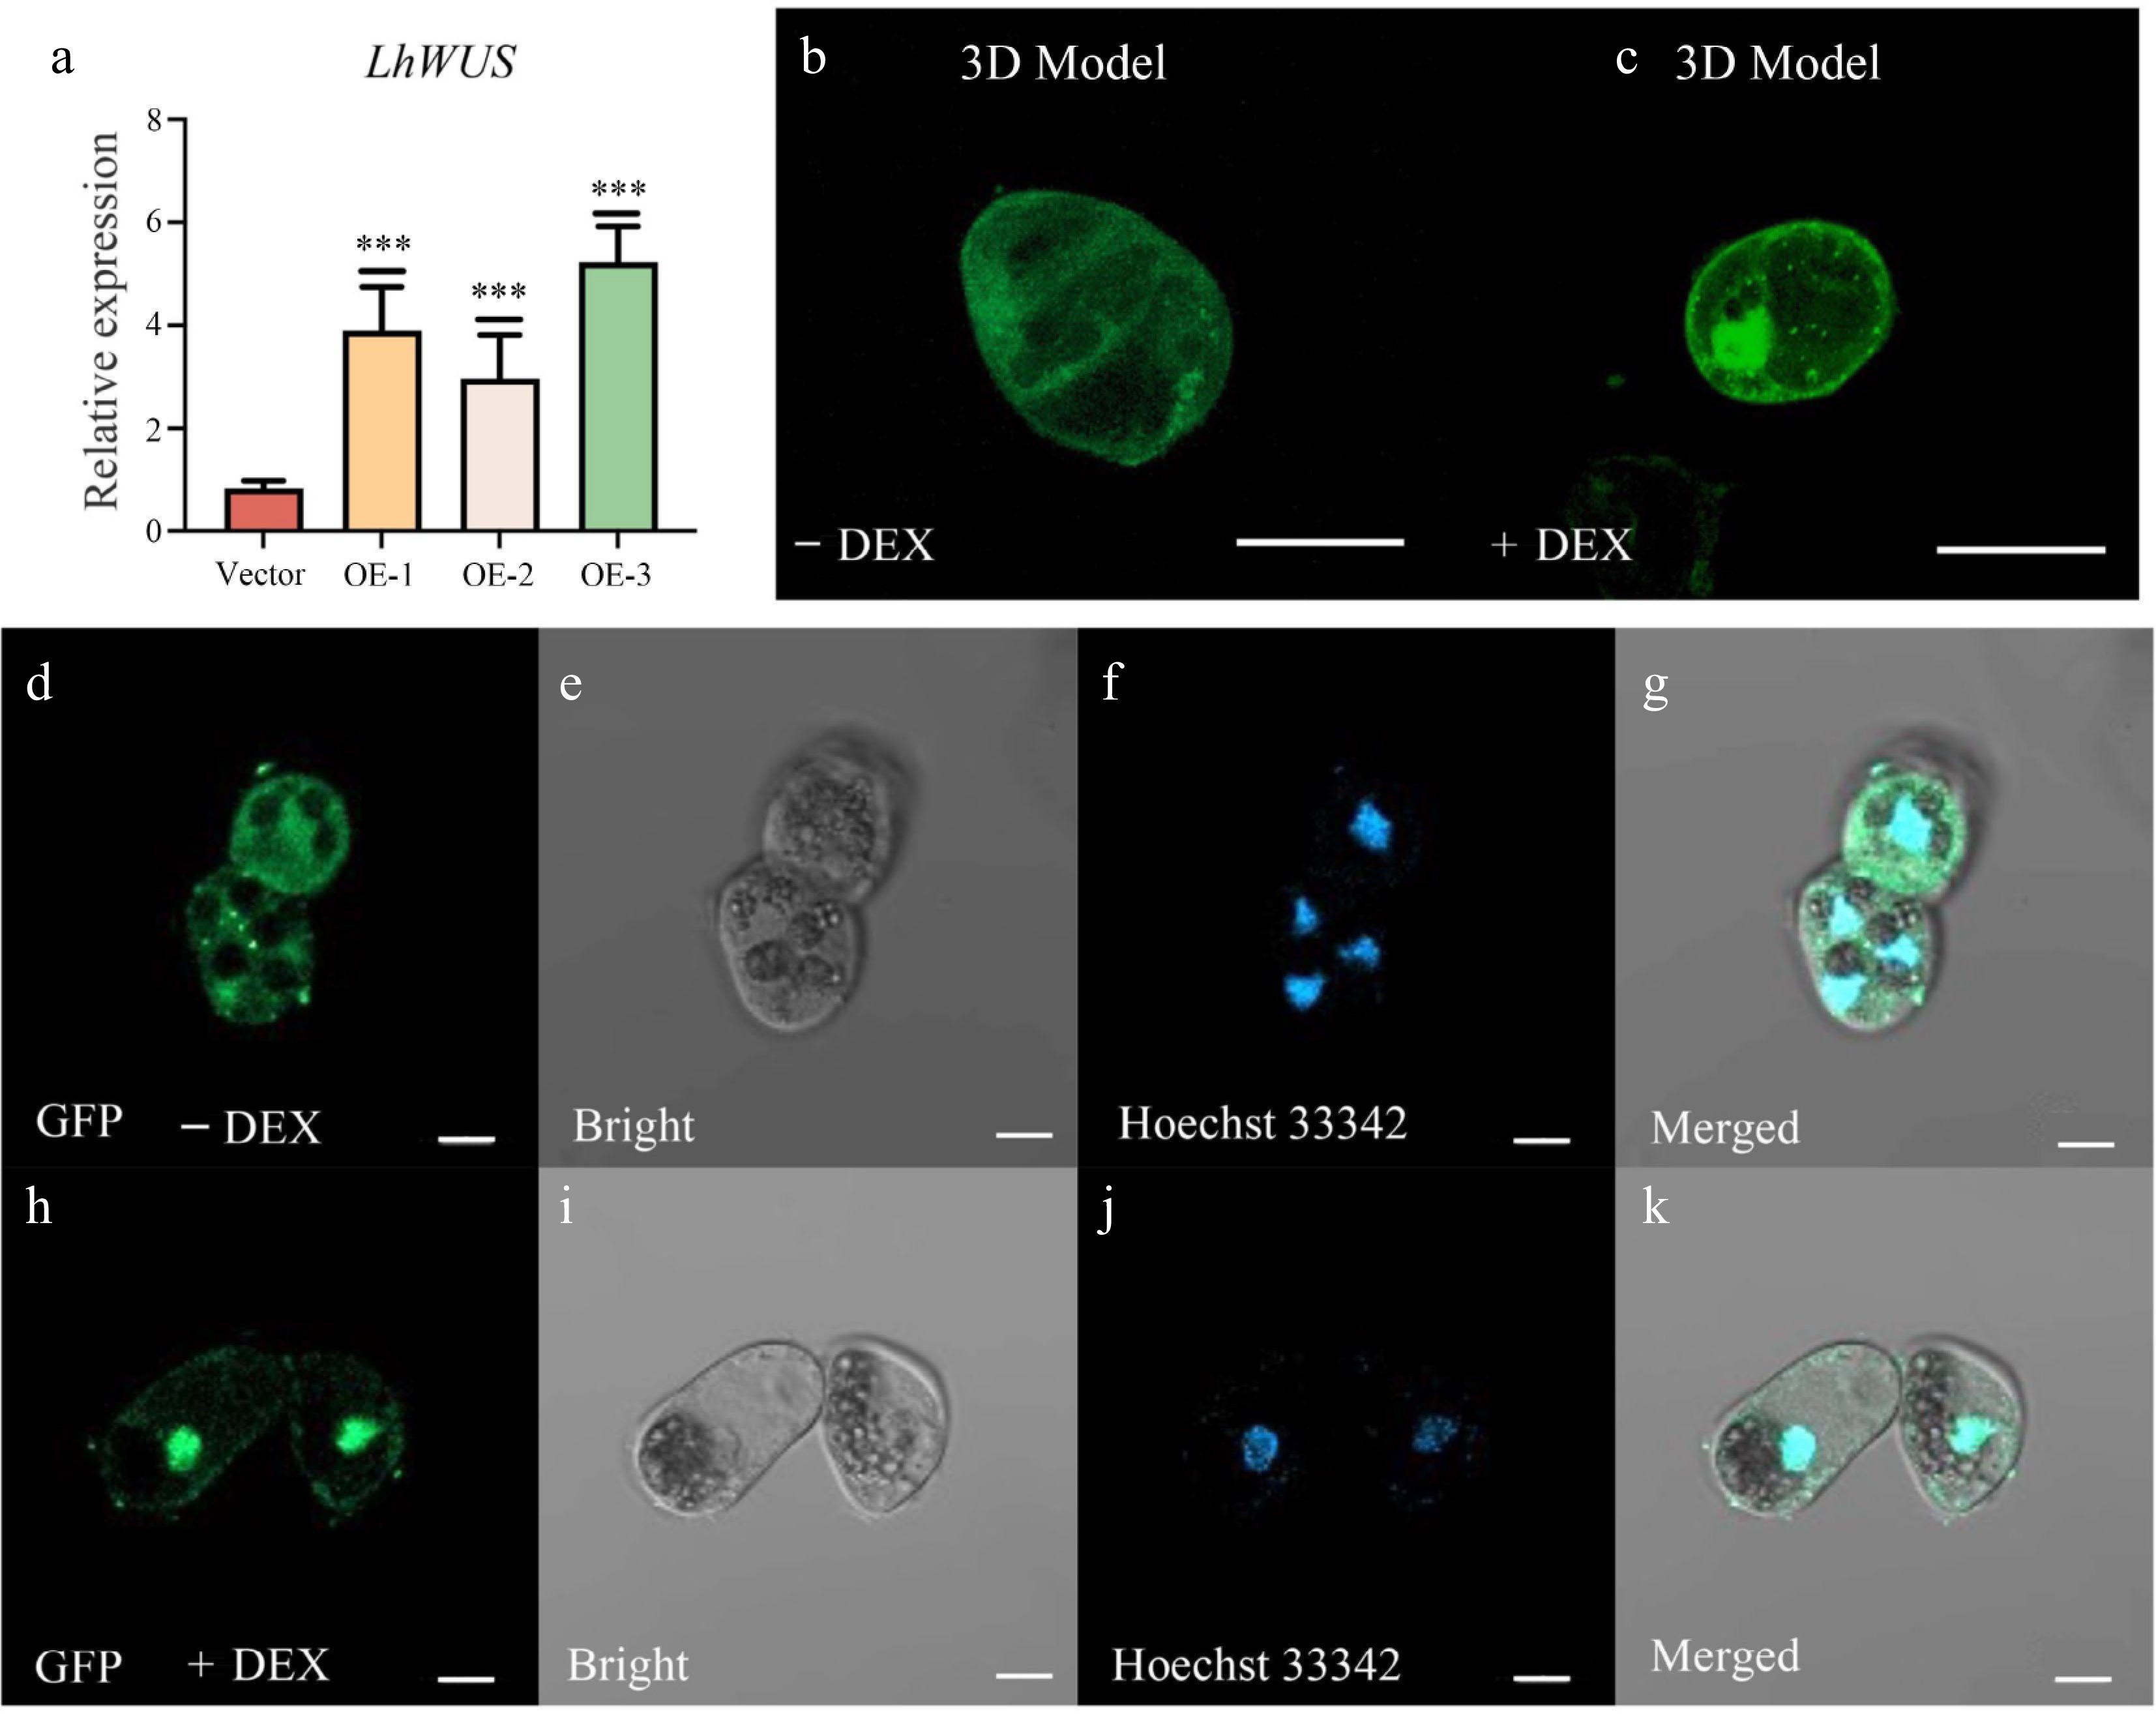
Figure 1.
Overexpression of p35S:LhWUS-GFP-GR gene in Liriodendron hybrid callus cells. (a) LhWUS-GFP-GR transgenic calli and empty qPCR was used to assess the expression of the LhWUS gene. (b), (d)–(g) p35S:LhWUS-GFP-GR transgenic Liriodendron hybrid callus cells without DEX treatment. (c), (h)–(k) p35S:LhWUS-GFP-GR Liriodendron hybrid callus cells treated with 10 μM DEX for 7 d. The results were generated under the following conditions: (b), (d), (h) under a wavelength of 488 nm, (e), (i) under bright field, (f), (j) under a wavelength of 405 nm, (g), (k) the merging of three images, and (b), (c) Z-stacks were used to shoot and set the image acquisition range. Fluorescence scanning was performed at every set value to obtain a three-dimensional fluorescence image. The final presentation consisted of a superimposed three-dimensional image. The expression was measured using LhUBQ as the internal reference gene. Scale bar: (b), (c) 40 μm; (d)–(k) 10 μm. ***, p < 0.01. Data represent mean ± SD from three biological replicates.
-

Figure 2.
Dynamic 3D images of p35S:LhWUS-GFP-GR transgenic Liriodendron hybrids callus under confocal laser. After treating the LhWUS-GFP-GR transgenic cells with different concentrations of DEX, sequential images of the same cells were obtained using Z-stacks. Images were acquired every minute, with each set of images arranged from top to bottom, representing photos taken at 1 min, 5 min, and 10 min after the cells were treated. ZEN software was used to outline the nucleus, followed by quantitative analysis of the fluorescence intensity. The results of treating transgenic cells with (a) 1 mM DEX, (b) 100 μM DEX, (c) 10 μM DEX, and (d) 1 μM DEX were obtained. Scale bar = 20 μm.
-

Figure 3.
Transgenic callus treated with different concentrations of DEX. (a) qPCR was used to detect the expression of the LhWUS gene in LhWUS-GR transgenic calli, with the empty vector serving as the control. (b) The phenotype of LhWUS-GR transgenic callus was observed before and after treatment with different concentrations of DEX. The left column represents the phenotype before treatment, whereas the right column represents the phenotype after treatment. Scale bar = 5 mm. (c), (d) Transgenic callus treated with different concentrations of DEX for 20 d resulted in an increase of the callus weight. ***, p < 0.01. Data represent mean ± SD from three biological replicates.
-

Figure 4.
Phenotypes and statistics of the number of somatic embryos induced on medium containing ABA after treatment with different concentrations of DEX. (a), (e) Transgenic calli were induced using the same amount of absolute ethanol as in the control group. (b), (f) Transgenic calli induced the somatic embryo phenotype after treatment with 1 μM DEX. (c), (g) Transgenic calli showed the phenotype of somatic embryos induced by 5 μM DEX. (d), (h) Transgenic calli showed the phenotype of somatic embryos induced by 10 μM DEX. (i), (j) The average number of somatic embryos per callus exposed to different concentrations of DEX; Scale bar = 1 mm. The letters a–d denote statistical significance (one-way ANOVA, Tukey's multiple comparisons test.
-
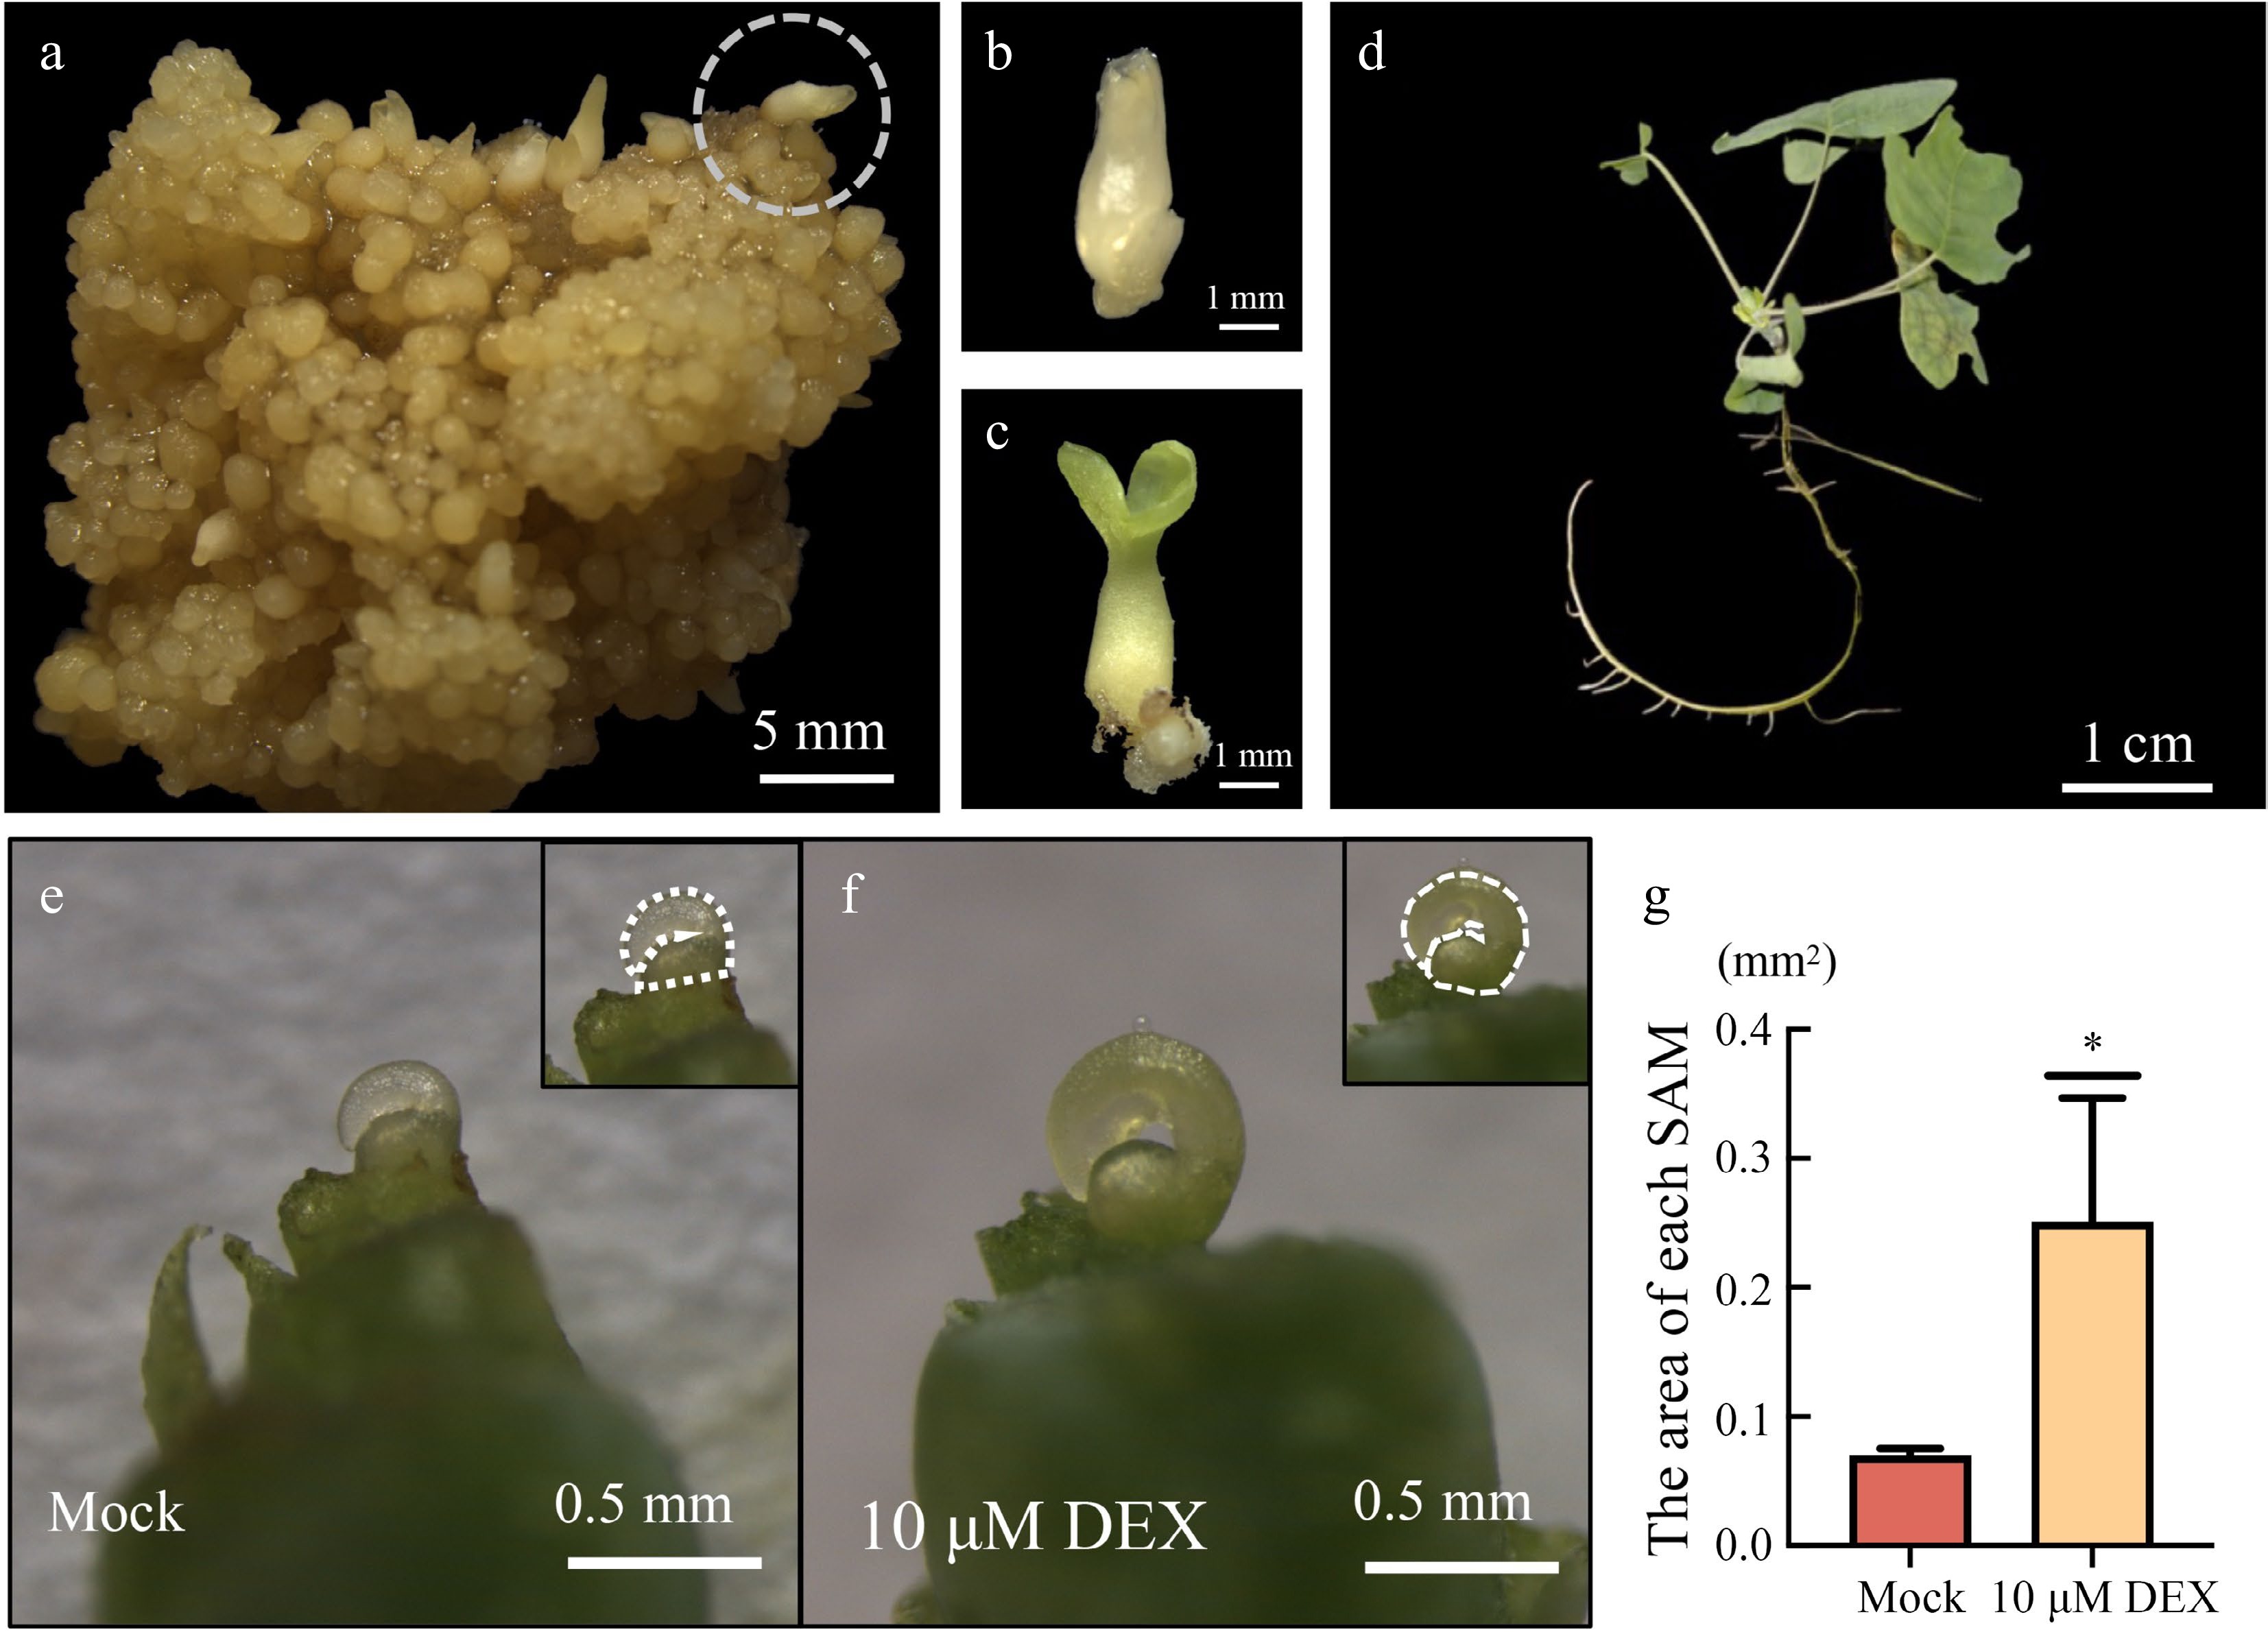
Figure 5.
Induction of transgenic plants by solid culture. (a) LhWUS-GR callus was solid-induced for 45 d on ¾ MS medium. (b) Cotyledon embryos detached from the callus. (c) Cotyledon embryos after 7 d of light. (d) Two-month-old plantlets grown from regenerated cotyledon embryos. (e) Meristem of LhWUS-GR transgenic plants treated with mock for 10 d. (f) LhWUS-GR transgenic plants of shoot tip treated with 10 μM DEX for 10 d. (g) Statistics on the area size of SAM of LhWUS-GR plants treated with mock and 10 μM DEX. Scale bar: (a) 5 mm; (b), (c) 1 mm; (d) 1 cm; (e), (f) 0.5 mm. *, p < 0.05. Data represent mean ± SD from three biological replicates.
Figures
(5)
Tables
(0)