-
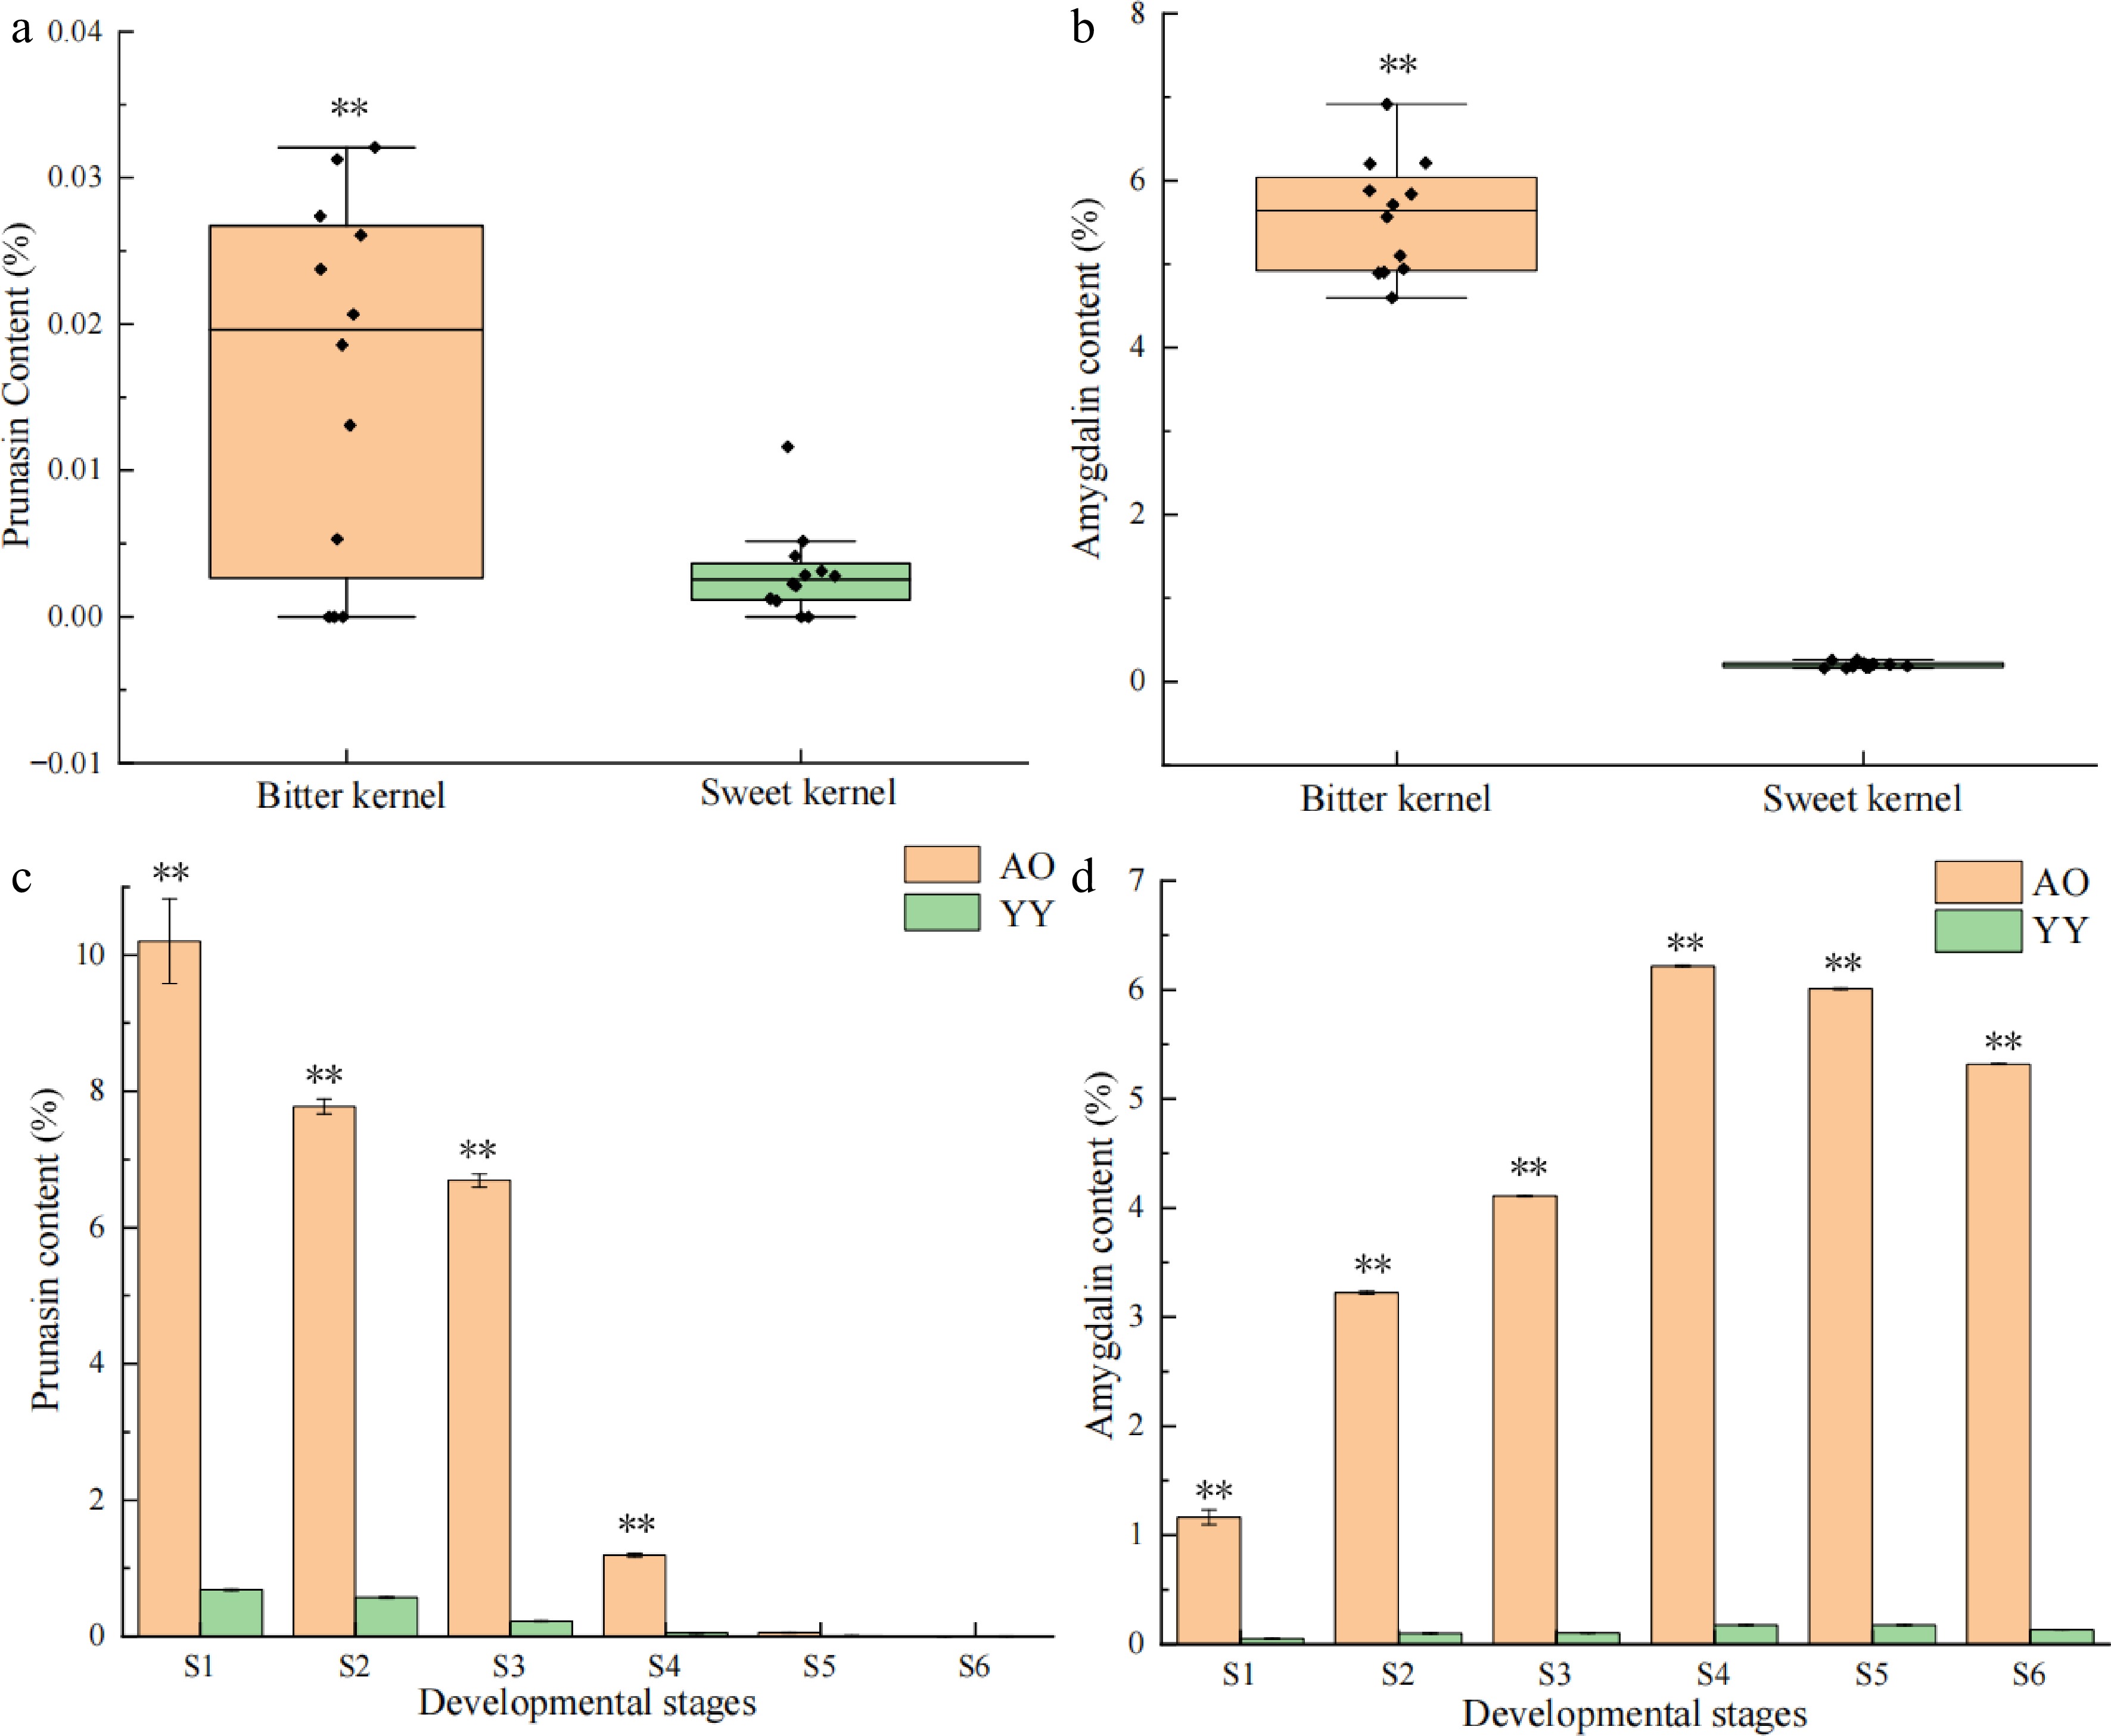
Figure 1.
Patterns in the content of prunasin and amygdalin in P. sibirica and kernel consumption apricot. Significance testing was conducted using a T-test (* p < 0.05, ** p < 0.01), three replicates for each sample. (a) Prunasin content of bitter and sweet kernels at the mature stage. (b) Amygdalin content of bitter and sweet kernels at the mature stage. (c) Prunasin content at different developmental stages (S1–S6) of bitter and sweet kernels. (d) Amygdalin content at different developmental stages (S1–S6) of bitter and sweet kernels.
-
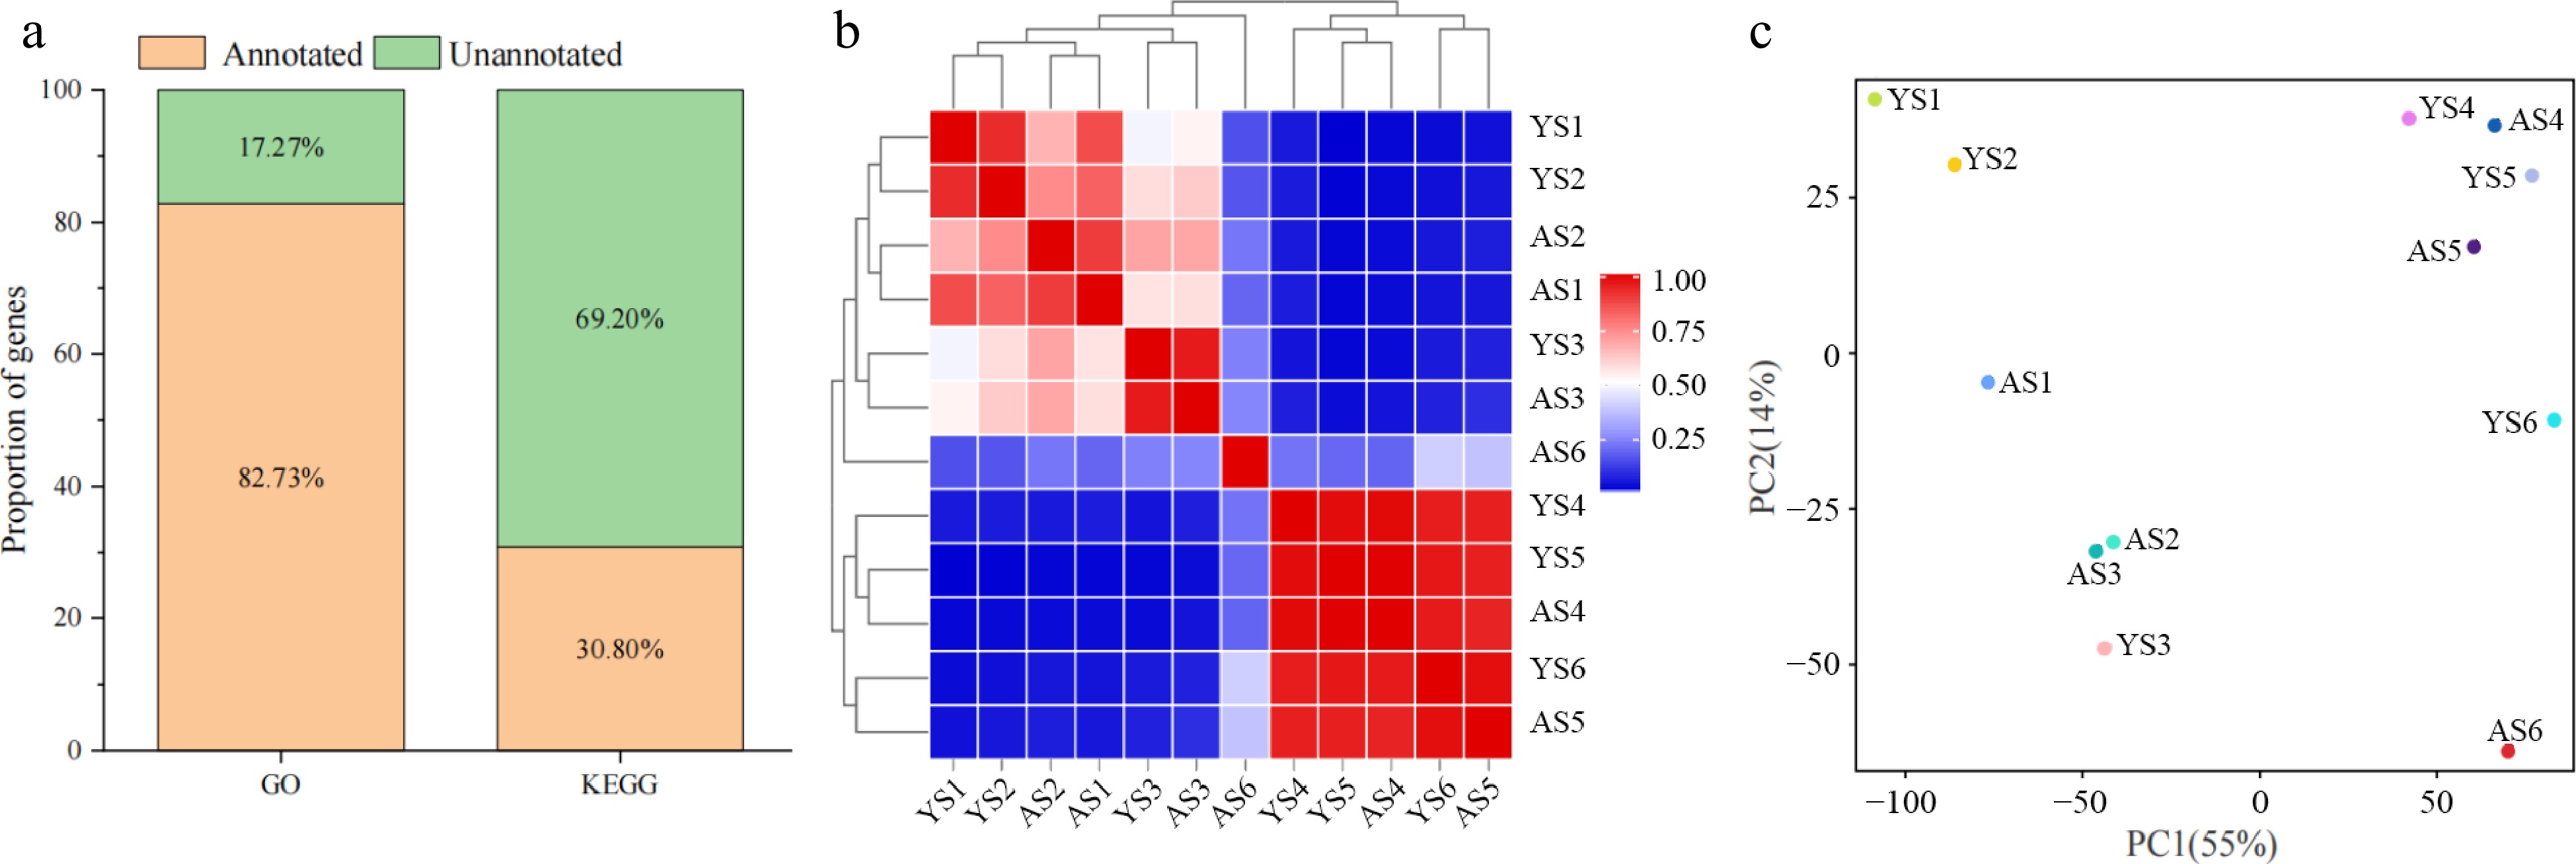
Figure 2.
Analysis of gene in the transcriptome of bitter and sweet kernels. (a) Annotation of DEGs in GO and KEGG databases. (b) Pearson correlation coefficient (PCC) at six different developmental stages of 'Aohanqi-39' (AO, AS1–AS6) and 'Youyi' (YY, YS1–YS6). (c) Principal Component Analysis (PCA) at six developmental stages of 'Aohanqi-39' (AO) and 'Youyi' (YY).
-
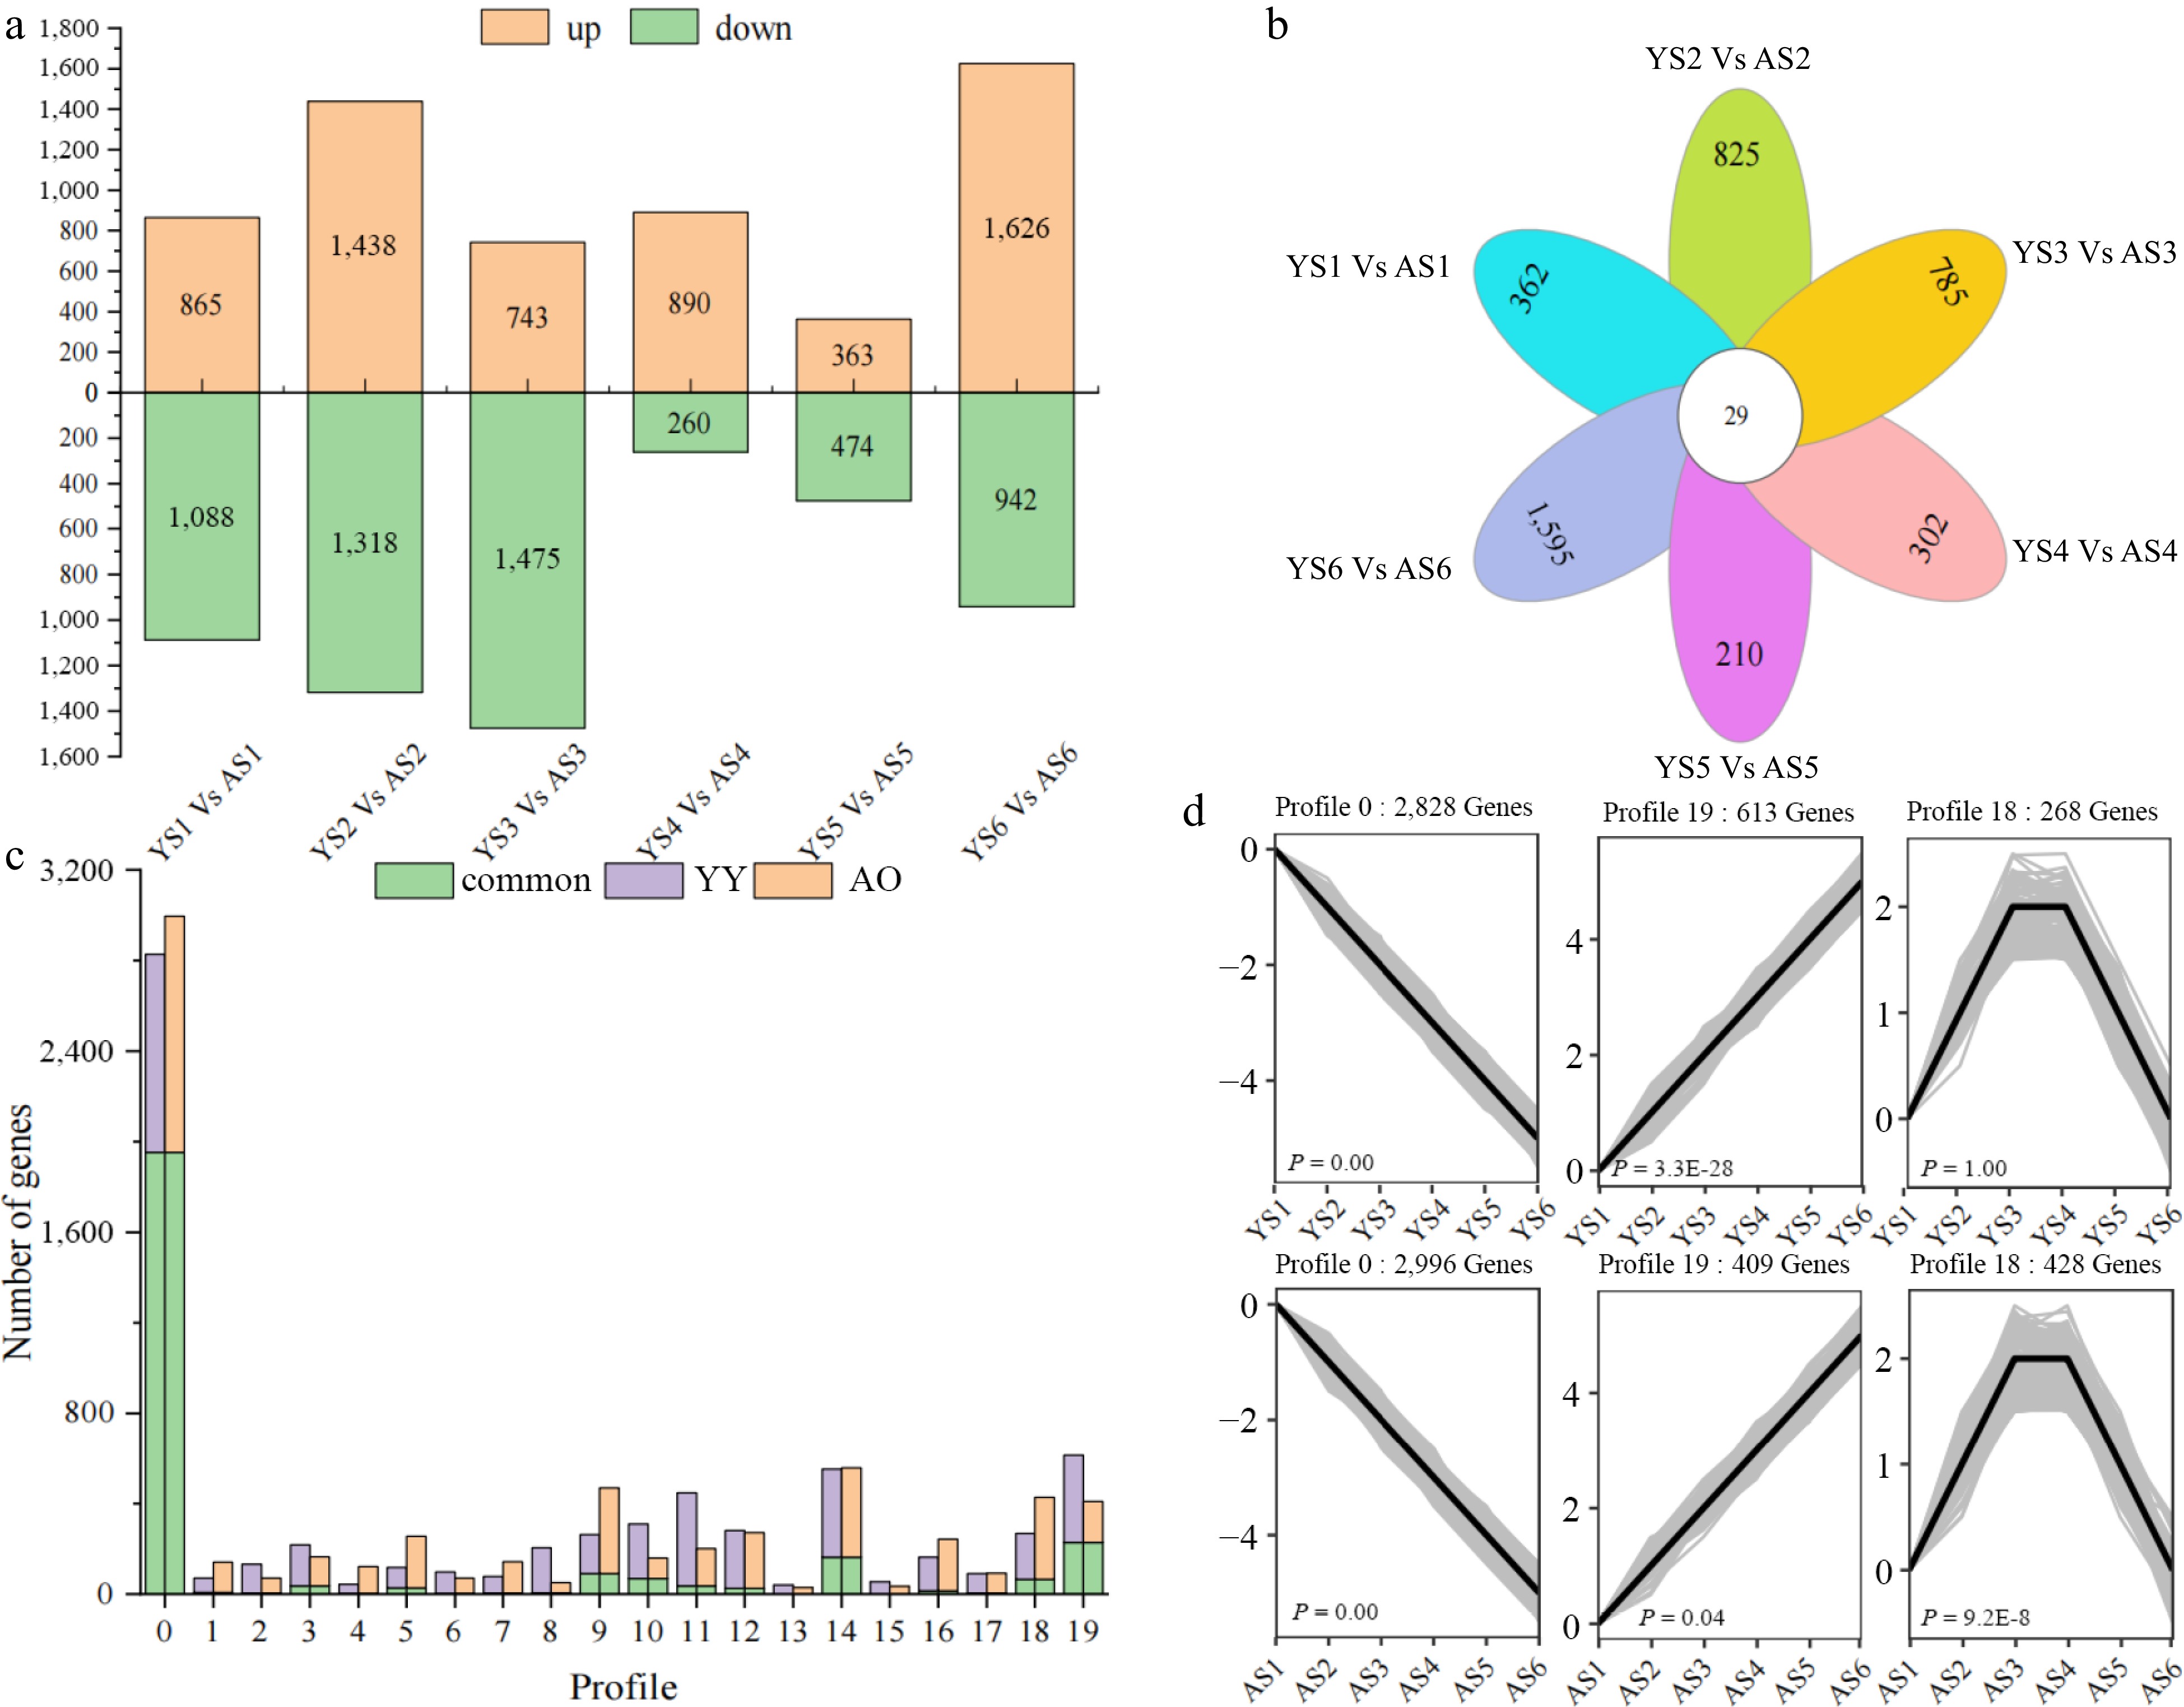
Figure 3.
Differences in the number of DEGs as well as expression patterns between 'Youyi' (YY) and 'Aohanqi-39' (AO) at different developmental stages. (a) The number of up-regulated (yellow bars) and down-regulated (green bars) genes at different developmental stages in YY and AO. (b) The number of common and unique DEGs at different developmental stages in YY and AO. (c) The clustering profiles of the expression trends of all DEGs using STEM analysis.
-
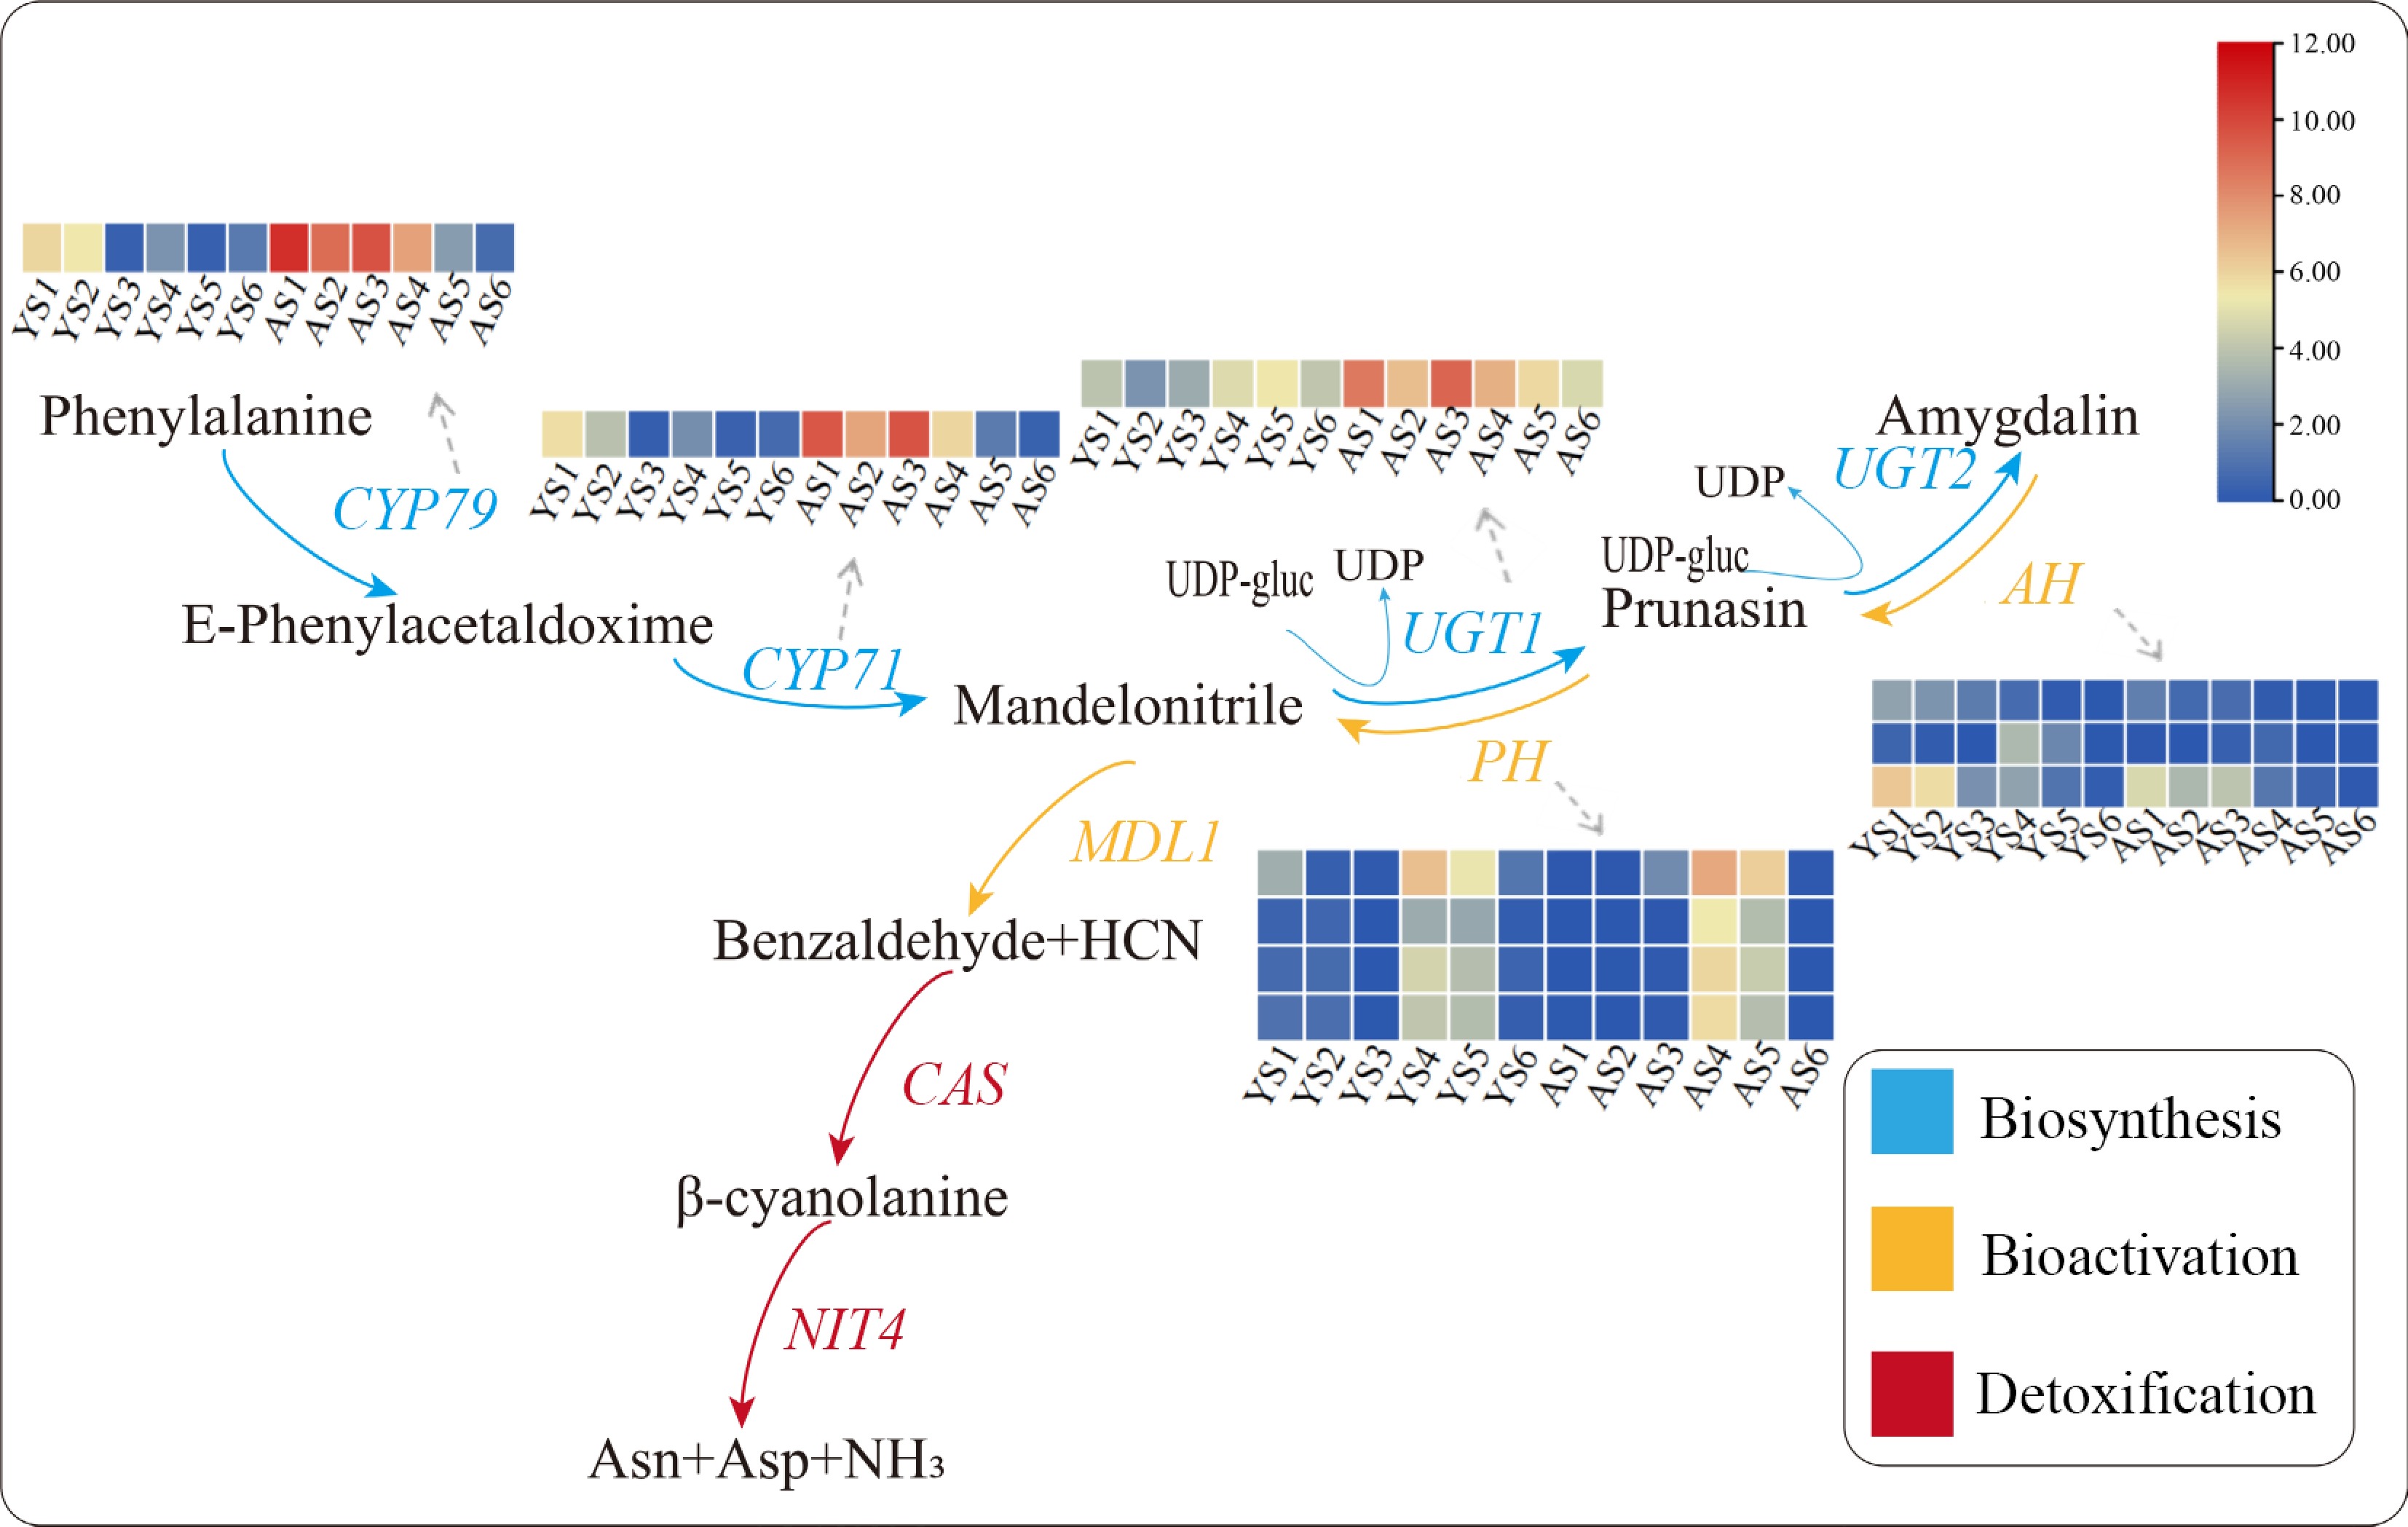
Figure 4.
Expression patterns of relevant DEGs in the cyanoamino acid metabolic pathway. Red indicates high expression and blue indicates low expression. The IDs of the DEGs in the pathway were showed as following, CYP79: PaF106G0600021916.01; CYP71: PaF106G0500020435.01; UGT1: PaF106G0100005987.01; AH: PaF106G0200008023.01, PaF106G0600023212.01, and PaF106G0400014231.01; PH: PaF106G0600021586.01, PaF106G0600022768.01, PaF106G0600022773.01, and PaF106G0600022775.01.
-
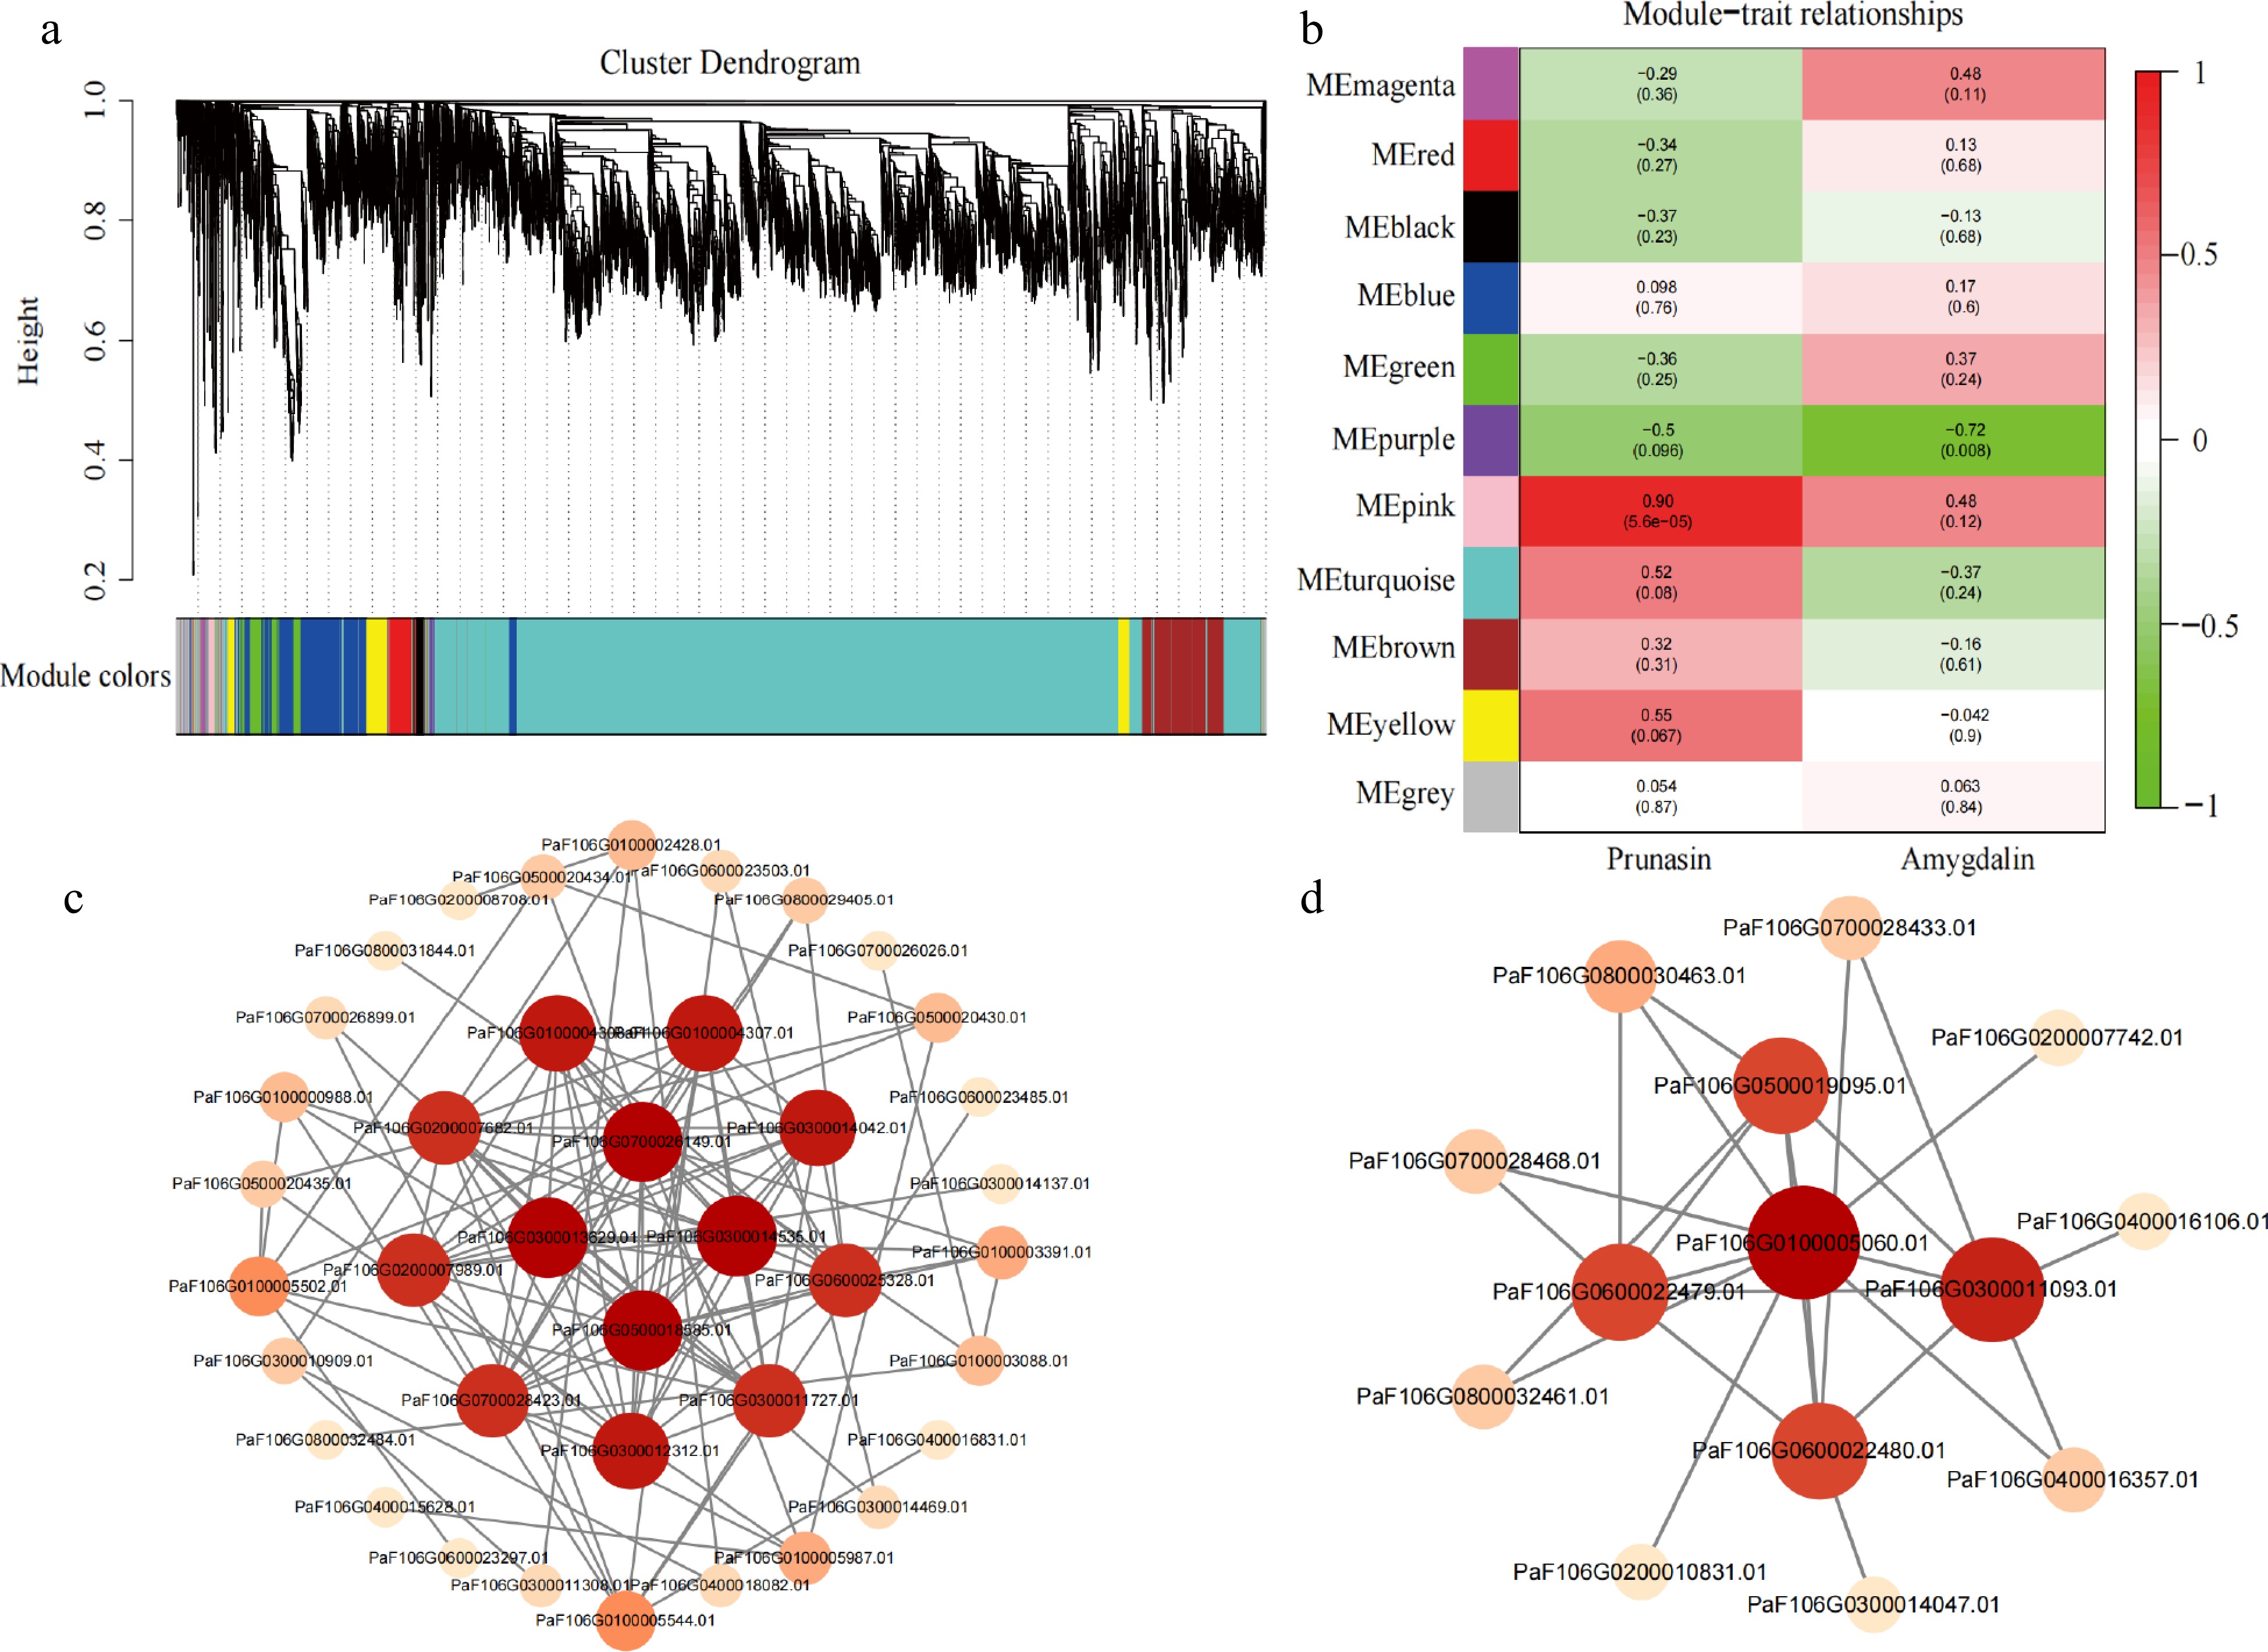
Figure 5.
Identification of hub genes in a co-expression network. (a) Hierarchical clustering dendrogram showing 11 co-expression gene modules by WGCNA. (b) Correlations and corresponding p-values of different modules with prunasin and amygdalin content. (c) Co-expression network of 22 genes in the pink module. (d) Co-expression network of 10 genes in the purple module.
-
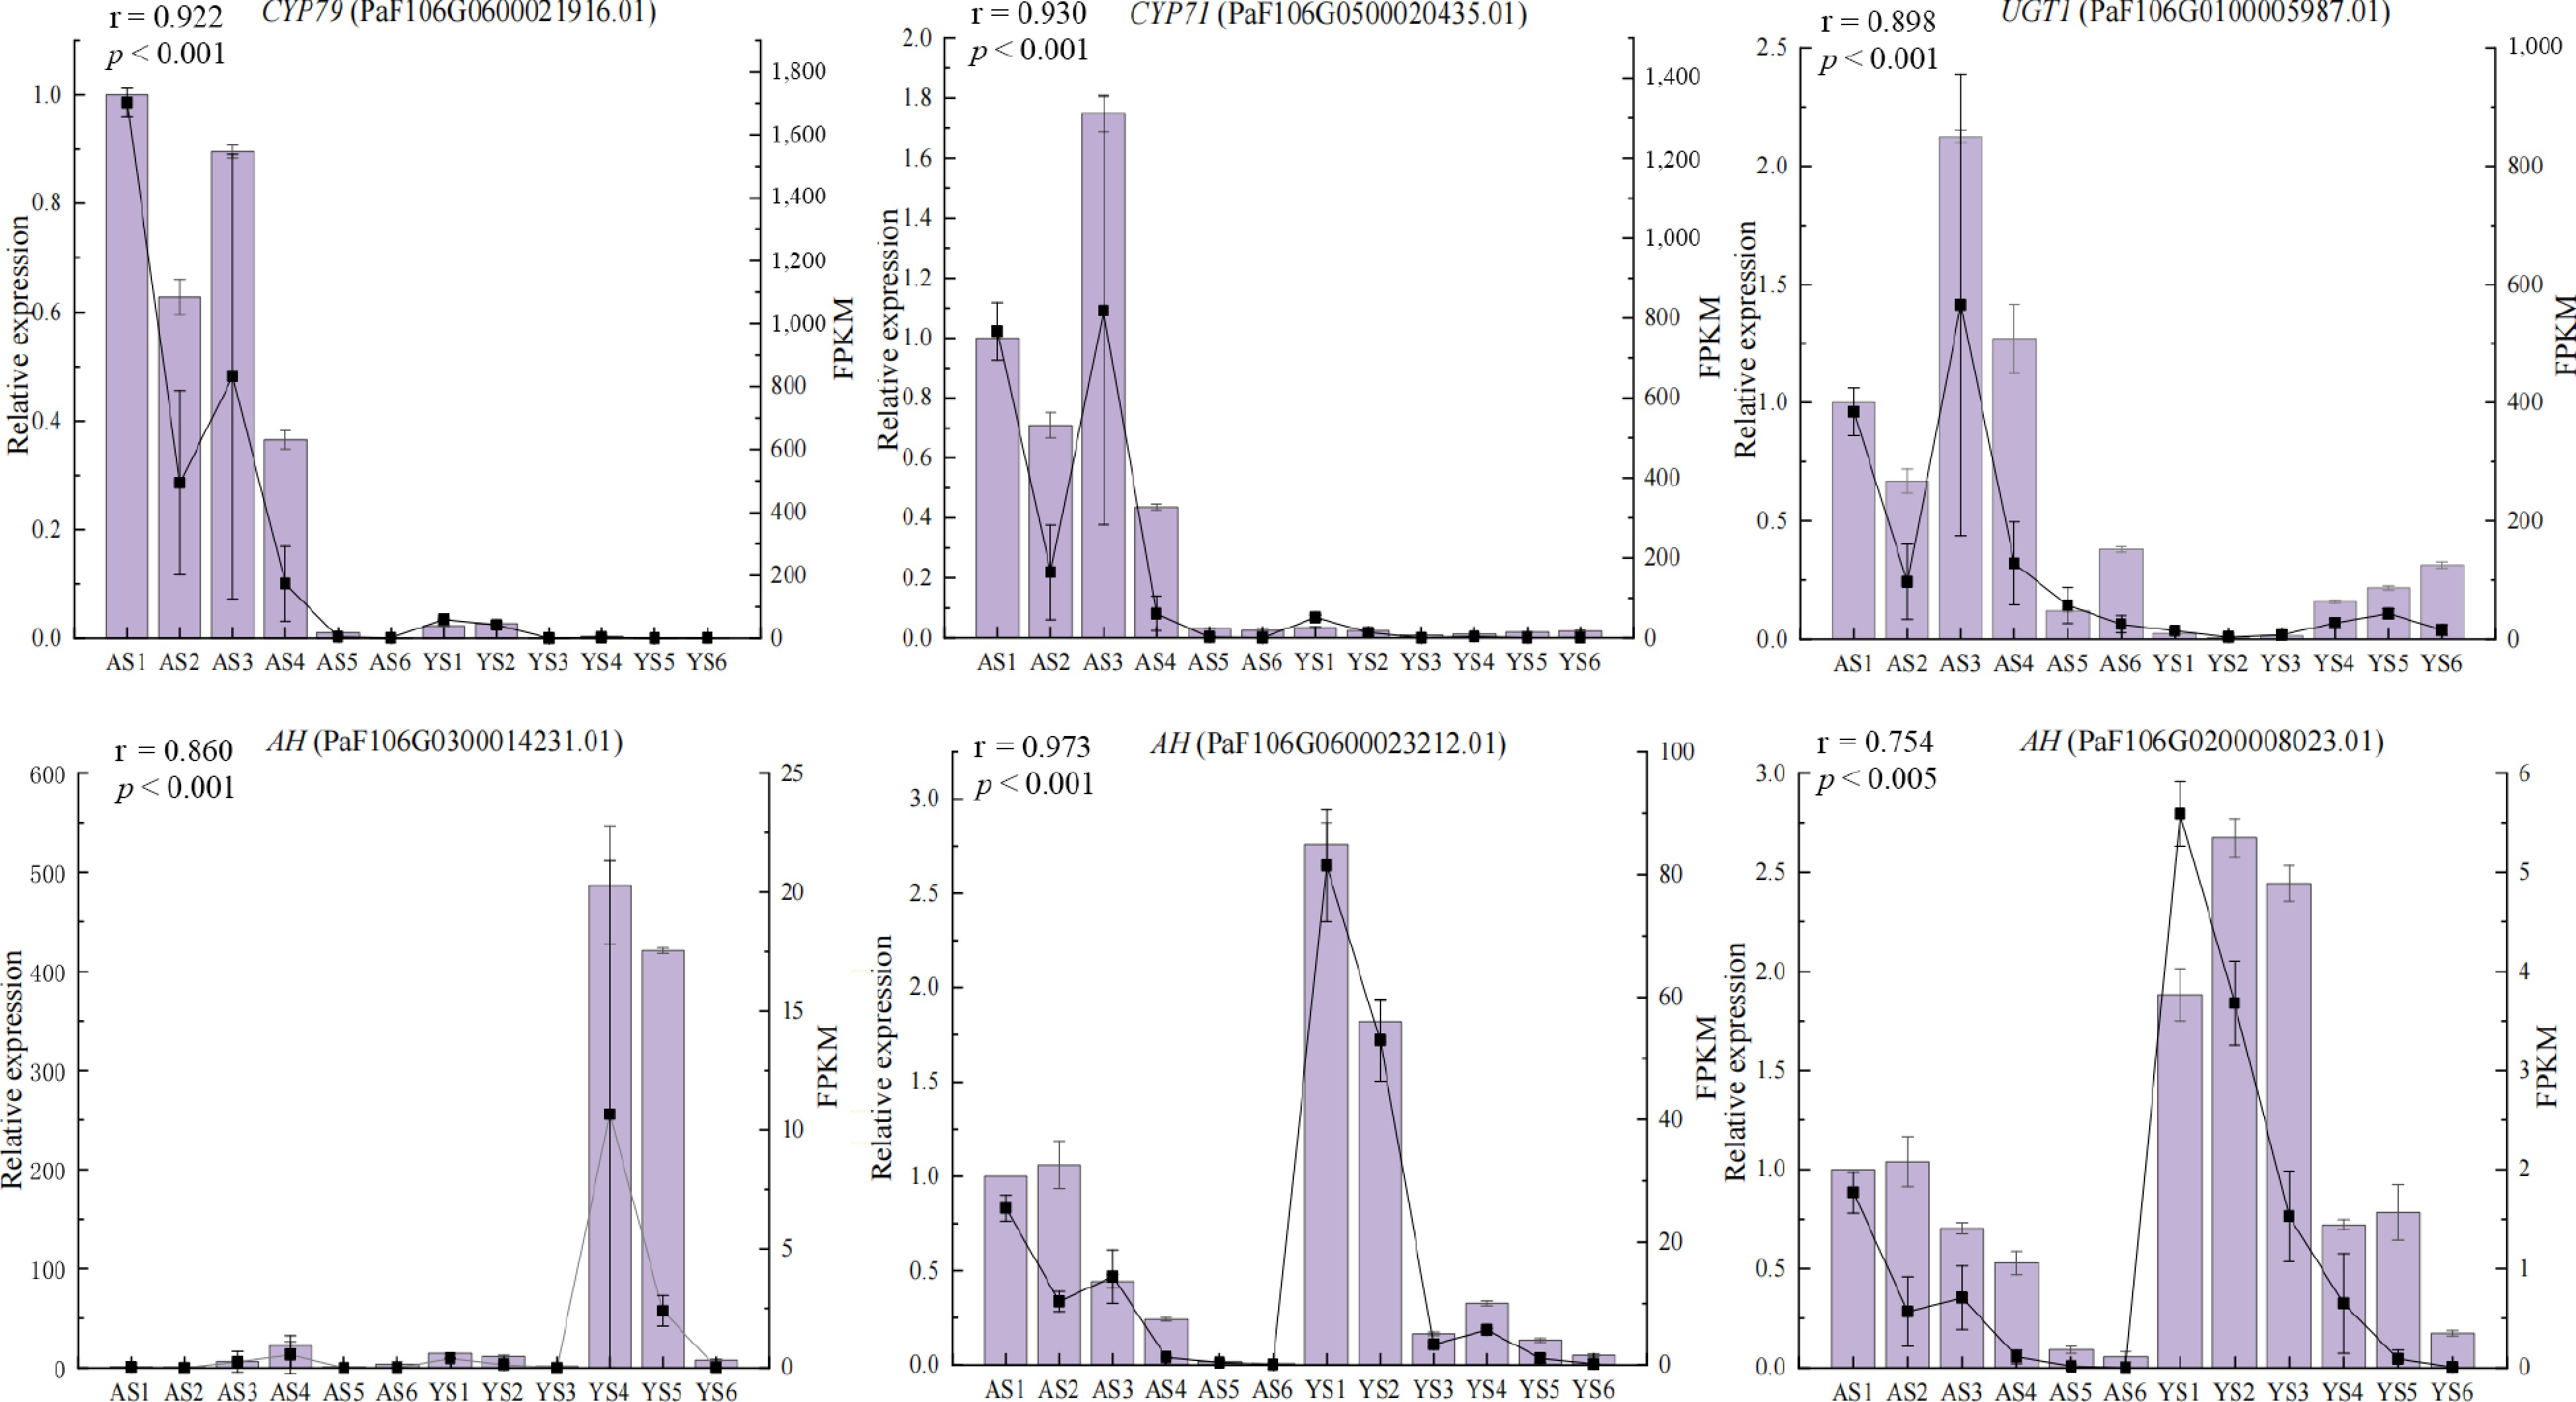
Figure 6.
Expression levels of six candidate DEGs validated by qRT-PCR. Columns and lines indicate qRT-PCR and RNA-seq of the candidate DEGs, respectively. Pearson correlation coefficients were calculated between qRT-PCR and RNA-seq data of candidate DEGs.
Figures
(6)
Tables
(0)