-
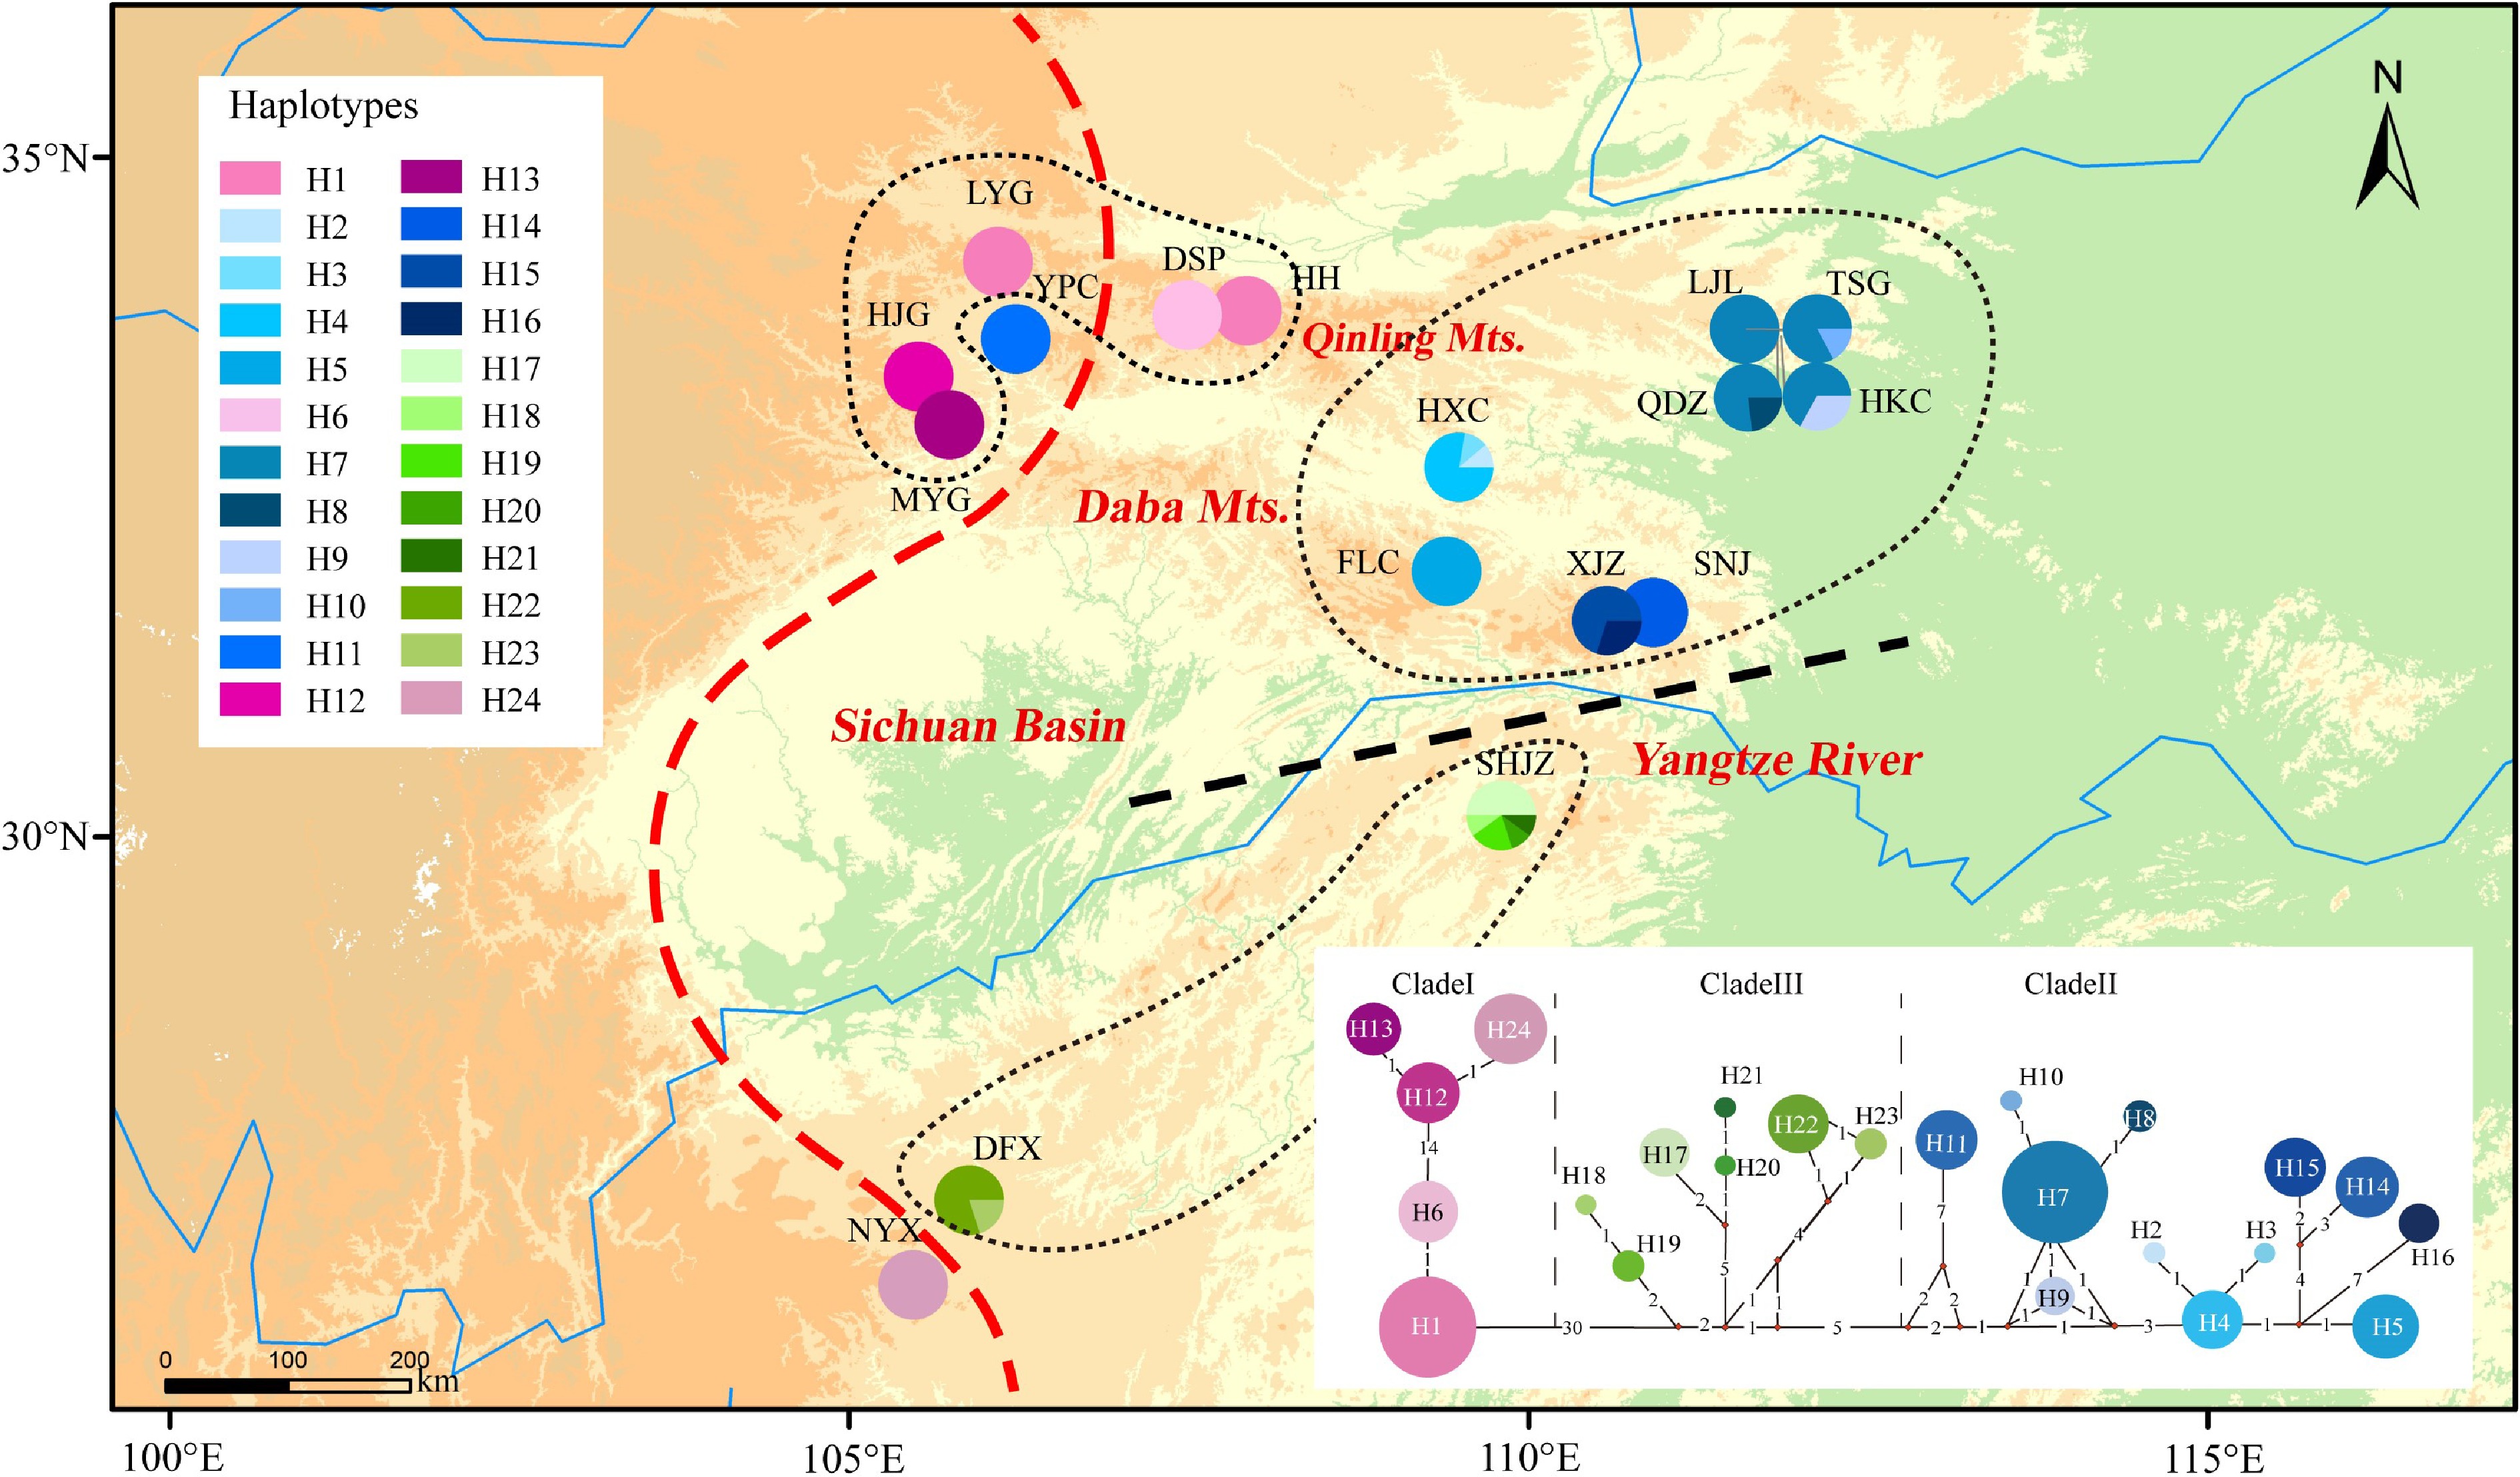
Figure 1.
Distribution of 24 chloroplast haplotypes of Pterocarya hupehensis. The lower right panel shows the minimum spanning network of 24 chlorotypes. Circle sizes are proportional to the number of samples per haplotype. The red dashed line on the map represents the Sino-Himalayan/Sino-Japanese forest boundary. The black dashed line represents the phylogeographic break along the Yangtze River in the eastern Sichuan Basin. The black dotted lines delineate three phylogroups with closely related chlorotypes.
-

Figure 2.
BEAST-derived chronogram of 24 Pterocarya hupehensis haplotypes based on six chloroplast DNA (cpDNA) fragments. The divergence time are shown above branches, with blue bars indicating the 95% highest posterior densities (HPDs). Posterior probabilities are labeled at each node.
-
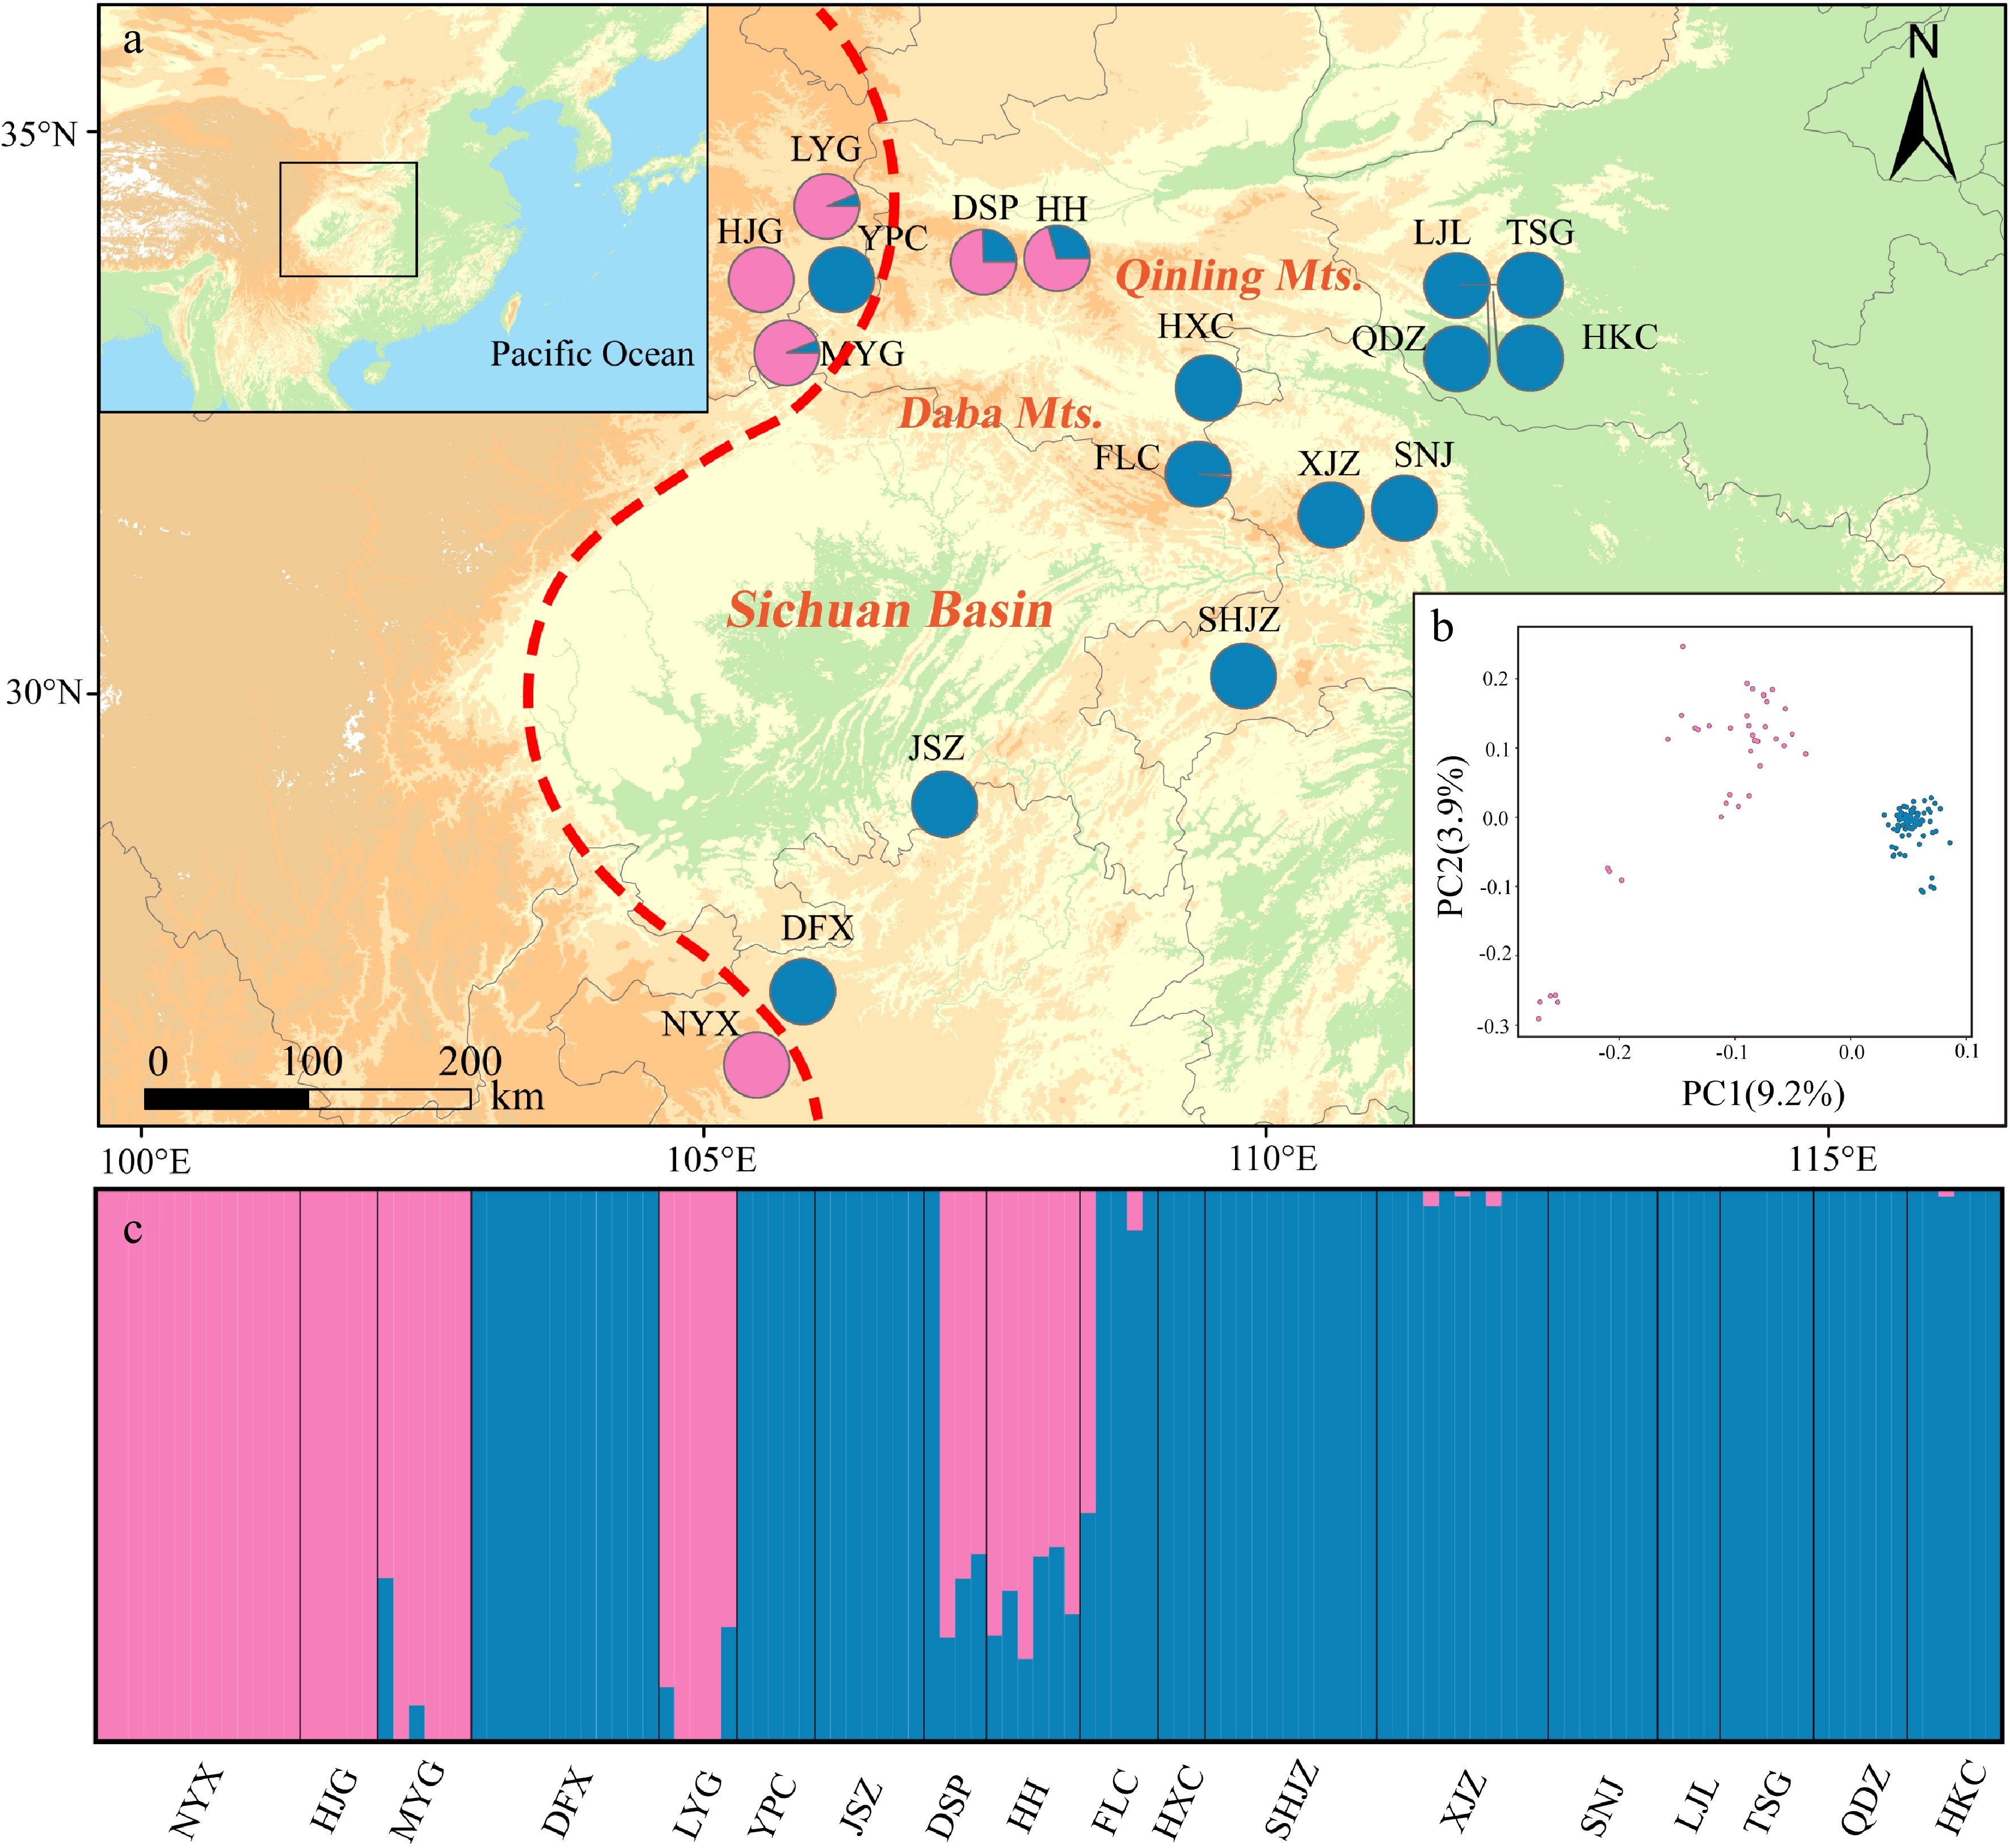
Figure 3.
Genetic structure of Pterocarya hupehensis based on 2,889 SNPs dataset. (a) Geographic origins of 18 P. hupehensis populations and their color-coded grouping at close to K = 2. The red dashed line represents the Sino-Himalayan/Sino-Japanese forest boundary. (b) Principal component analysis (PCA), with pink and blue colors representing two clusters. (c) Histogram of the Admixture analysis for P. hupehensis with K = 2.
-
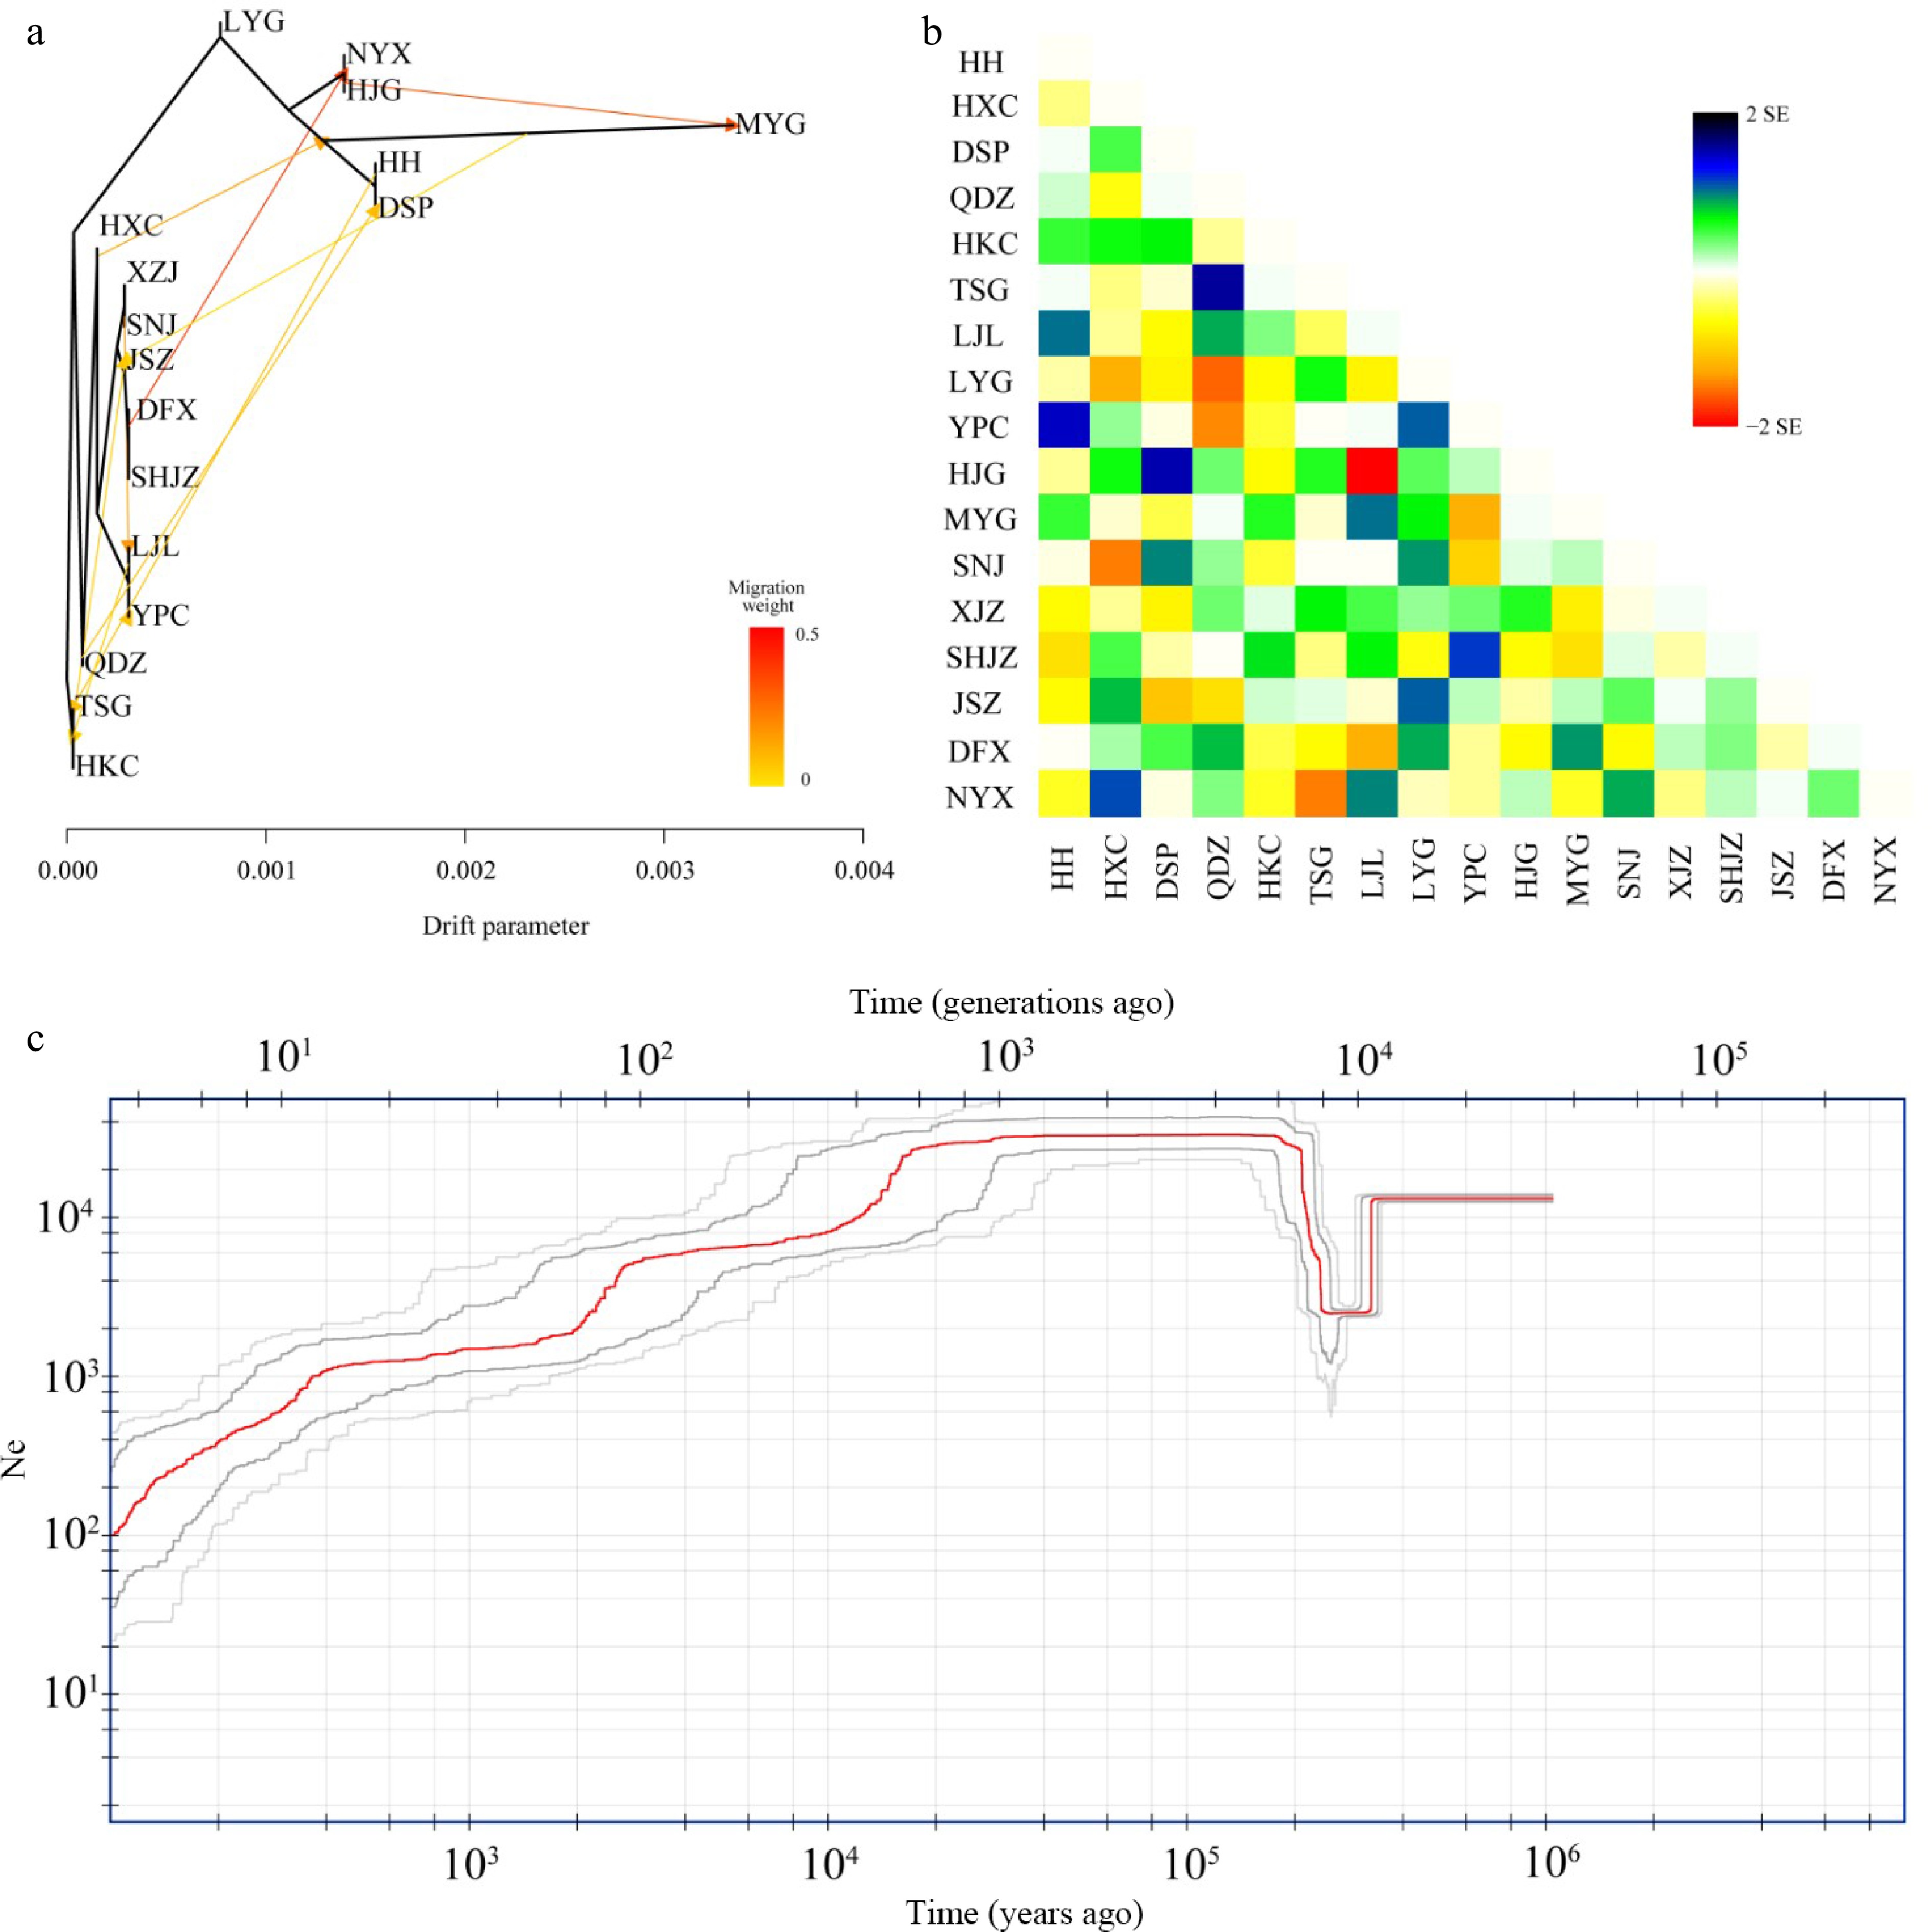
Figure 4.
Hybridization among populations of Pterocarya hupehensis. (a) Maximum likelihood (ML) tree inferred using Treemix; gene-flow events are depicted with arrows, and ten migration events were allowed. Migration arrows are colored according to their weight. Horizontal branch lengths are proportional to the amount of genetic drift that occurred on each branch. The scale bar shows 10× the average standard error of the entries in the sample covariance matrix. (b) Heatmaps of residual fit from the ML tree. Residuals white through blue indicate that the corresponding populations are more closely related to each other than on the ML tree, suggesting confounding events between these populations. (c) Demographic history of P. hupehensis inferred with Stairway Plot 2 using unfolded site frequency spectra. The 95% confidence interval for estimated effective population size is shown with gray lines.
-
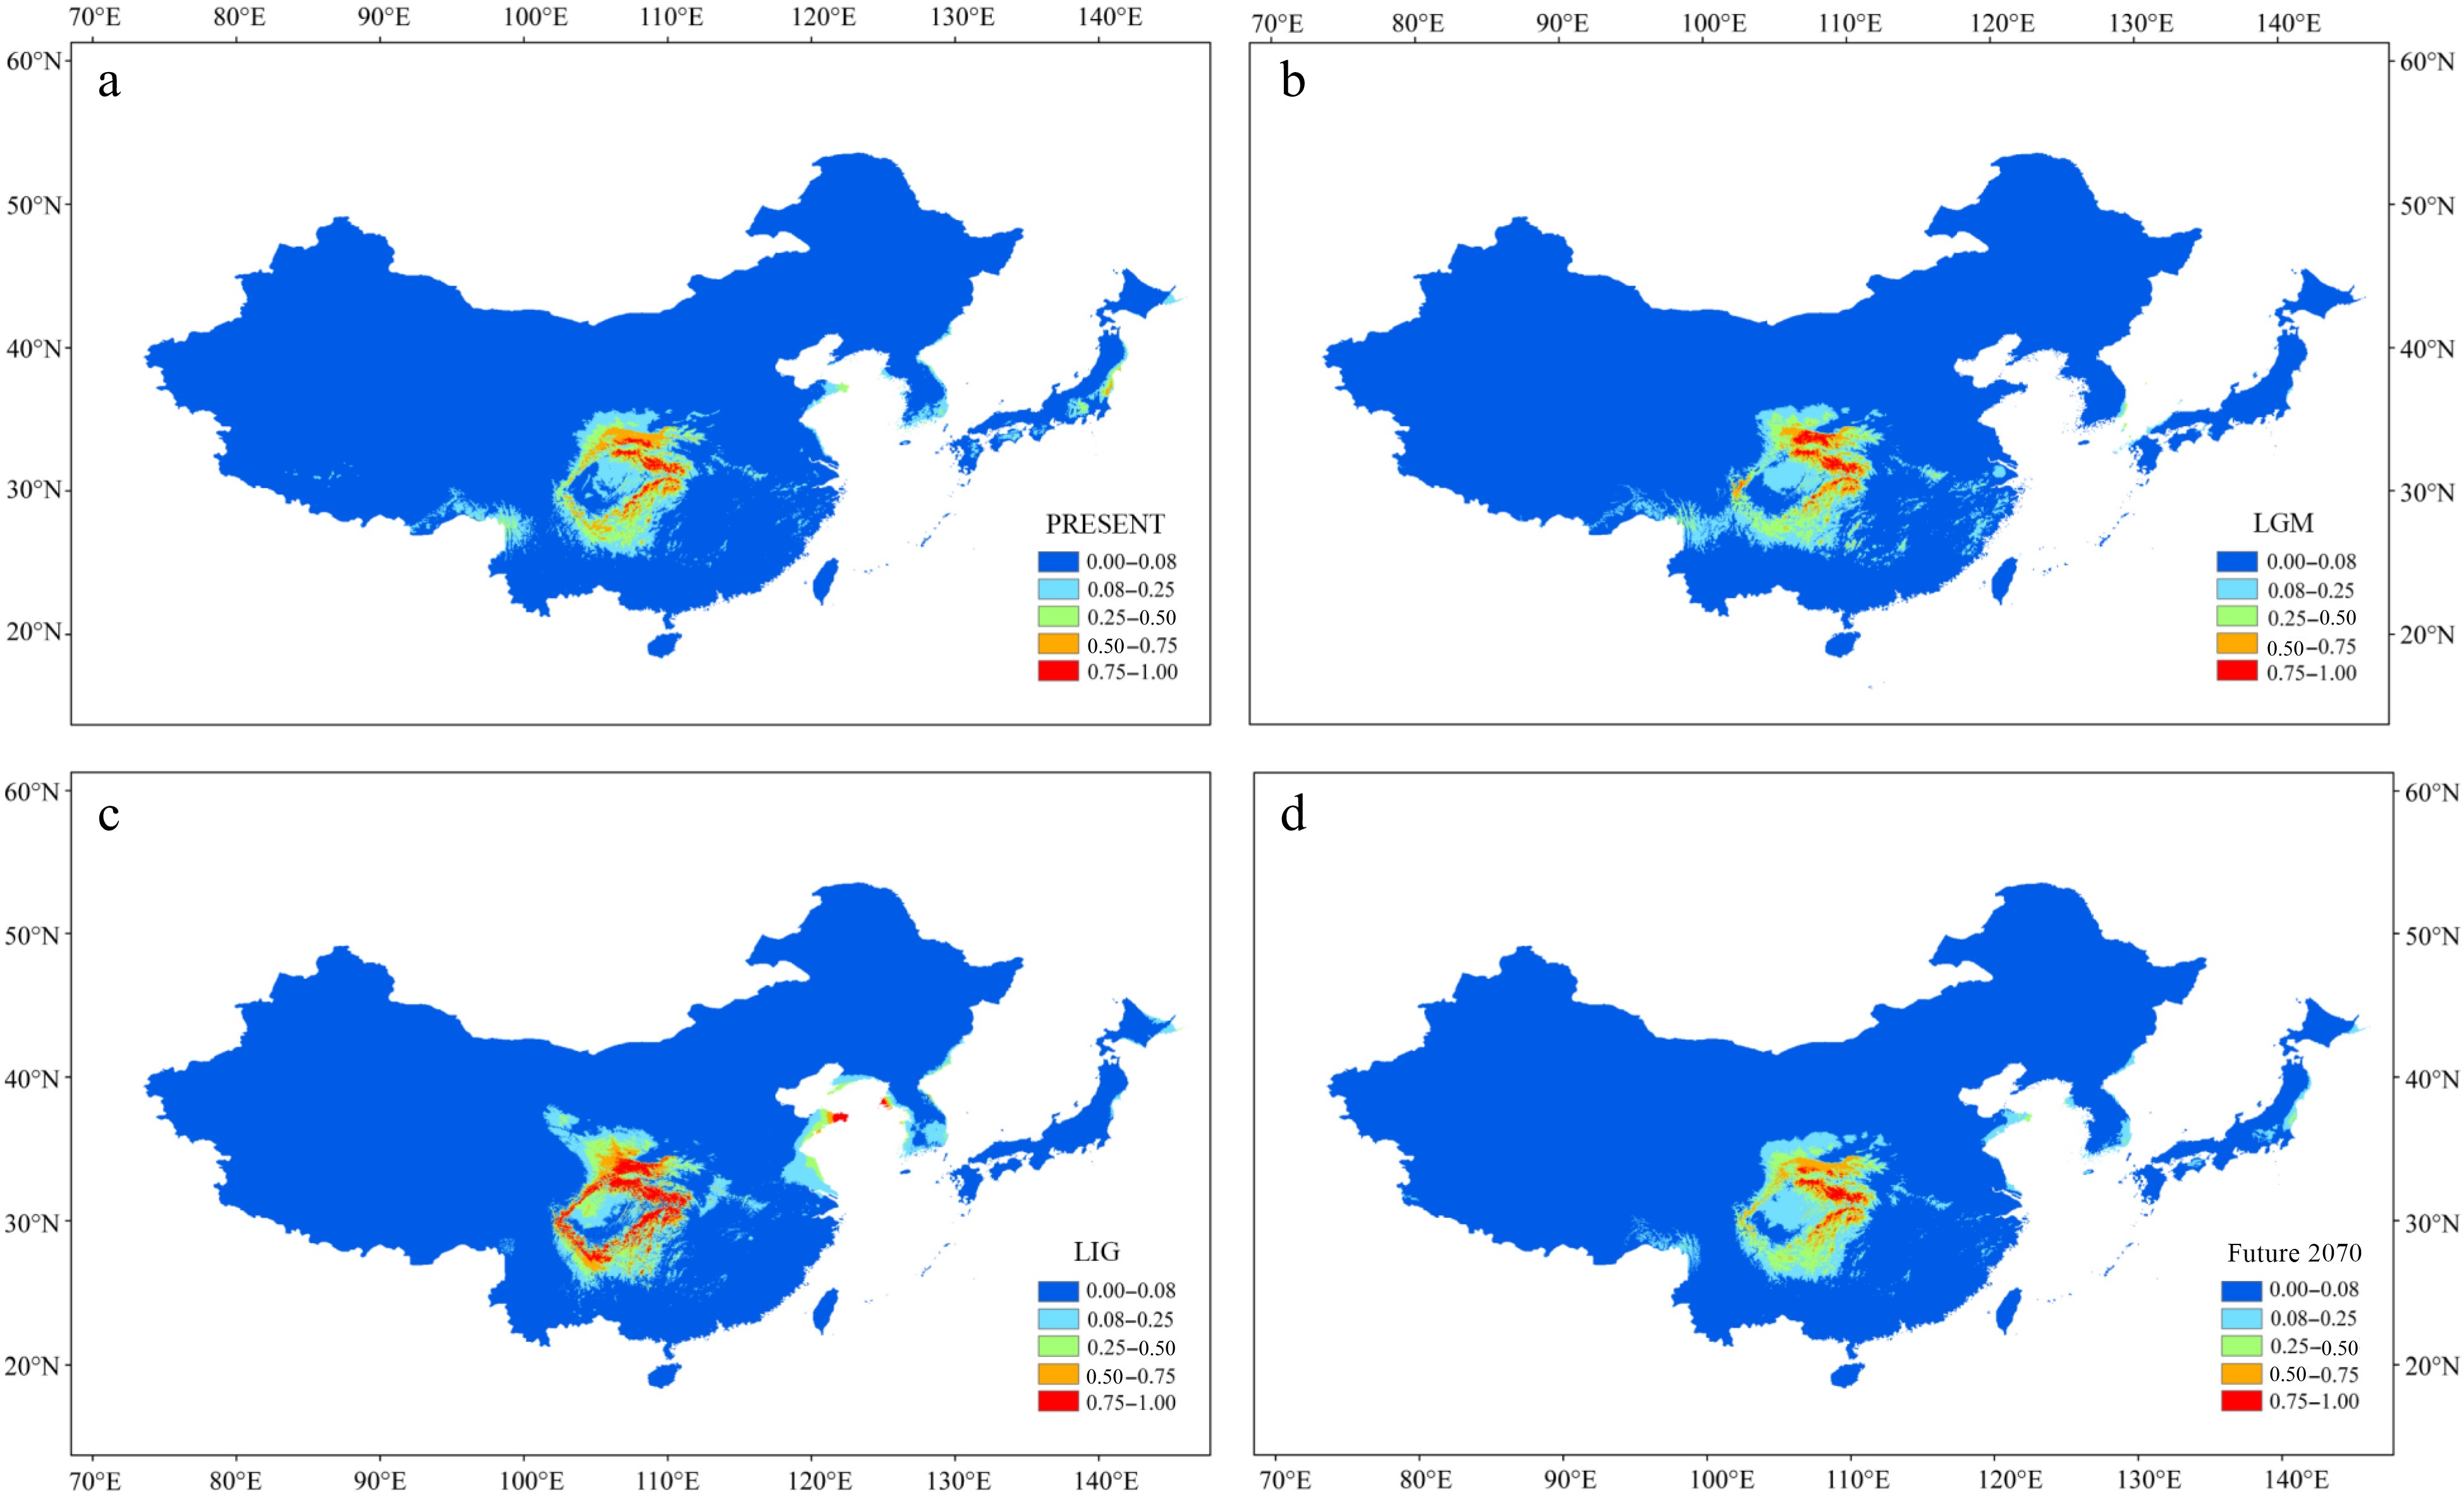
Figure 5.
Results of ecological niche modeling of P. hupehensis in four time periods from past to future. (a) Average projection of the model to present climatic conditions. (b) Average projection of the model to the last glacial maximum (LGM: c. 21 kya BP (before present)). (c) Average projection of the model for the last interglacial (LIG: c. 120–140kya BP). (d) Average projection of the model to the year 2070 (2061–2080) under an intermediate climate warming scenario (RCP 4.5). Colors from blue to red represent the degree of habitat suitability for P. hupehensis survival, from unsuitable to suitable.
-
Code Site Longitude
(°E)Latitude
(°N)RAD-SNPs cpDNA n HO HE π Fis h π × 103 Haplotype (number
of individuals)HH Xian, Shaanxi 107.93 33.87 6 0.199 0.173 0.203 0.007 0 0 H1 (10) HXC Ankang, Shaanxi 109.49 32.72 3 0.207 0.165 0.209 0.004 0.42 0.005 H2 (1), H3 (1), H4 (7) FLC Ankang, Shaanxi 109.4 31.95 5 0.192 0.143 0.174 −0.033 0 0 H5 (9) DSP Baoji, Shaanxi 107.49 33.84 4 0.183 0.144 0.177 −0.013 0 0 H6 (8) QDZ Nanyang, Henan 111.97 33.52 6 0.210 0.175 0.197 −0.027 0.39 0.004 H7 (7), H8 (2) HKC Nanyang, Henan 112.02 33.57 6 0.193 0.184 0.209 0.033 0.5 0 H7 (6), H9 (3) TSG Nanyang, Henan 111.72 33.63 6 0.182 0.171 0.198 0.031 0.33 0 H7 (5), H10 (1) LJL Nanyang, Henan 111.70 33.63 4 0.191 0.164 0.207 0.027 0 0 H7 (4) LYG Tianshui, Gansu 106.1 34.23 5 0.189 0.152 0.177 0.021 0 0 H1 (10) YPC Longnan, Gansu 106.23 33.67 5 0.206 0.149 0.170 0.068 0 0 H11 (7) HJG Kangxian, Gansu 105.51 33.39 5 0.184 0.141 0.162 0.041 0 0 H12 (7) MYG Yangba, Gansu 105.74 33.03 6 0.191 0.170 0.196 0.010 0 0 H13 (6) SNJ Shennongjia, Hubei 110.92 31.65 7 0.216 0.199 0.217 0.004 0 0 H14 (7) XJZ Shennongjia, Hubei 110.58 31.59 11 0.209 0.209 0.220 0.033 0.47 0.067 H15 (7), H16 (3) SHJZ Enshi, Hubei 109.8 30.16 11 0.206 0.179 0.194 −0.026 0.76 0.067 H17 (5), H18 (1), H19 (2),
H20 (1), H21 (1)JSZ Nanchuan, Chongqing 107.14 29.02 7 0.213 0.212 0.223 0.029 — — DFX Bijie, Guizhou 105.88 27.33 12 0.224 0.212 0.222 −0.001 0.36 0.004 H22 (8), H23 (2) NYX Bijie, Guizhou 105.47 26.7 13 0.227 0.195 0.204 −0.047 0 0 H24 (10) AVERAGE 0.201 0.174 0.198 −0.006 0.19 0.009 n, the number of samples used for RAD-seq analysis; HO, observed heterozygosity; HE, expected heterozygosity; π, nucleotide diversity; Fis, inbreeding coefficient; h, haplotype diversity. Table 1.
Sample codes, sample locations, and genetic diversity indices for 18 populations of Pterocarya hupehensis based on RAD-seq data and cpDNA data.
-
Source of variation cpDNA RAD-SNPs d.f. Percentage variation (%) Fixation indices d.f. Percentage variation (%) Fixation indices Among lineages 1 75.05 FCT = 0.75 1 22.22 FCT = 0.22 Among populations within lineages 15 22.64 FSC = 0.91 16 11.47 FSC = 0.15 Within populations 124 2.31 FST = 0.98 226 66.31 FST = 0.34 Table 2.
Analyses of molecular variance (AMOVA) based on cpDNA data and RAD-seq data for Pterocarya hupehensis from western and eastern lineages.
Figures
(5)
Tables
(2)