-
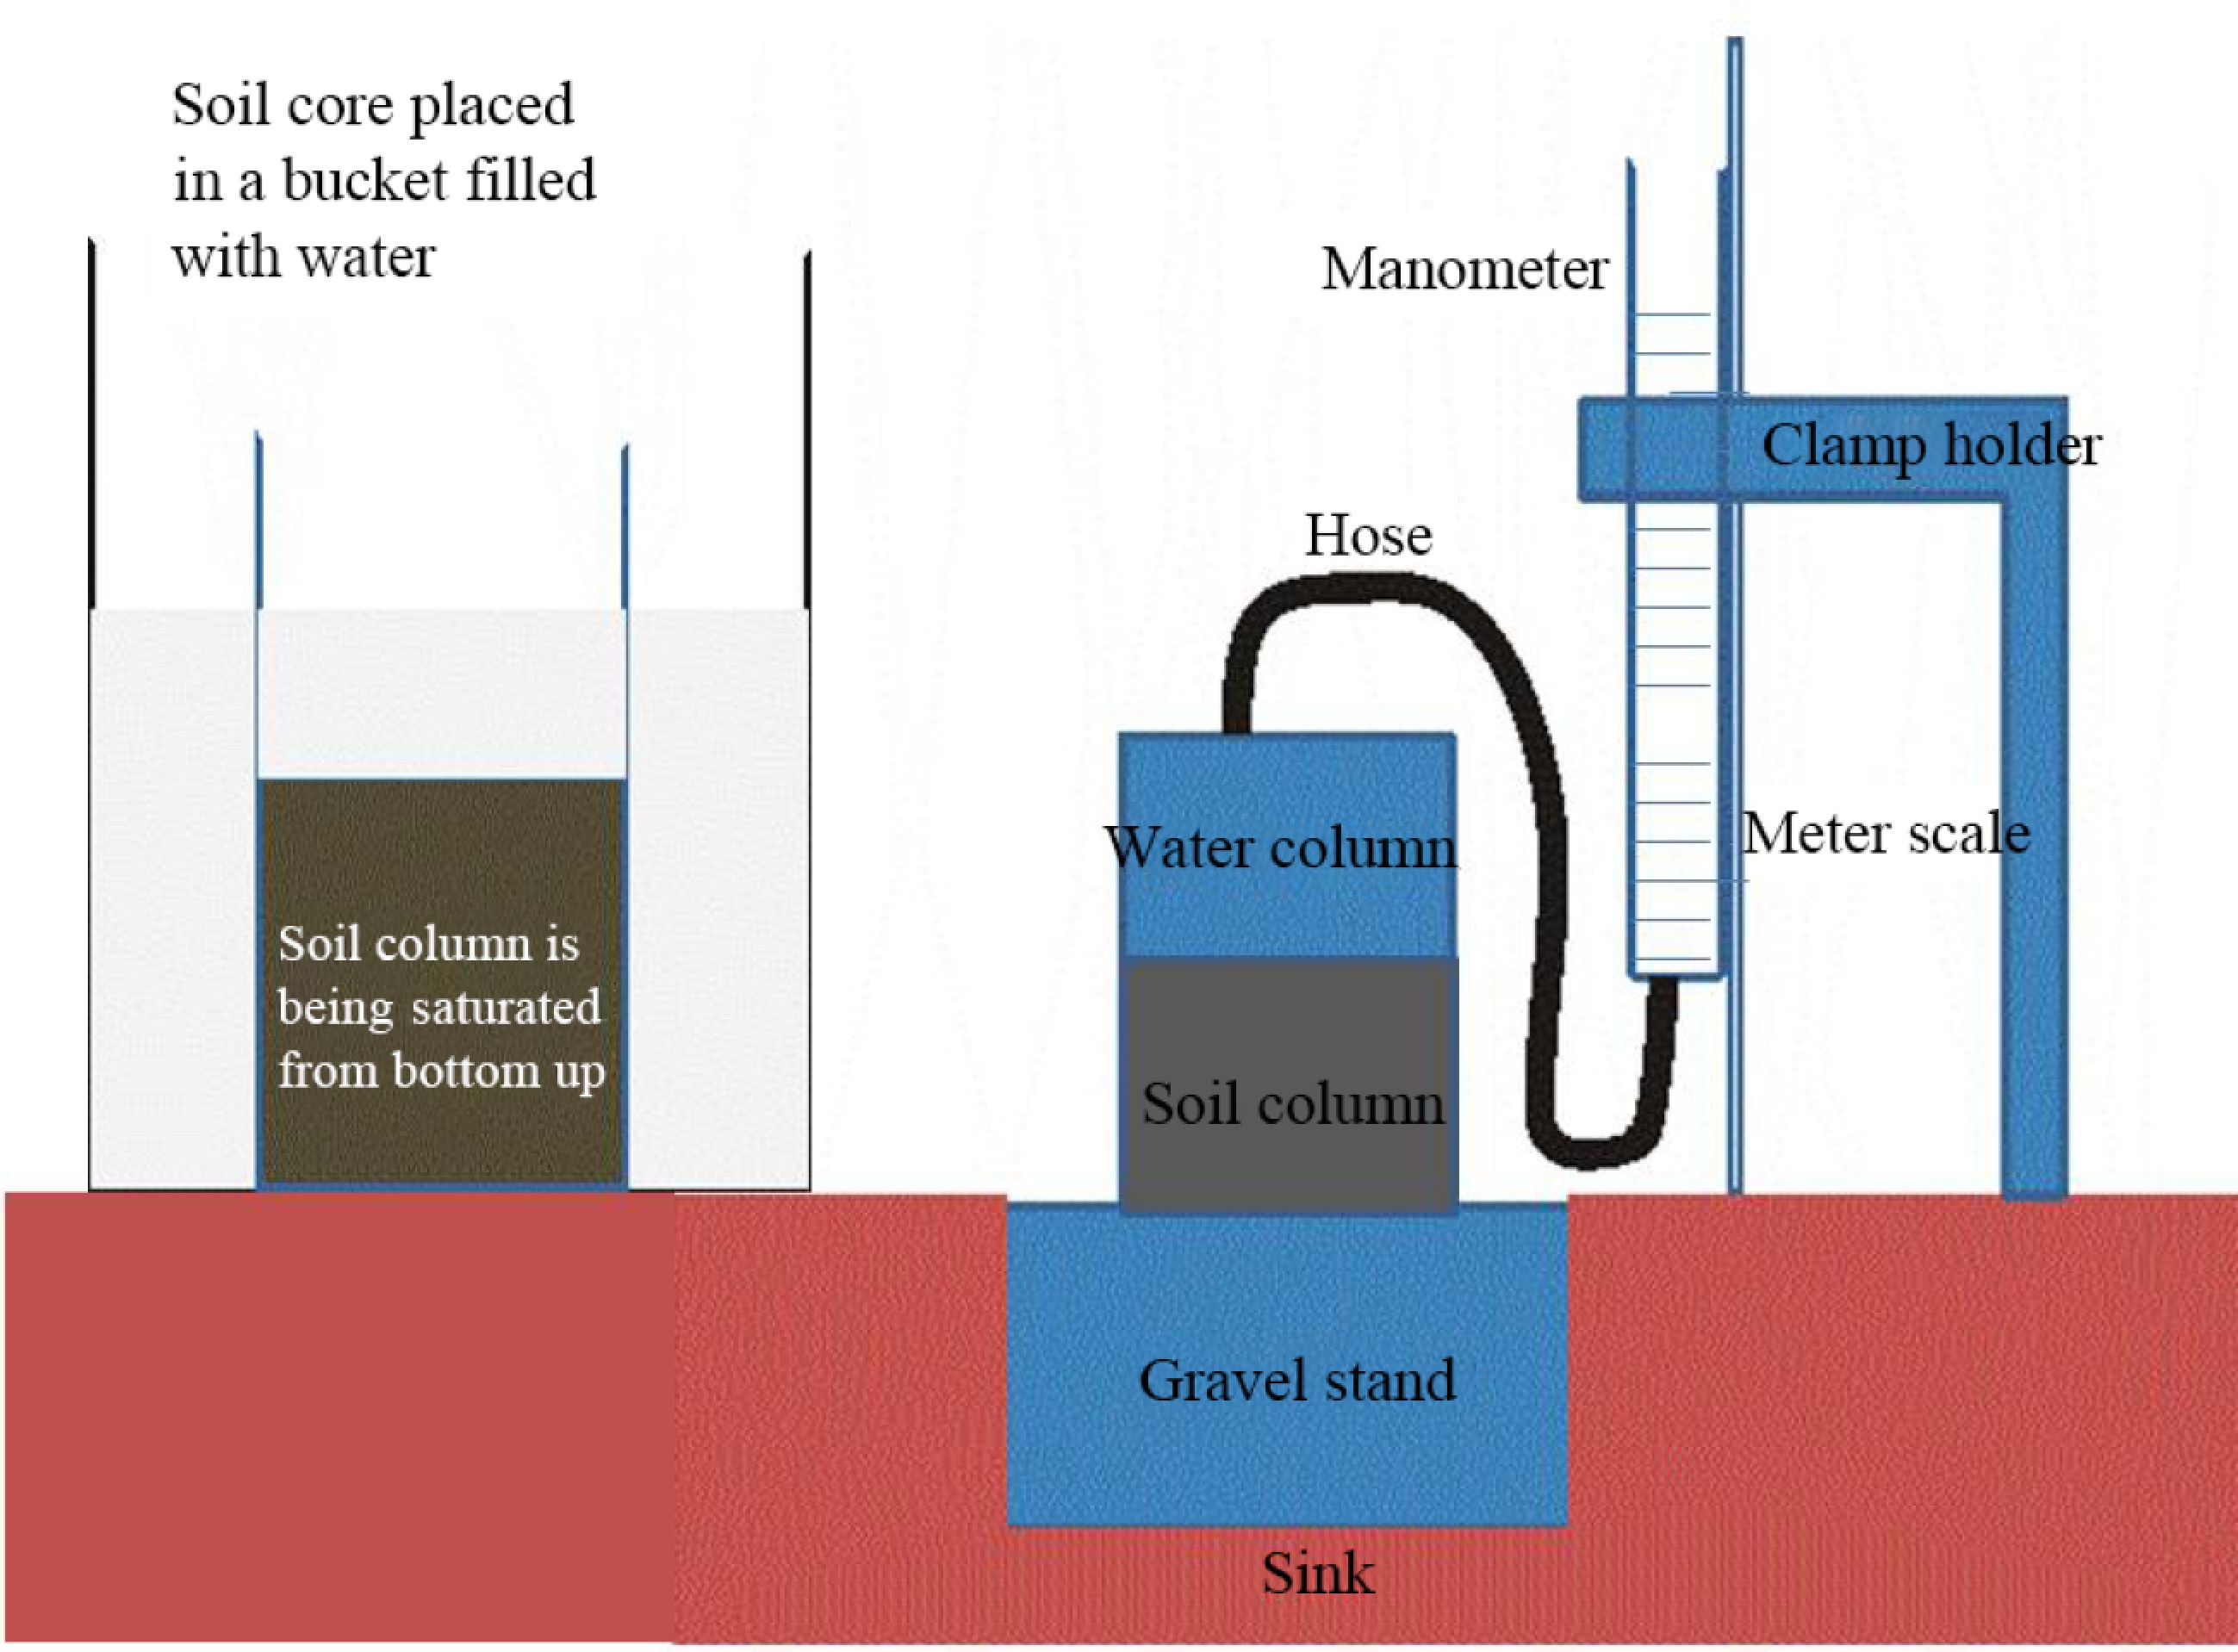
Figure 1.
Laboratory setup of the procedure for saturated hydraulic conductivity.
-
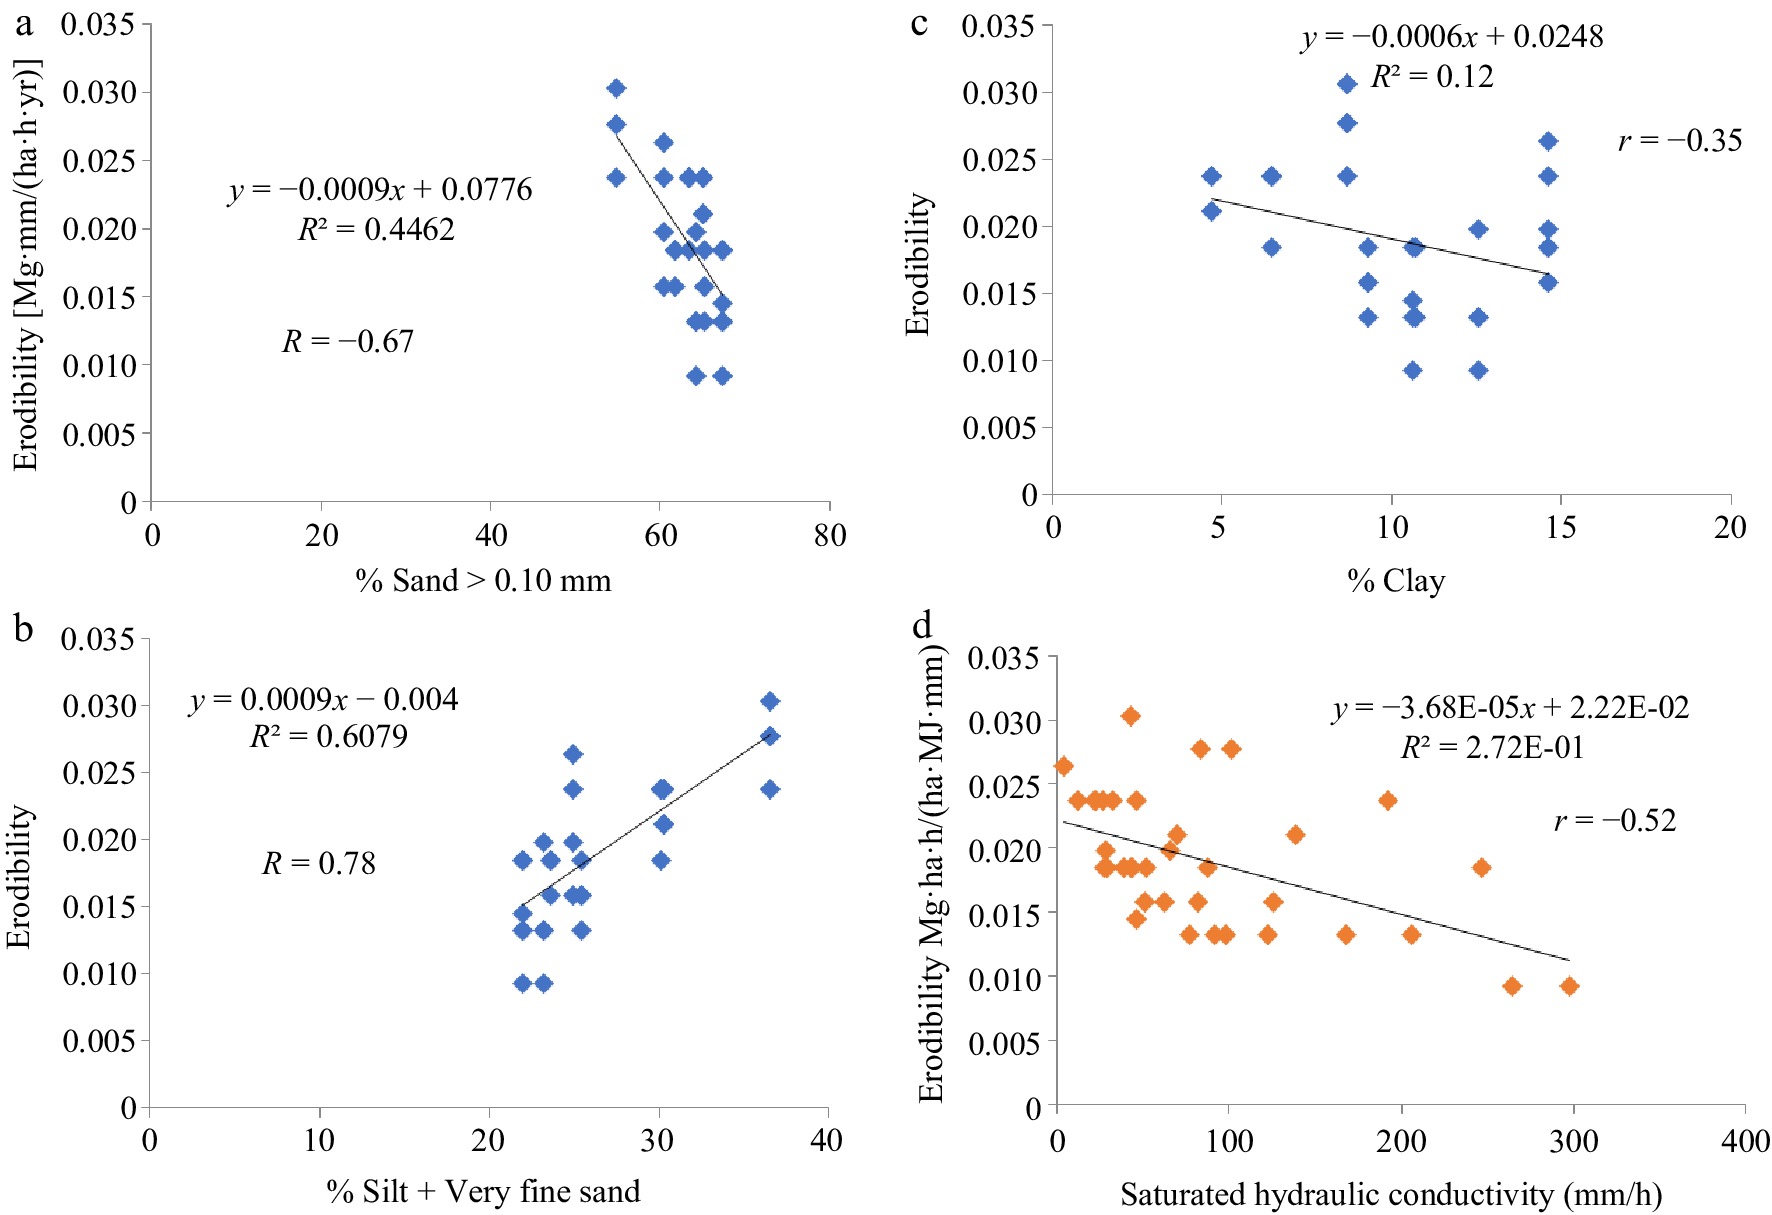
Figure 2.
Relationship between erodibility and soil particle size fractions and saturated hydraulic conductivity.
-
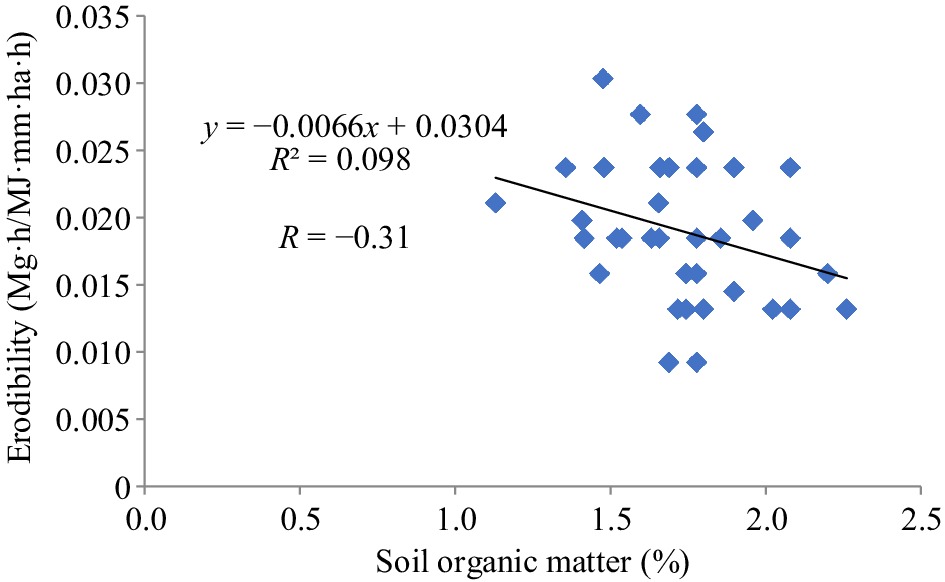
Figure 3.
Relationship between erodibility and soil organic carbon.
-
Tillage system Very fine sand (%) Fine sand (%) Medium sand (%) Coarse sand (%) Very coarse sand (%) Silt
(%)Clay
(%)Total porosity (%) Water storage (mm) Saturated hydraulic conductivity (mm/h) Erodibility
× 10−3 (Mg·h·MJ−1·mm−1)Control 4.0 11.2 27.0 24.0 5.9 22.4 5.3 45 48 634 13 No-till 4.6 11.6 22.8 21.2 5.5 27.7 6.6 46 32.6 585 24 Minimum tillage 3.5 10.9 23.5 22.3 6.5 20.0 13.3 39 44 349 18 Conventional tillage 3.7 10.0 21.8 23.3 10.9 19.8 10.8 42 23.1 127 14 Lsd (0.05) 1.8 2.5 6.2 5.5 6.7 6.9 2.3 5 3 46 7 CV (%) 22.9 11.5 13.0 12.1 46.3 15.3 12.9 6.4 15.2 22 15.4 Table 1.
Effect of tillage systems on sand fractions, total porosity, root water storage, hydraulic conductivity and soil erodibility.
-
Treatment Soil erodibility values
× 10−3 (Mg·h·MJ−1·mm−1)Organic carbon
(%)Control 17 1.65 ½ PM + ½ NPK 19 2.19 Poultry manure 19 2.67 Mineral NPK 21 1.82 LSDP<0.05 2 0.20 % CV 15.4 8.10 Table 2.
Effect of soil amendments on soil organic carbon and soil erodibility.
-
Tillage practice Soil erodibility values (Mg·h·MJ−1·mm−1) No-amendment ½ NPK + ½ PM NPK PM No-till 0.021 0.025 0.026 0.024 Minimum tillage 0.019 0.019 0.02 0.015 Conventional tillage 0.01 0.014 0.017 0.016 Lsd (0.05) 0.007 CV (%) 12.1 Table 3.
Effect of tillage and soil amendments interactions on soil erosion susceptibility.
Figures
(3)
Tables
(3)