-
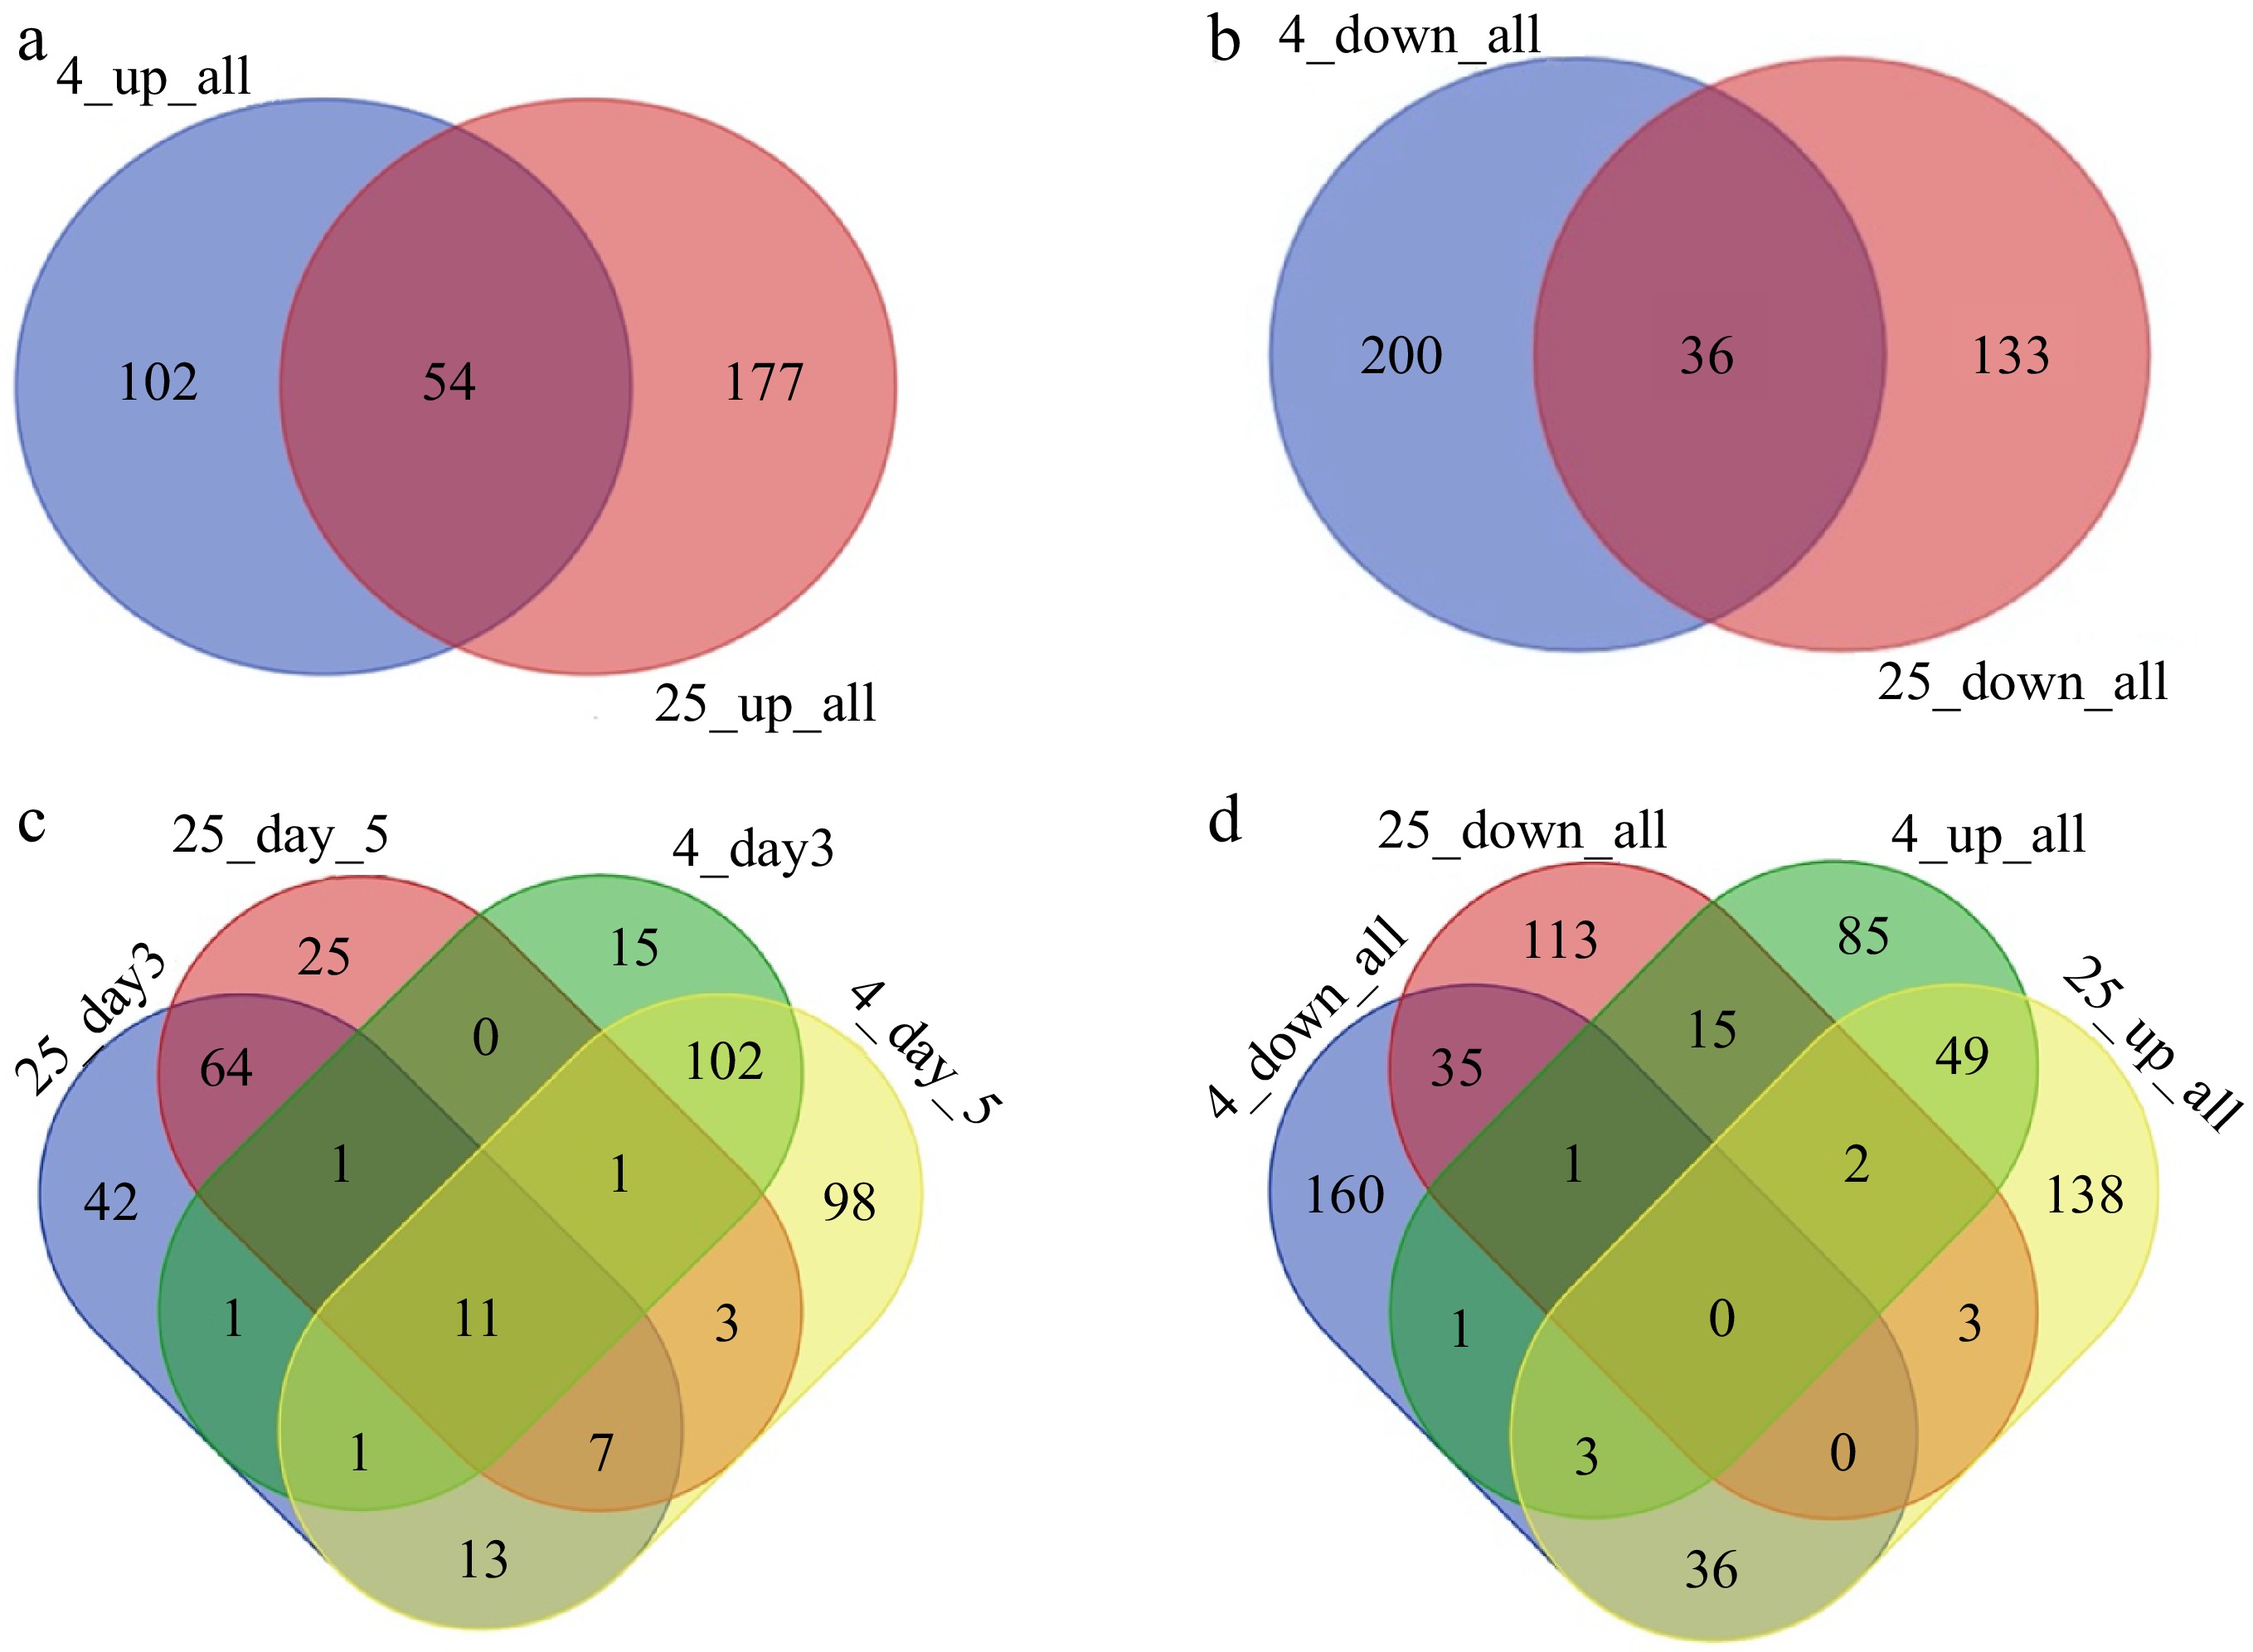
Figure 1.
The number of differentially expressed proteins under different storage conditions. (a) Venn diagram illustrating all up-regulated DEPs between 25 and 4 °C after storage for 3 or 5 d. (b) Venn diagram illustrating all the down-regulated DEPs between 25 and 4 °C. (c) The number of DEPs at different timepoints (days 3 and 5, compared to day 1) in the 25 and 4 °C treatments. (d) Venn diagram of the DEPs between the warm and cold storage conditions for all points of time.
-
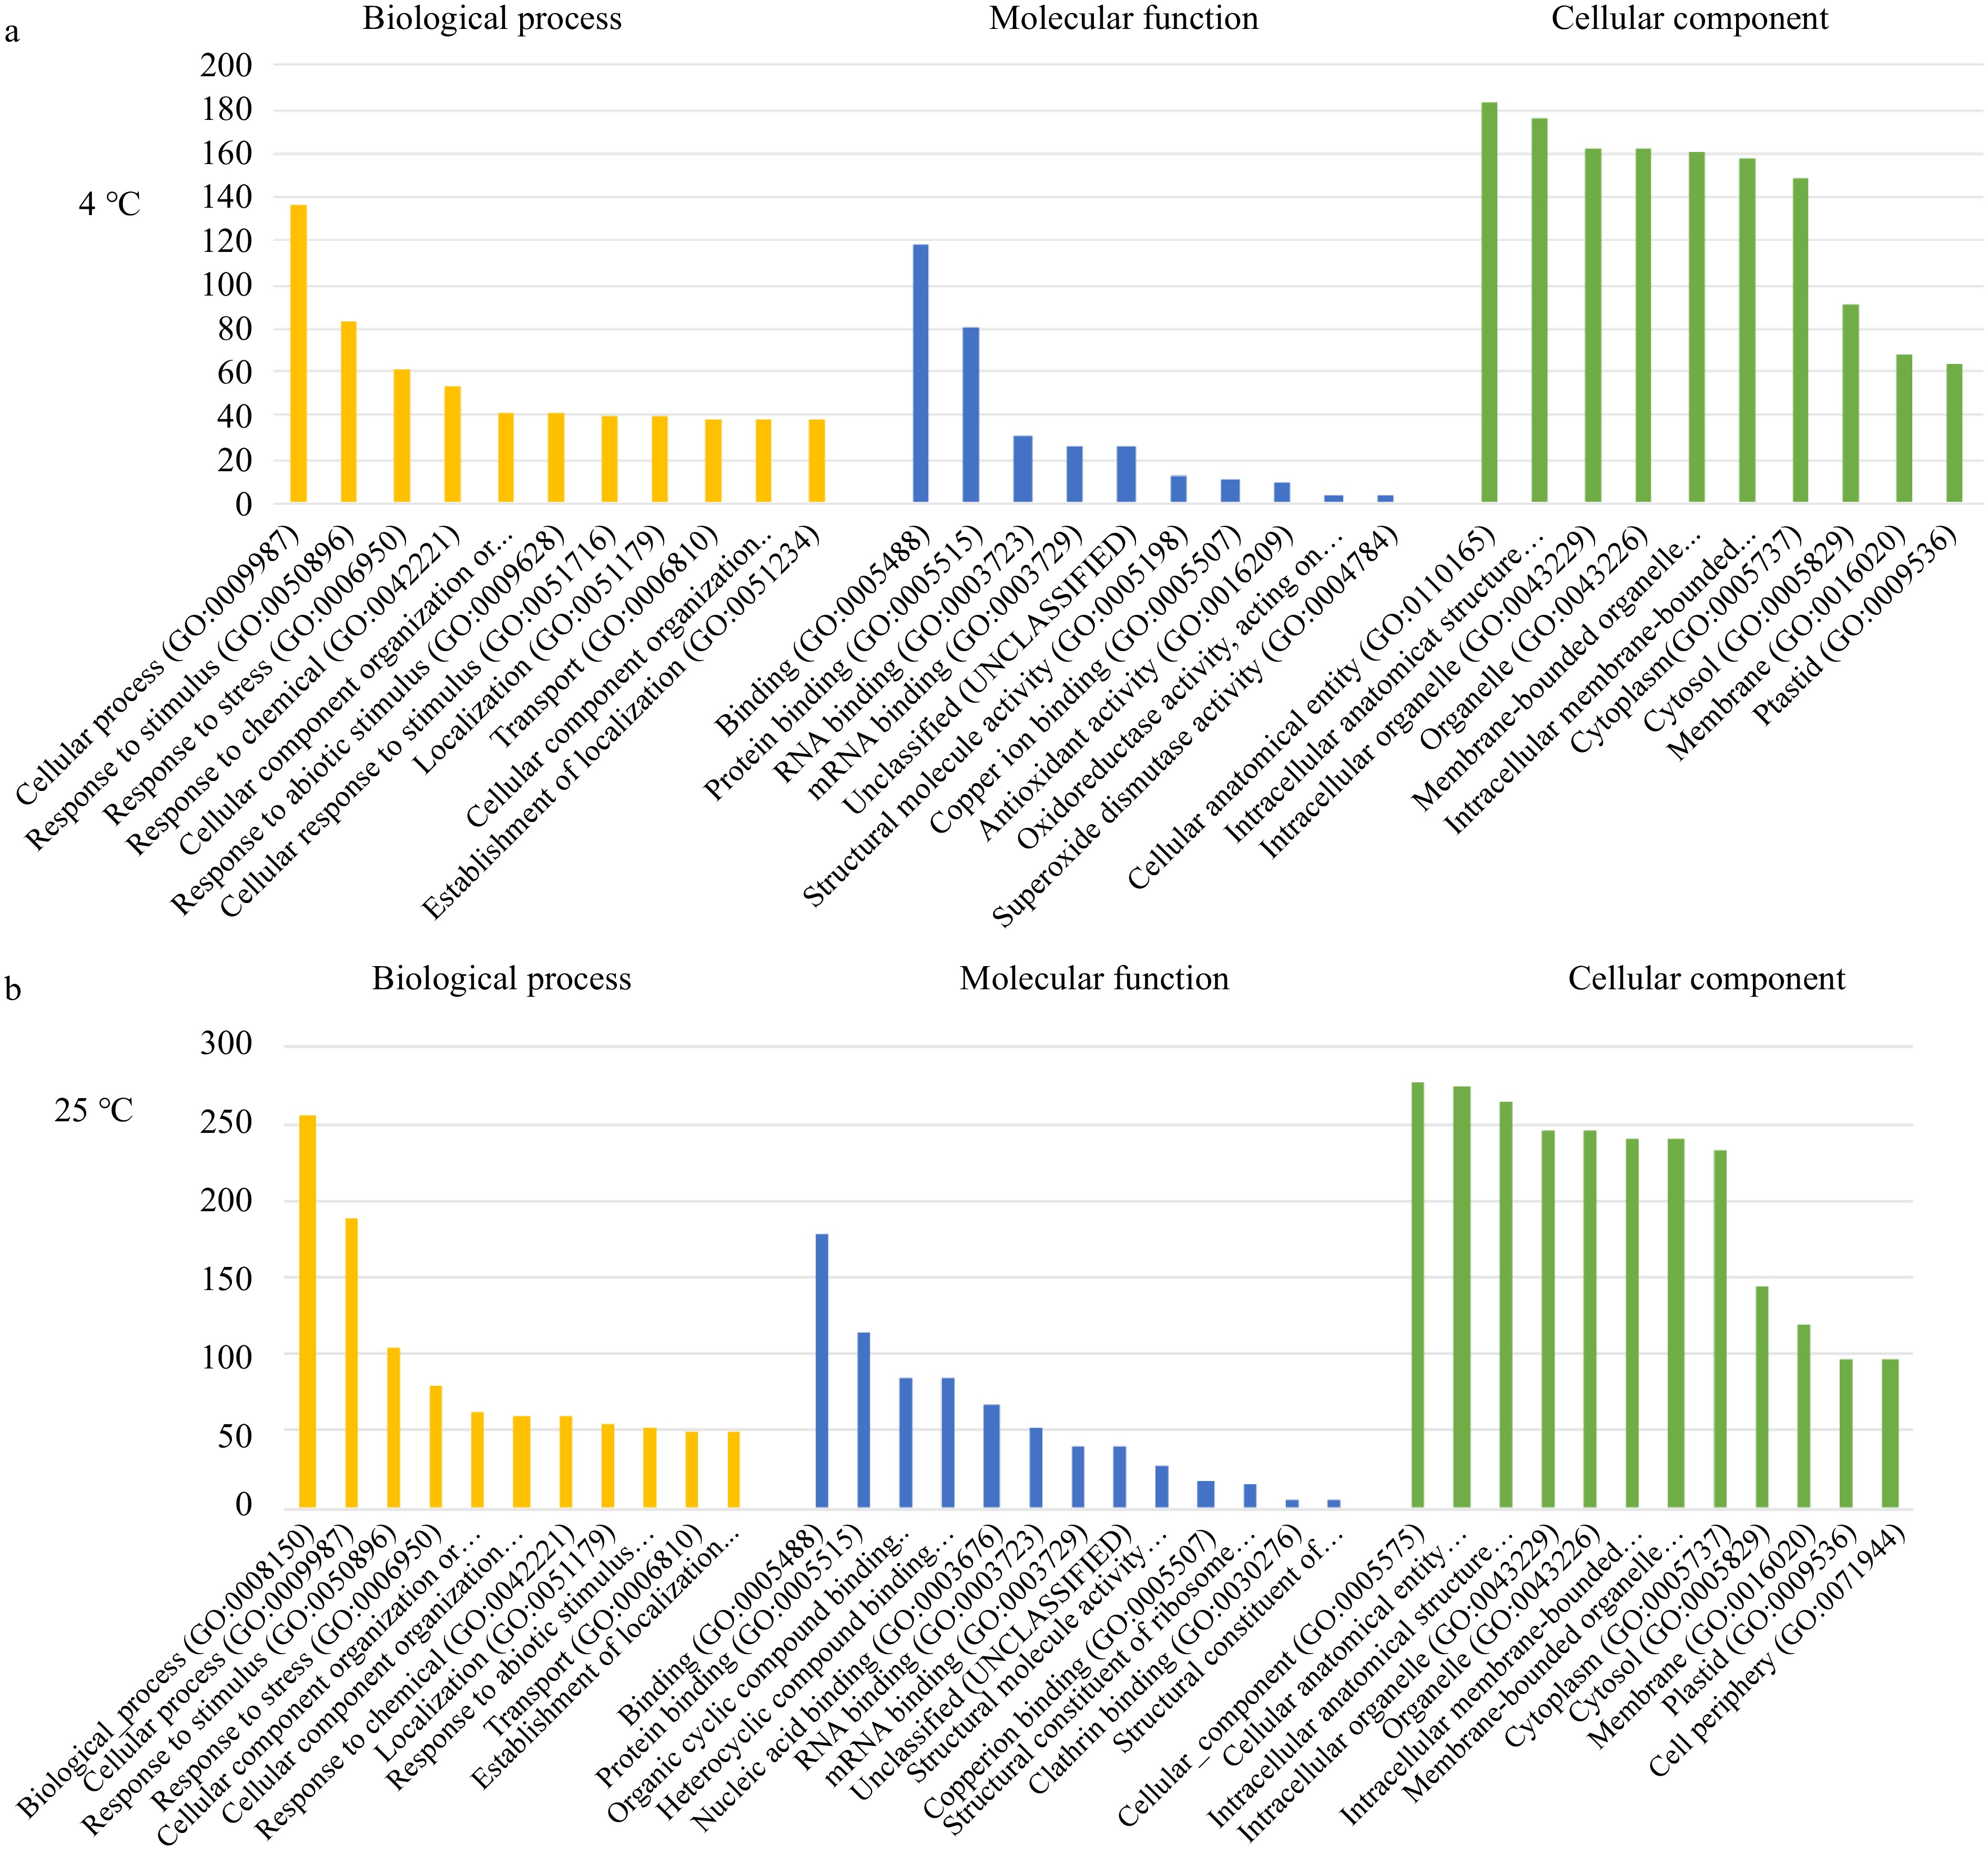
Figure 2.
Gene Ontology (GO) enrichment analysis of broccoli DEPs identified by comparing day 5 to day 1 of storage at (a) 4 °C and (b) 25 °C. The y-axis is the number of genes enriched in each individual GO term categories.
-
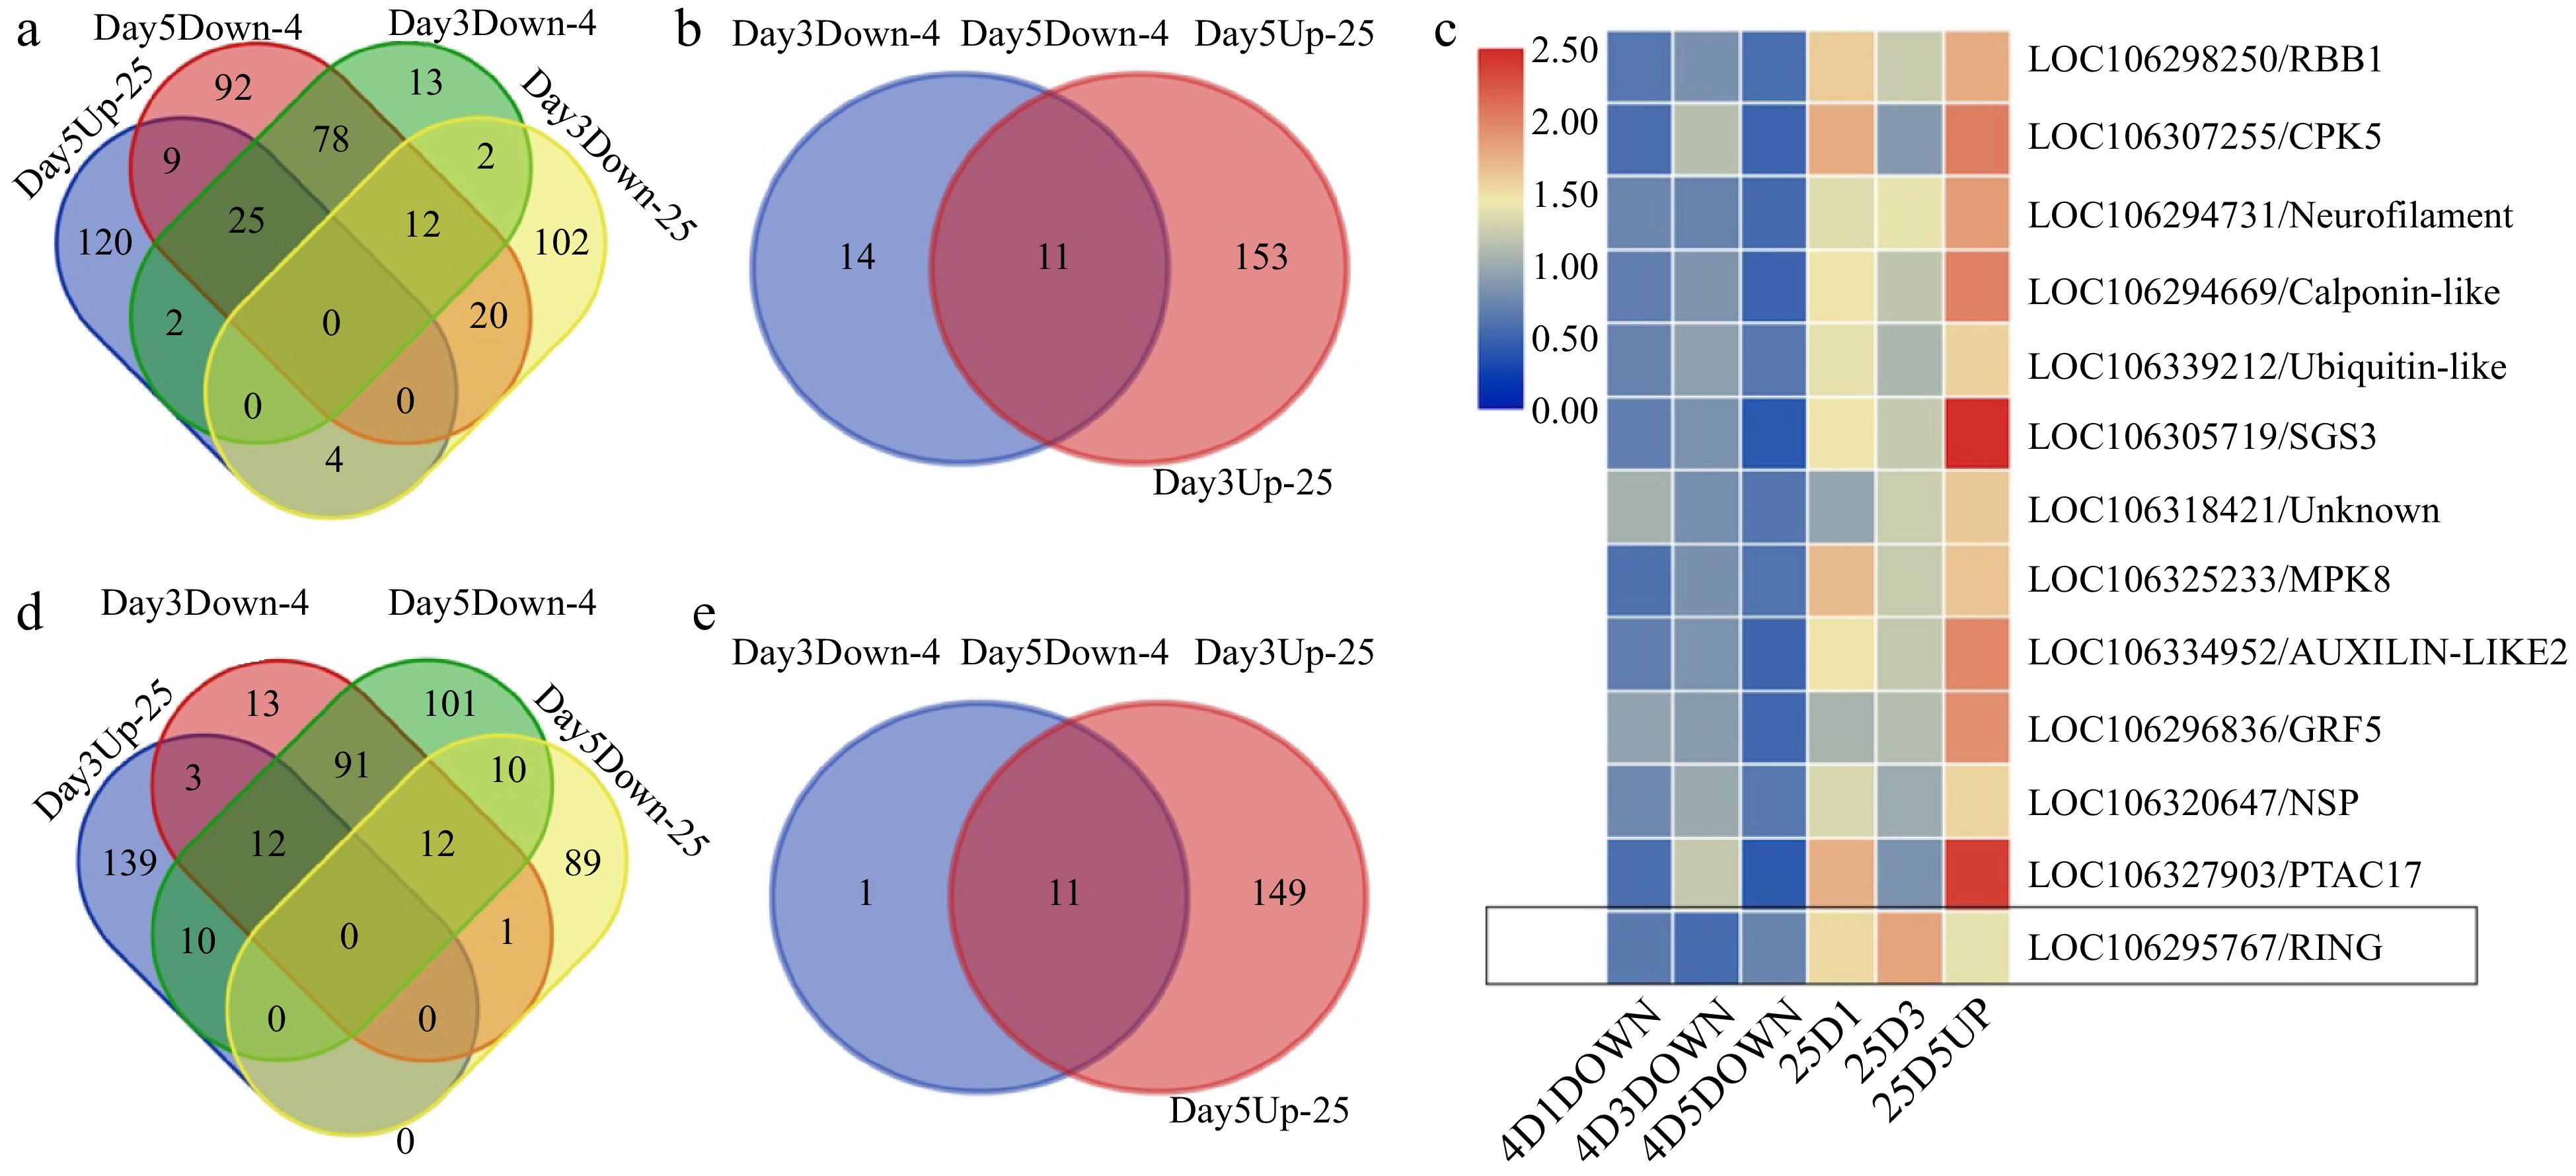
Figure 3.
Proteins showing oppositely regulated expression patterns in different temperature treatments. (a) Proteins that were up-regulated at day 5 during room temperature storage while being down-regulated at day 3 during room temperature storage as well as during cold storage. (b) Proteins that were up-regulated at day 3 and day 5 during the room temperature storage but were down-regulated during the cold storage. (c) A heat map illustrating the oppositely regulated expression patterns of proteins during room temperature or cold storage. The LOC106295767, a ring finger gene, was highlighted in the black box showing the down regulation in cold storage while up regulation during room temperature storage. (d) Proteins that were up-regulated at day 3 during room temperature storage while being down-regulated at day 3 during room temperature storage as well as during cold storage. (e) Proteins that were up-regulated at day 3 and day 5 during the room temperature storage but were down-regulated during the cold storage.
-
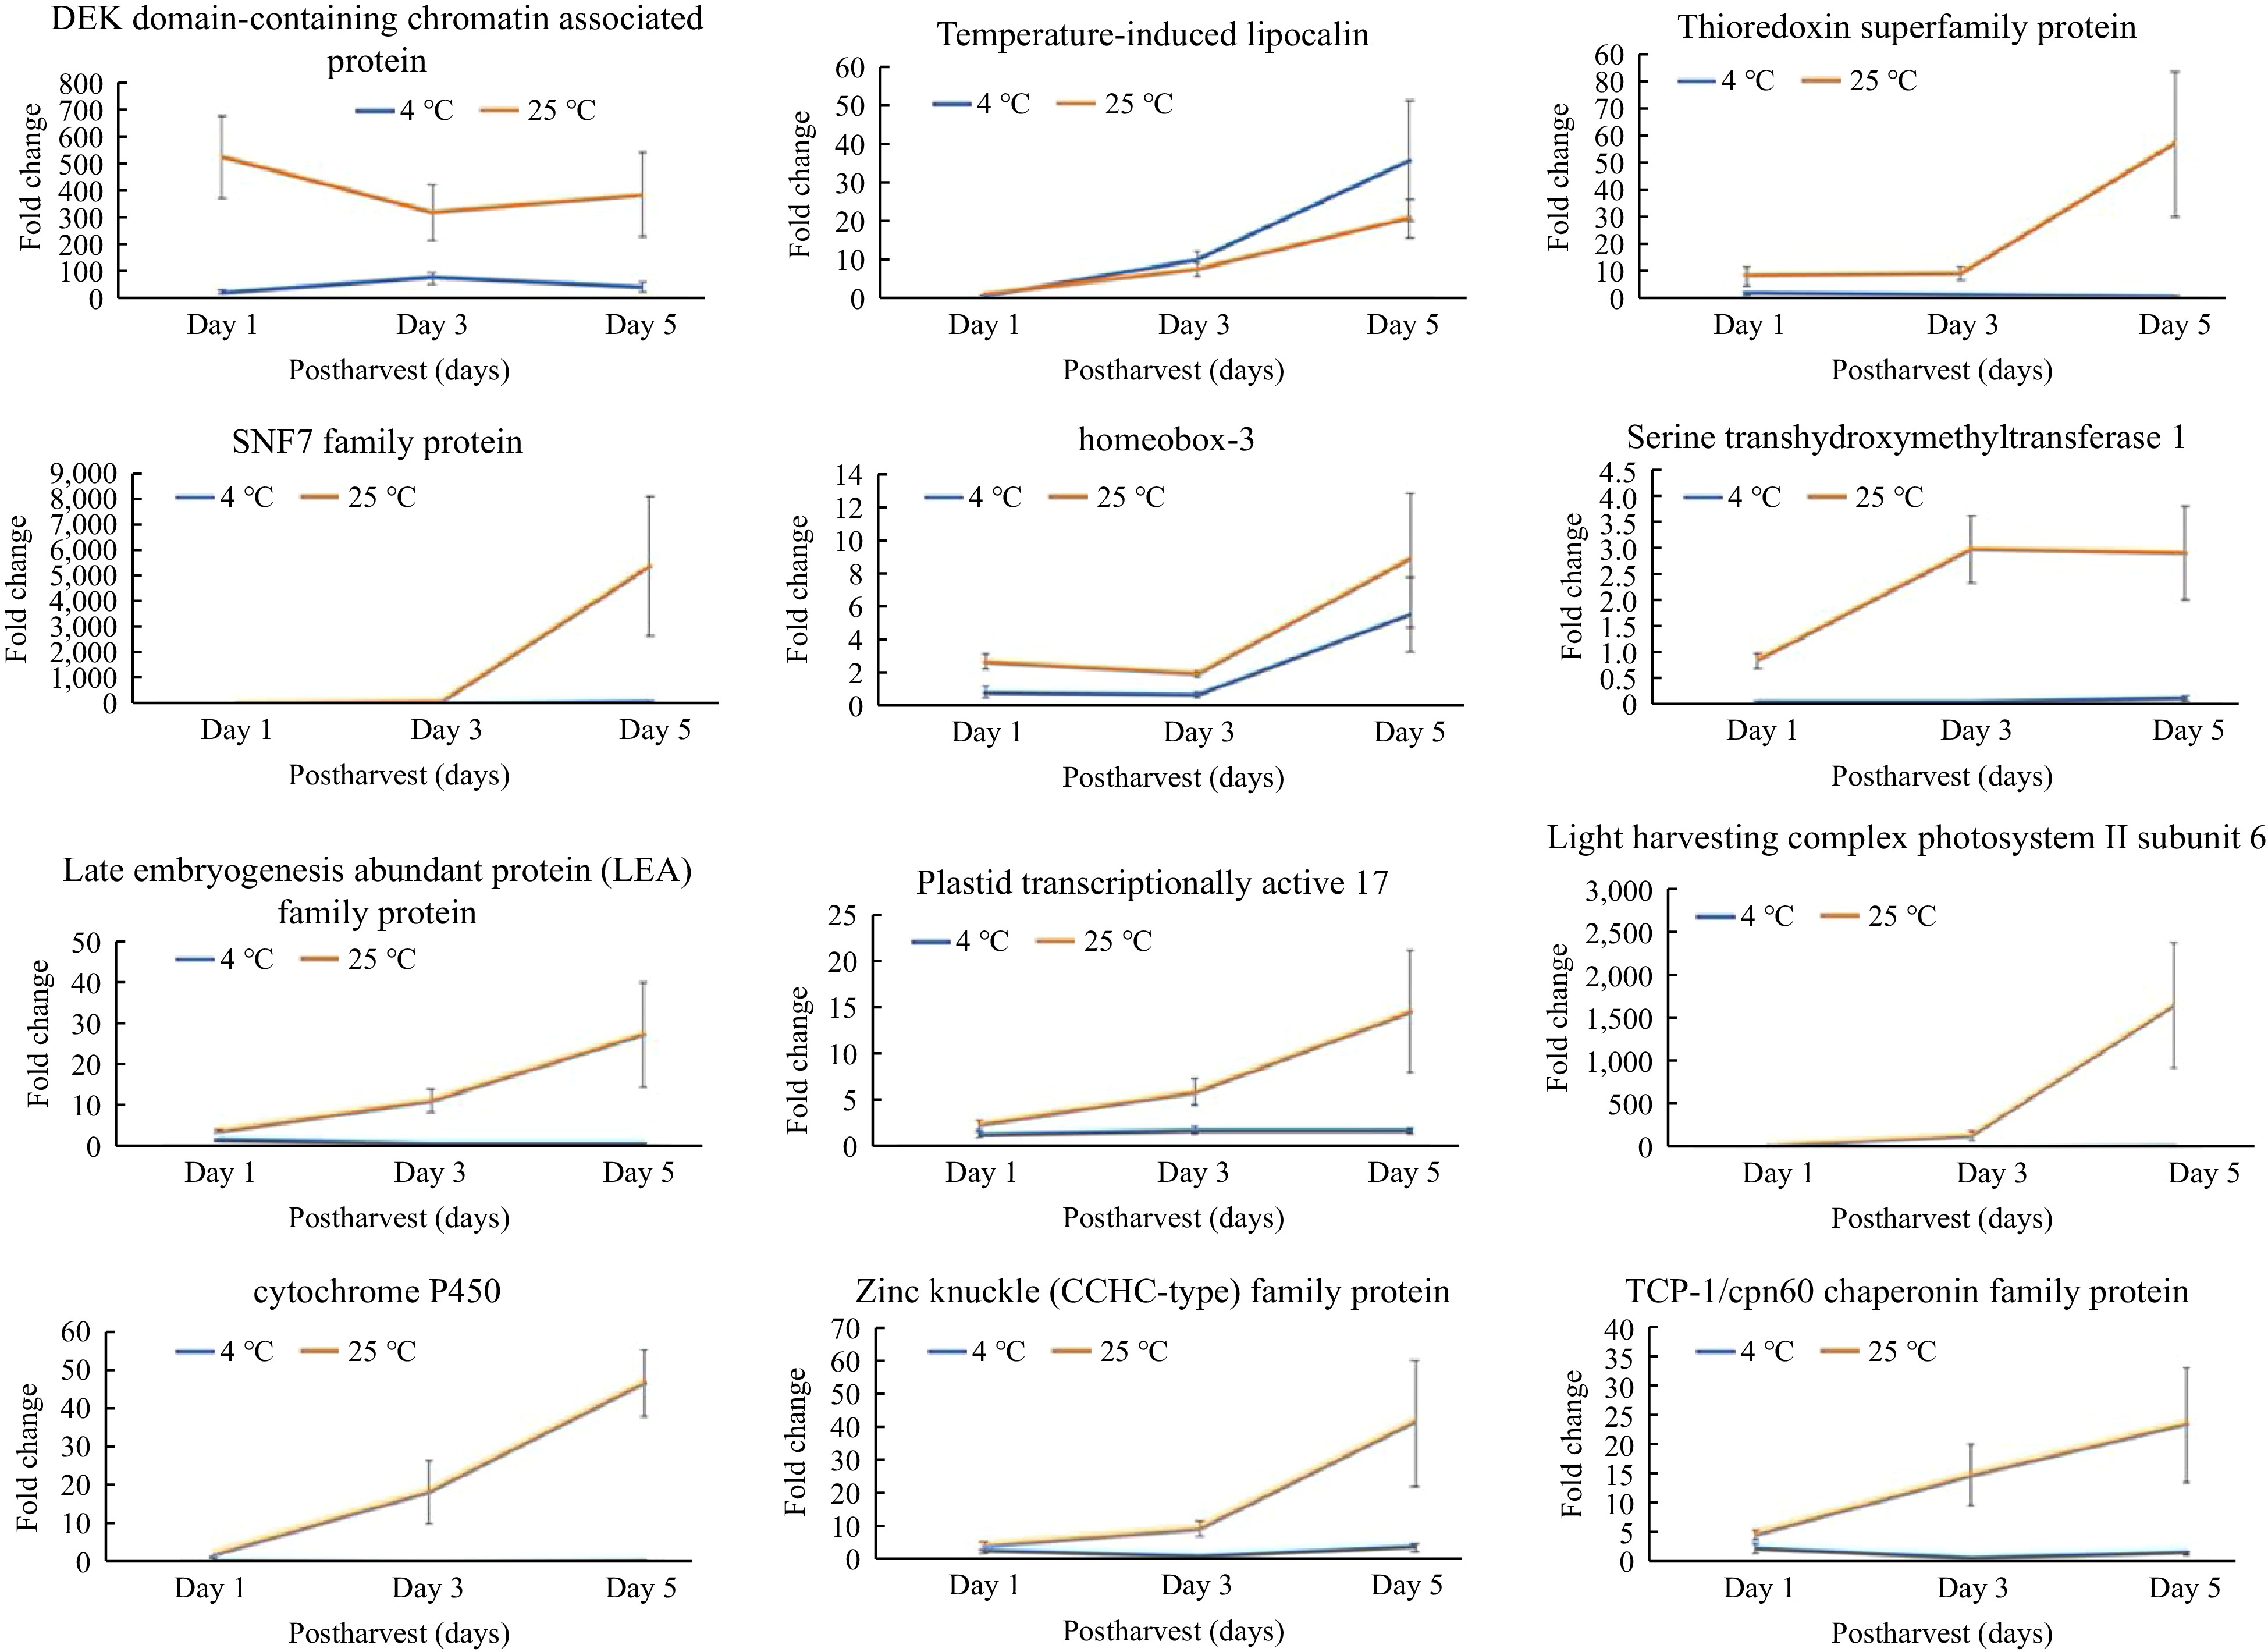
Figure 4.
Relative transcript levels of genes encoding differentially expressed proteins (DEPs) observed during postharvest storage of broccoli. Relative transcript data from qRT-PCR were normalized to actin as an endogenous control using the formula of ΔΔCᴛ. The y-axis is relative expression of fold change to the housekeeping genes BoACTIN. Values of transcript expression are shown as average ± SE.
-
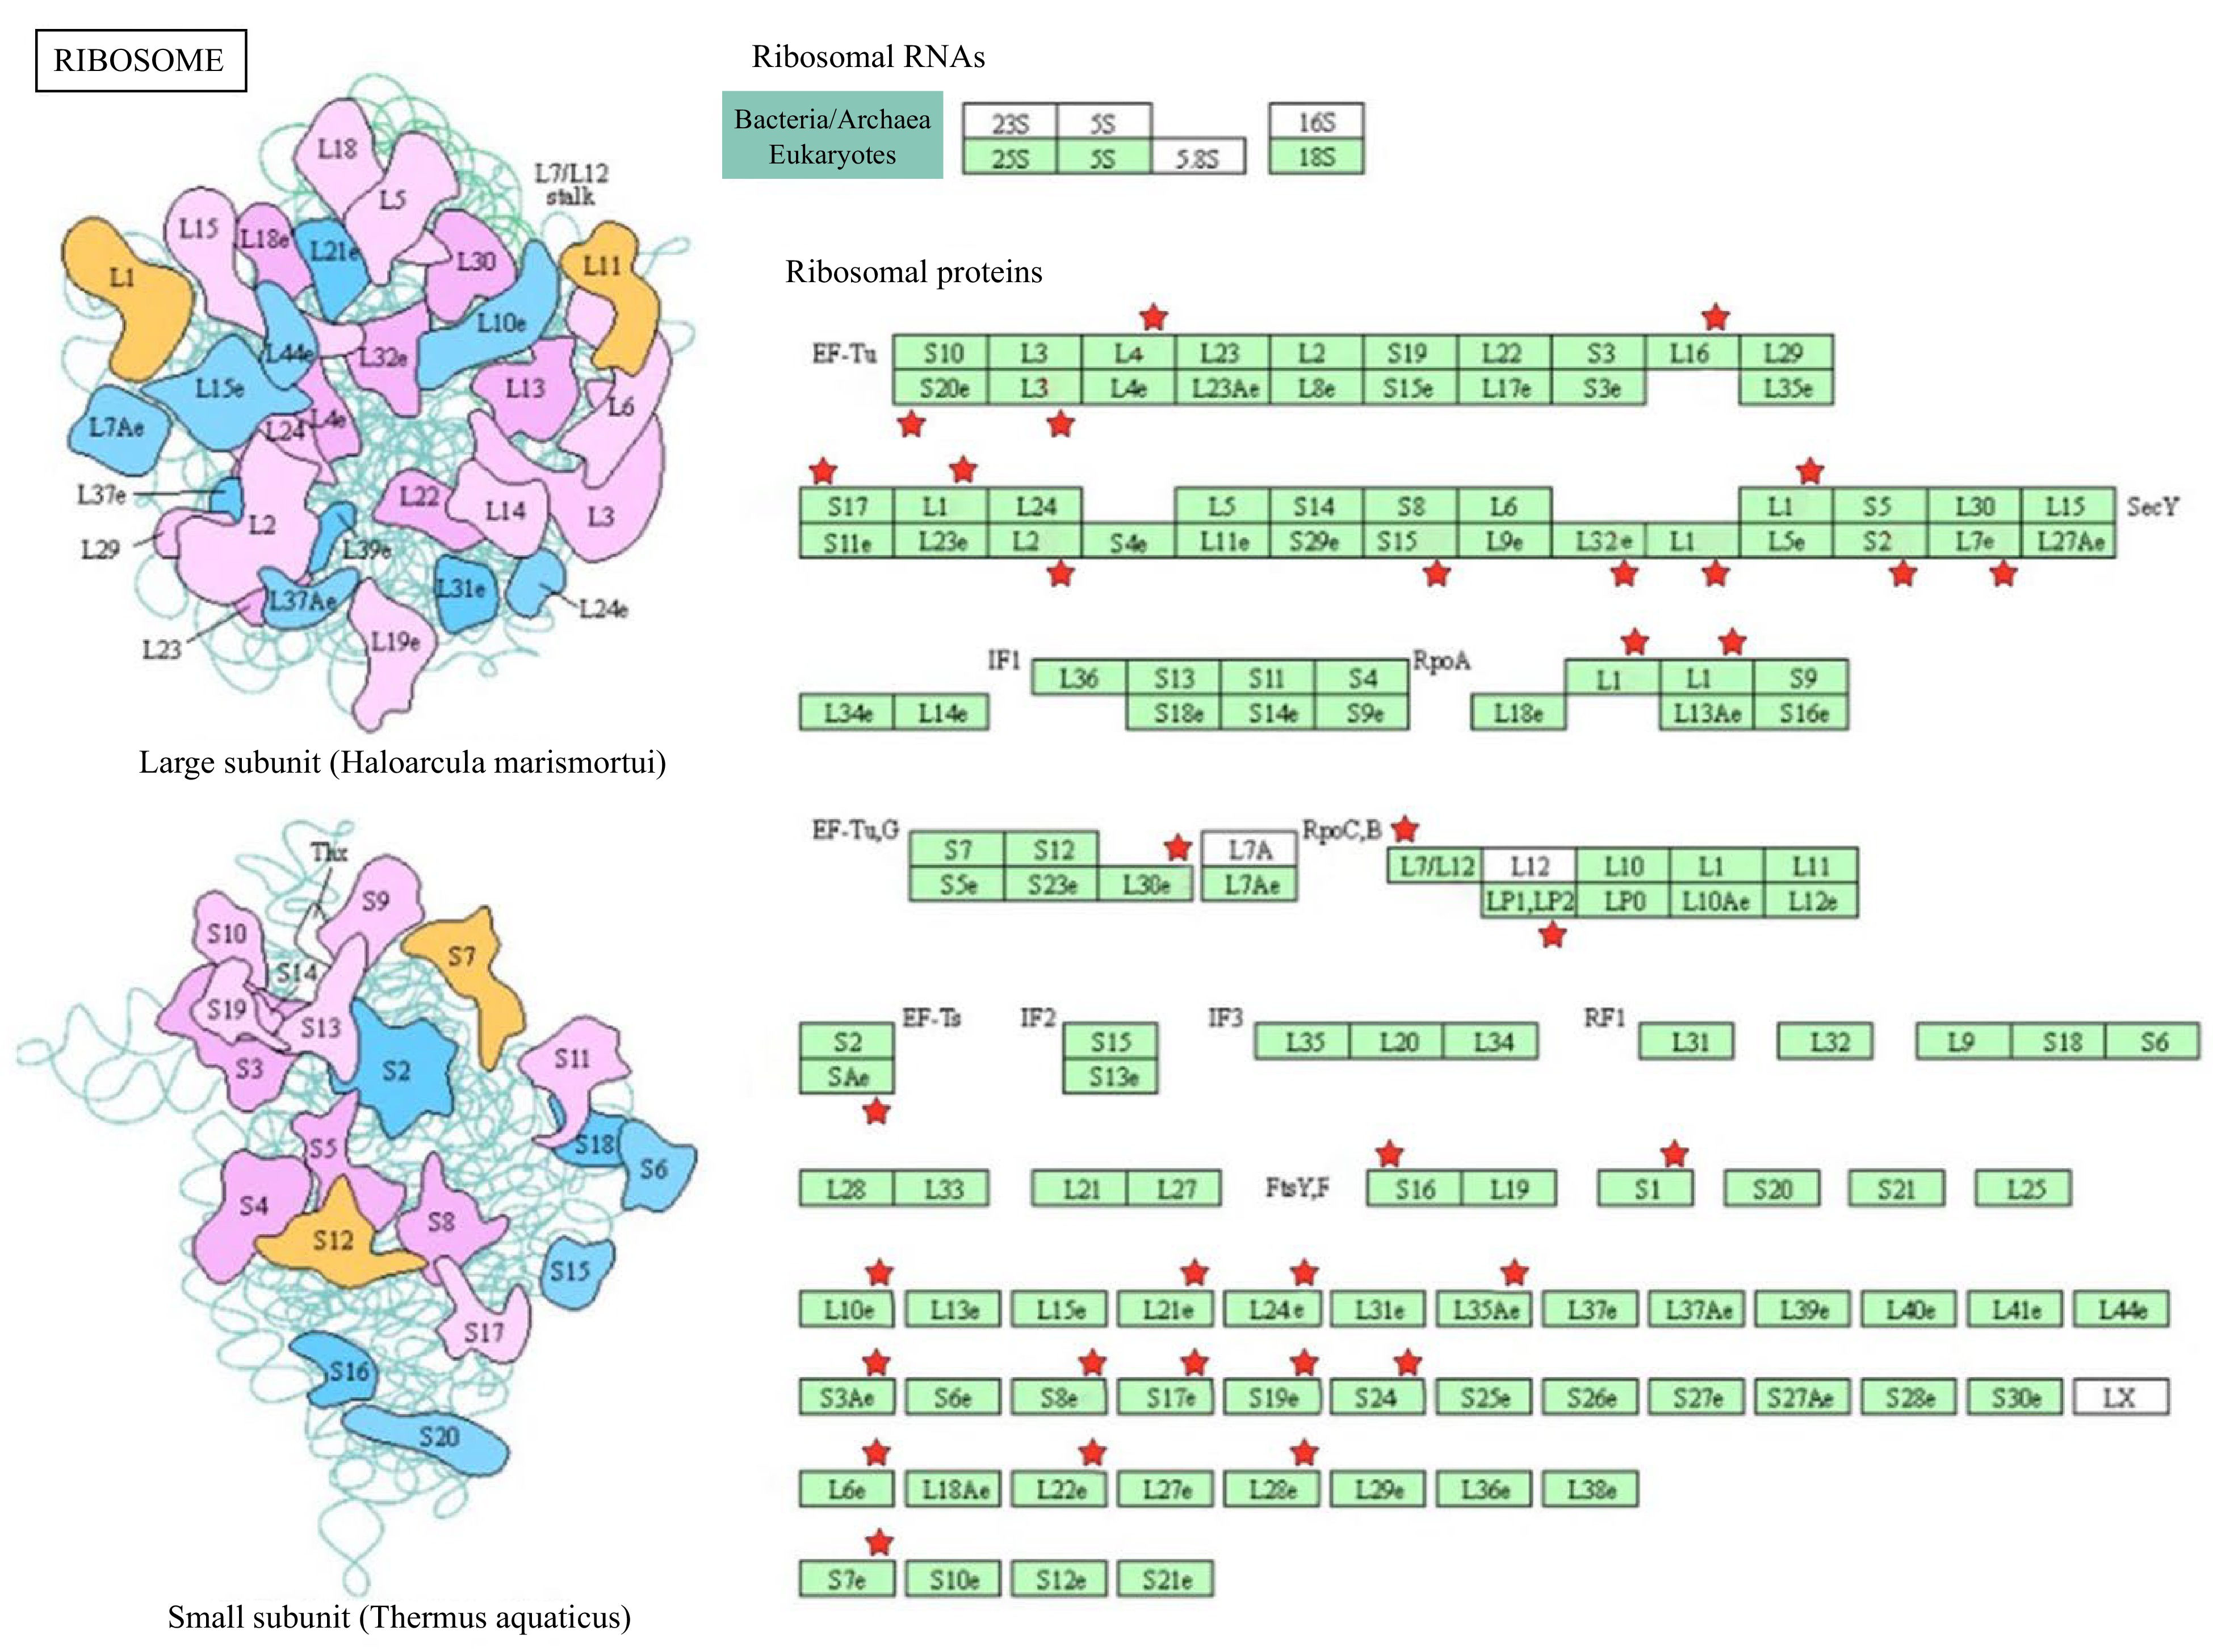
Figure 5.
Differential expression and KEGG pathway analysis of proteins related to ribosome biosynthesis in broccoli during postharvest storage. The DEPs are indicated by red stars.
-
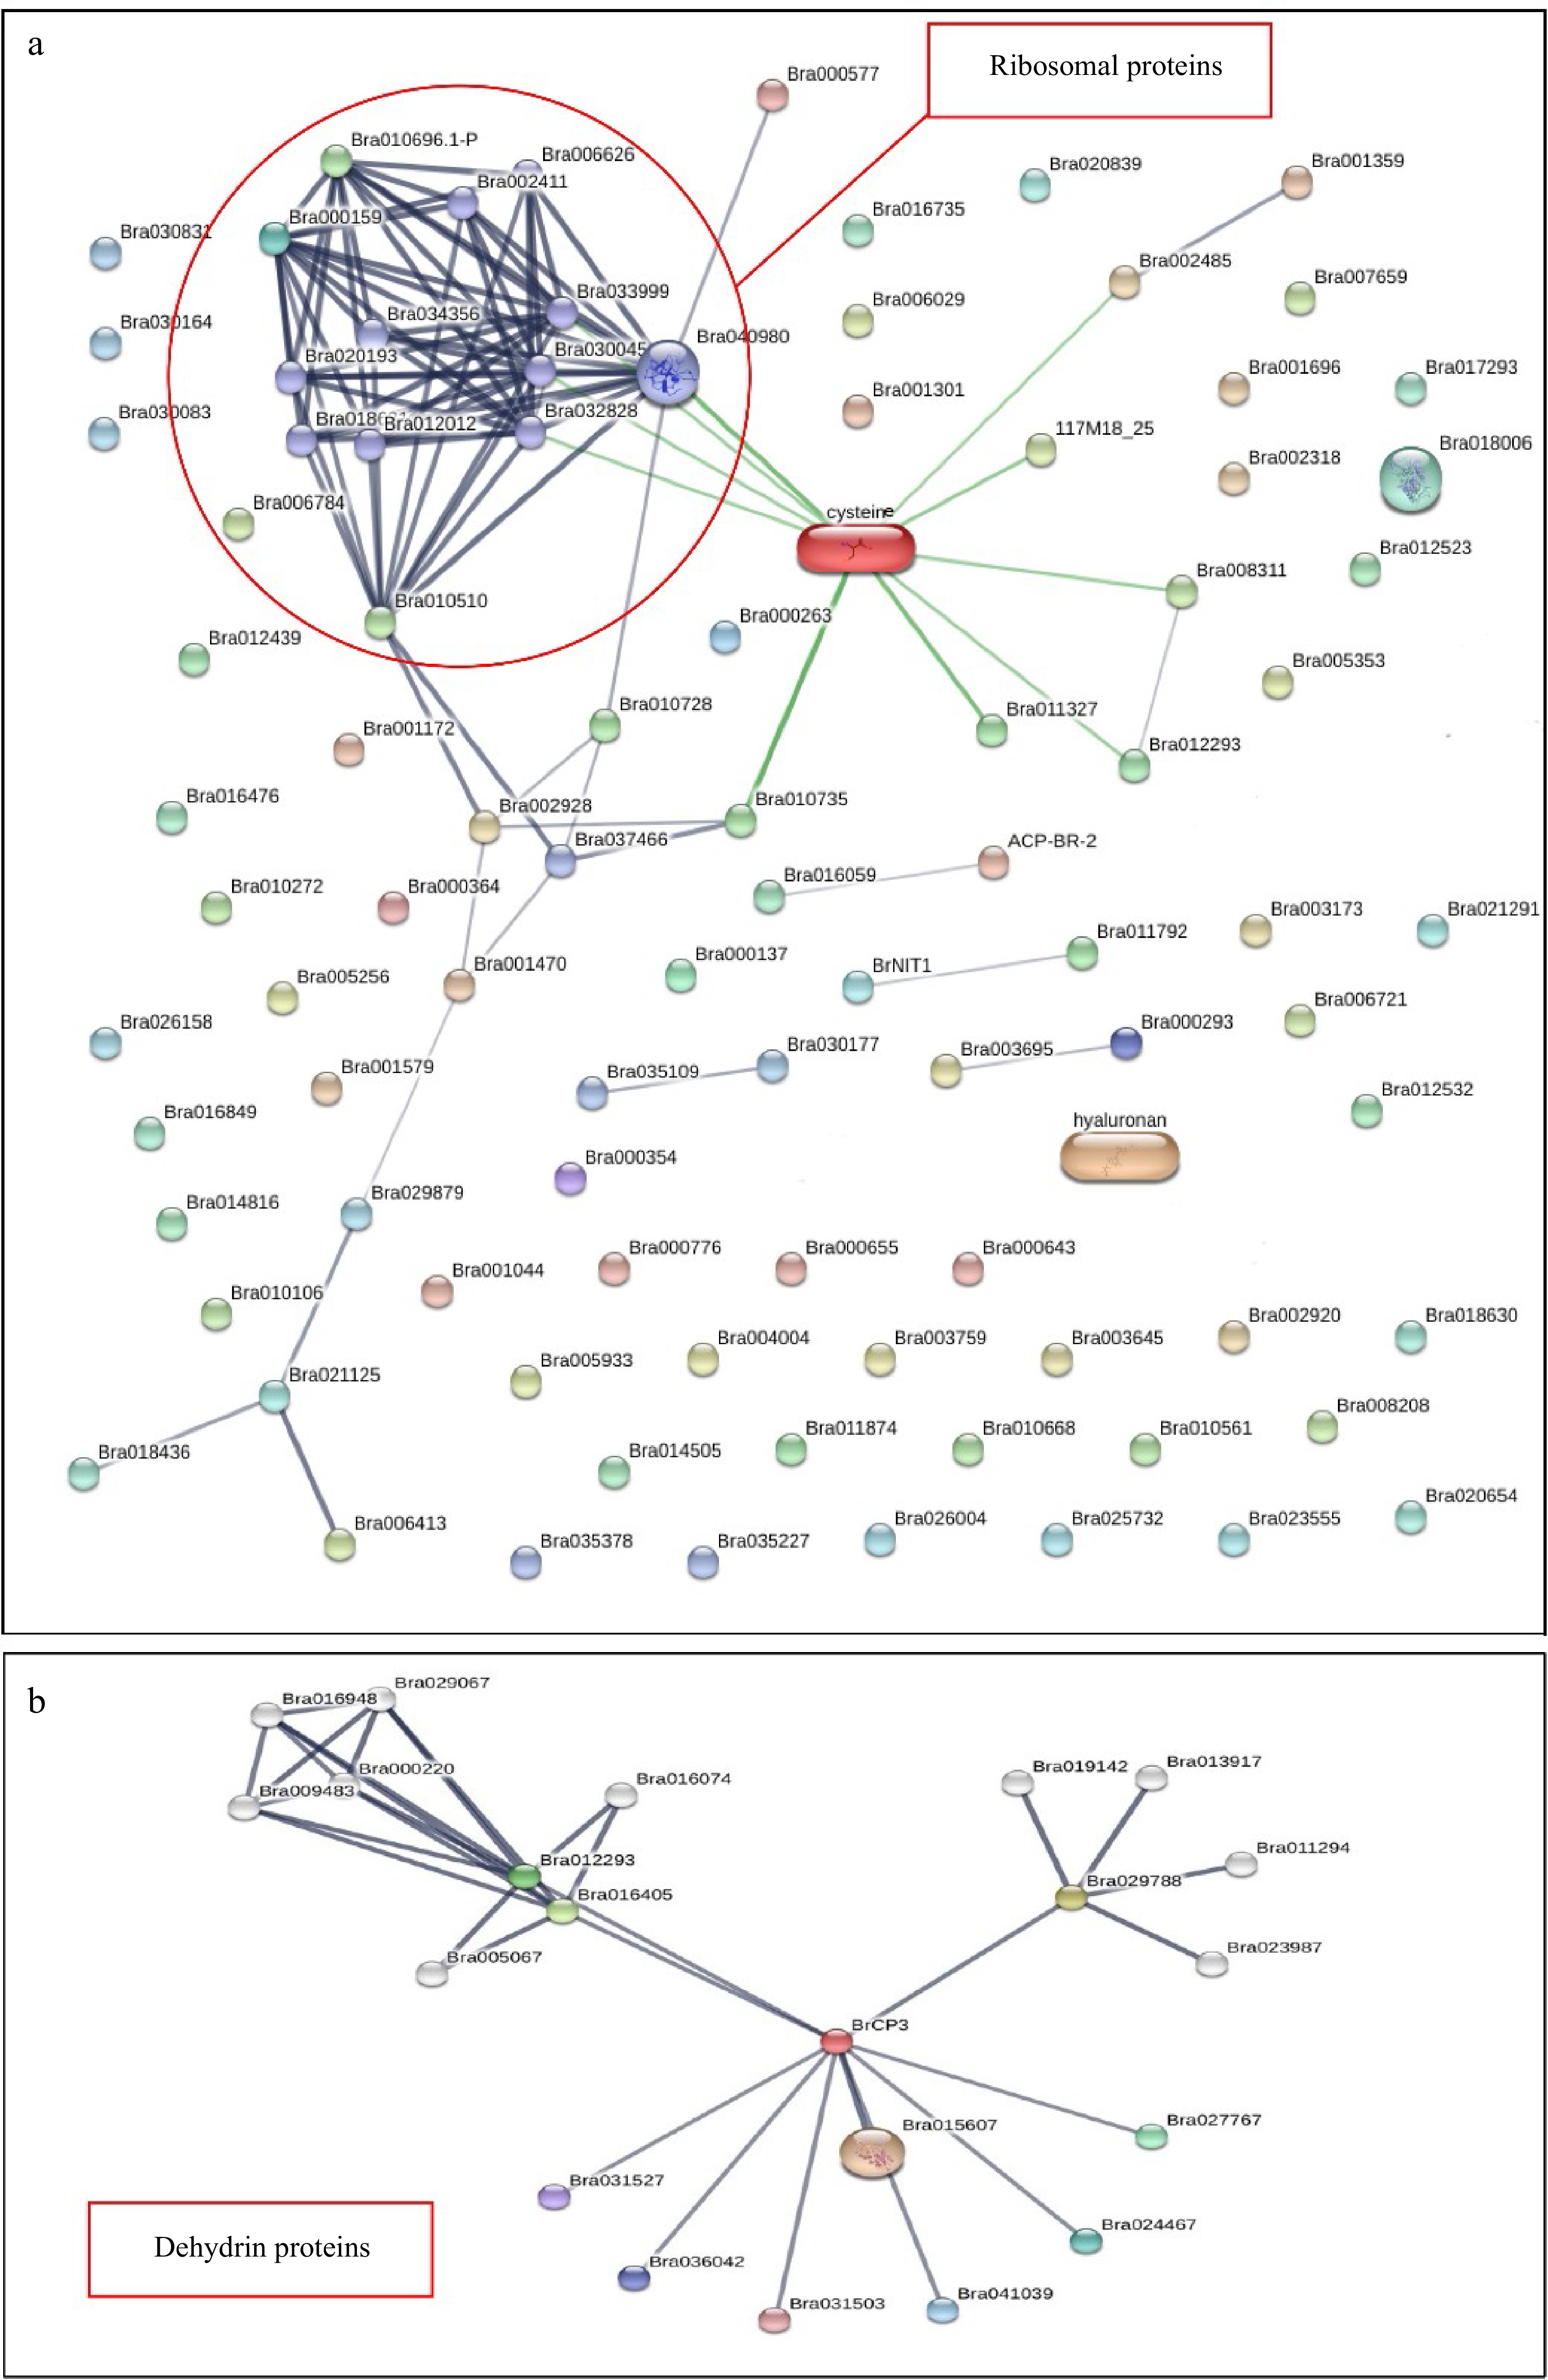
Figure 6.
Investigating the protein-protein interaction network of differentially expressed proteins in broccoli during postharvest storage at 25 and 4 °C. Protein interaction networks generated using the STRING software showed that (a) ribosomal proteins and (b) dehydrin proteins were hubs during postharvest senescence in broccoli.
-
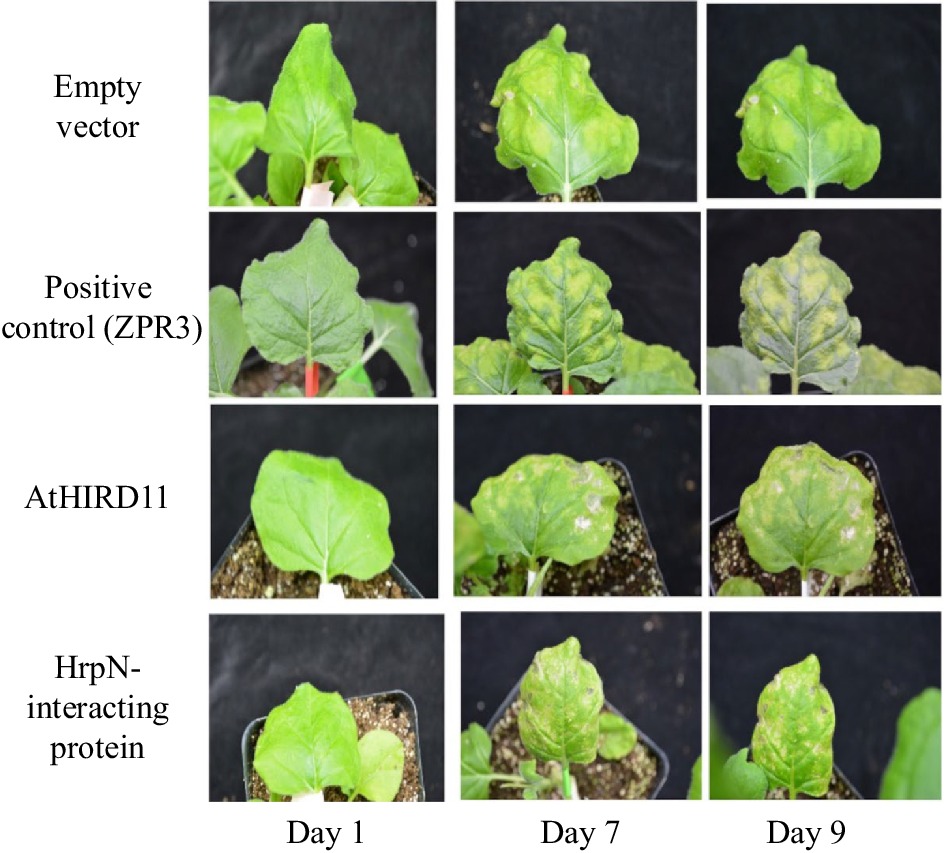
Figure 7.
Tobacco transient assay. Images of tobacco leaves injected with the empty pMDC43 vector as a negative control; with ZPR3, a senescence-inducing protein, which caused color bleaching in tobacco leaves after injection; and with AtHIRD11 or a HrpN-interacting protein, both of which showed color bleaching in tobacco leaf, demonstrating induction of senescence symptoms.
Figures
(7)
Tables
(0)