-
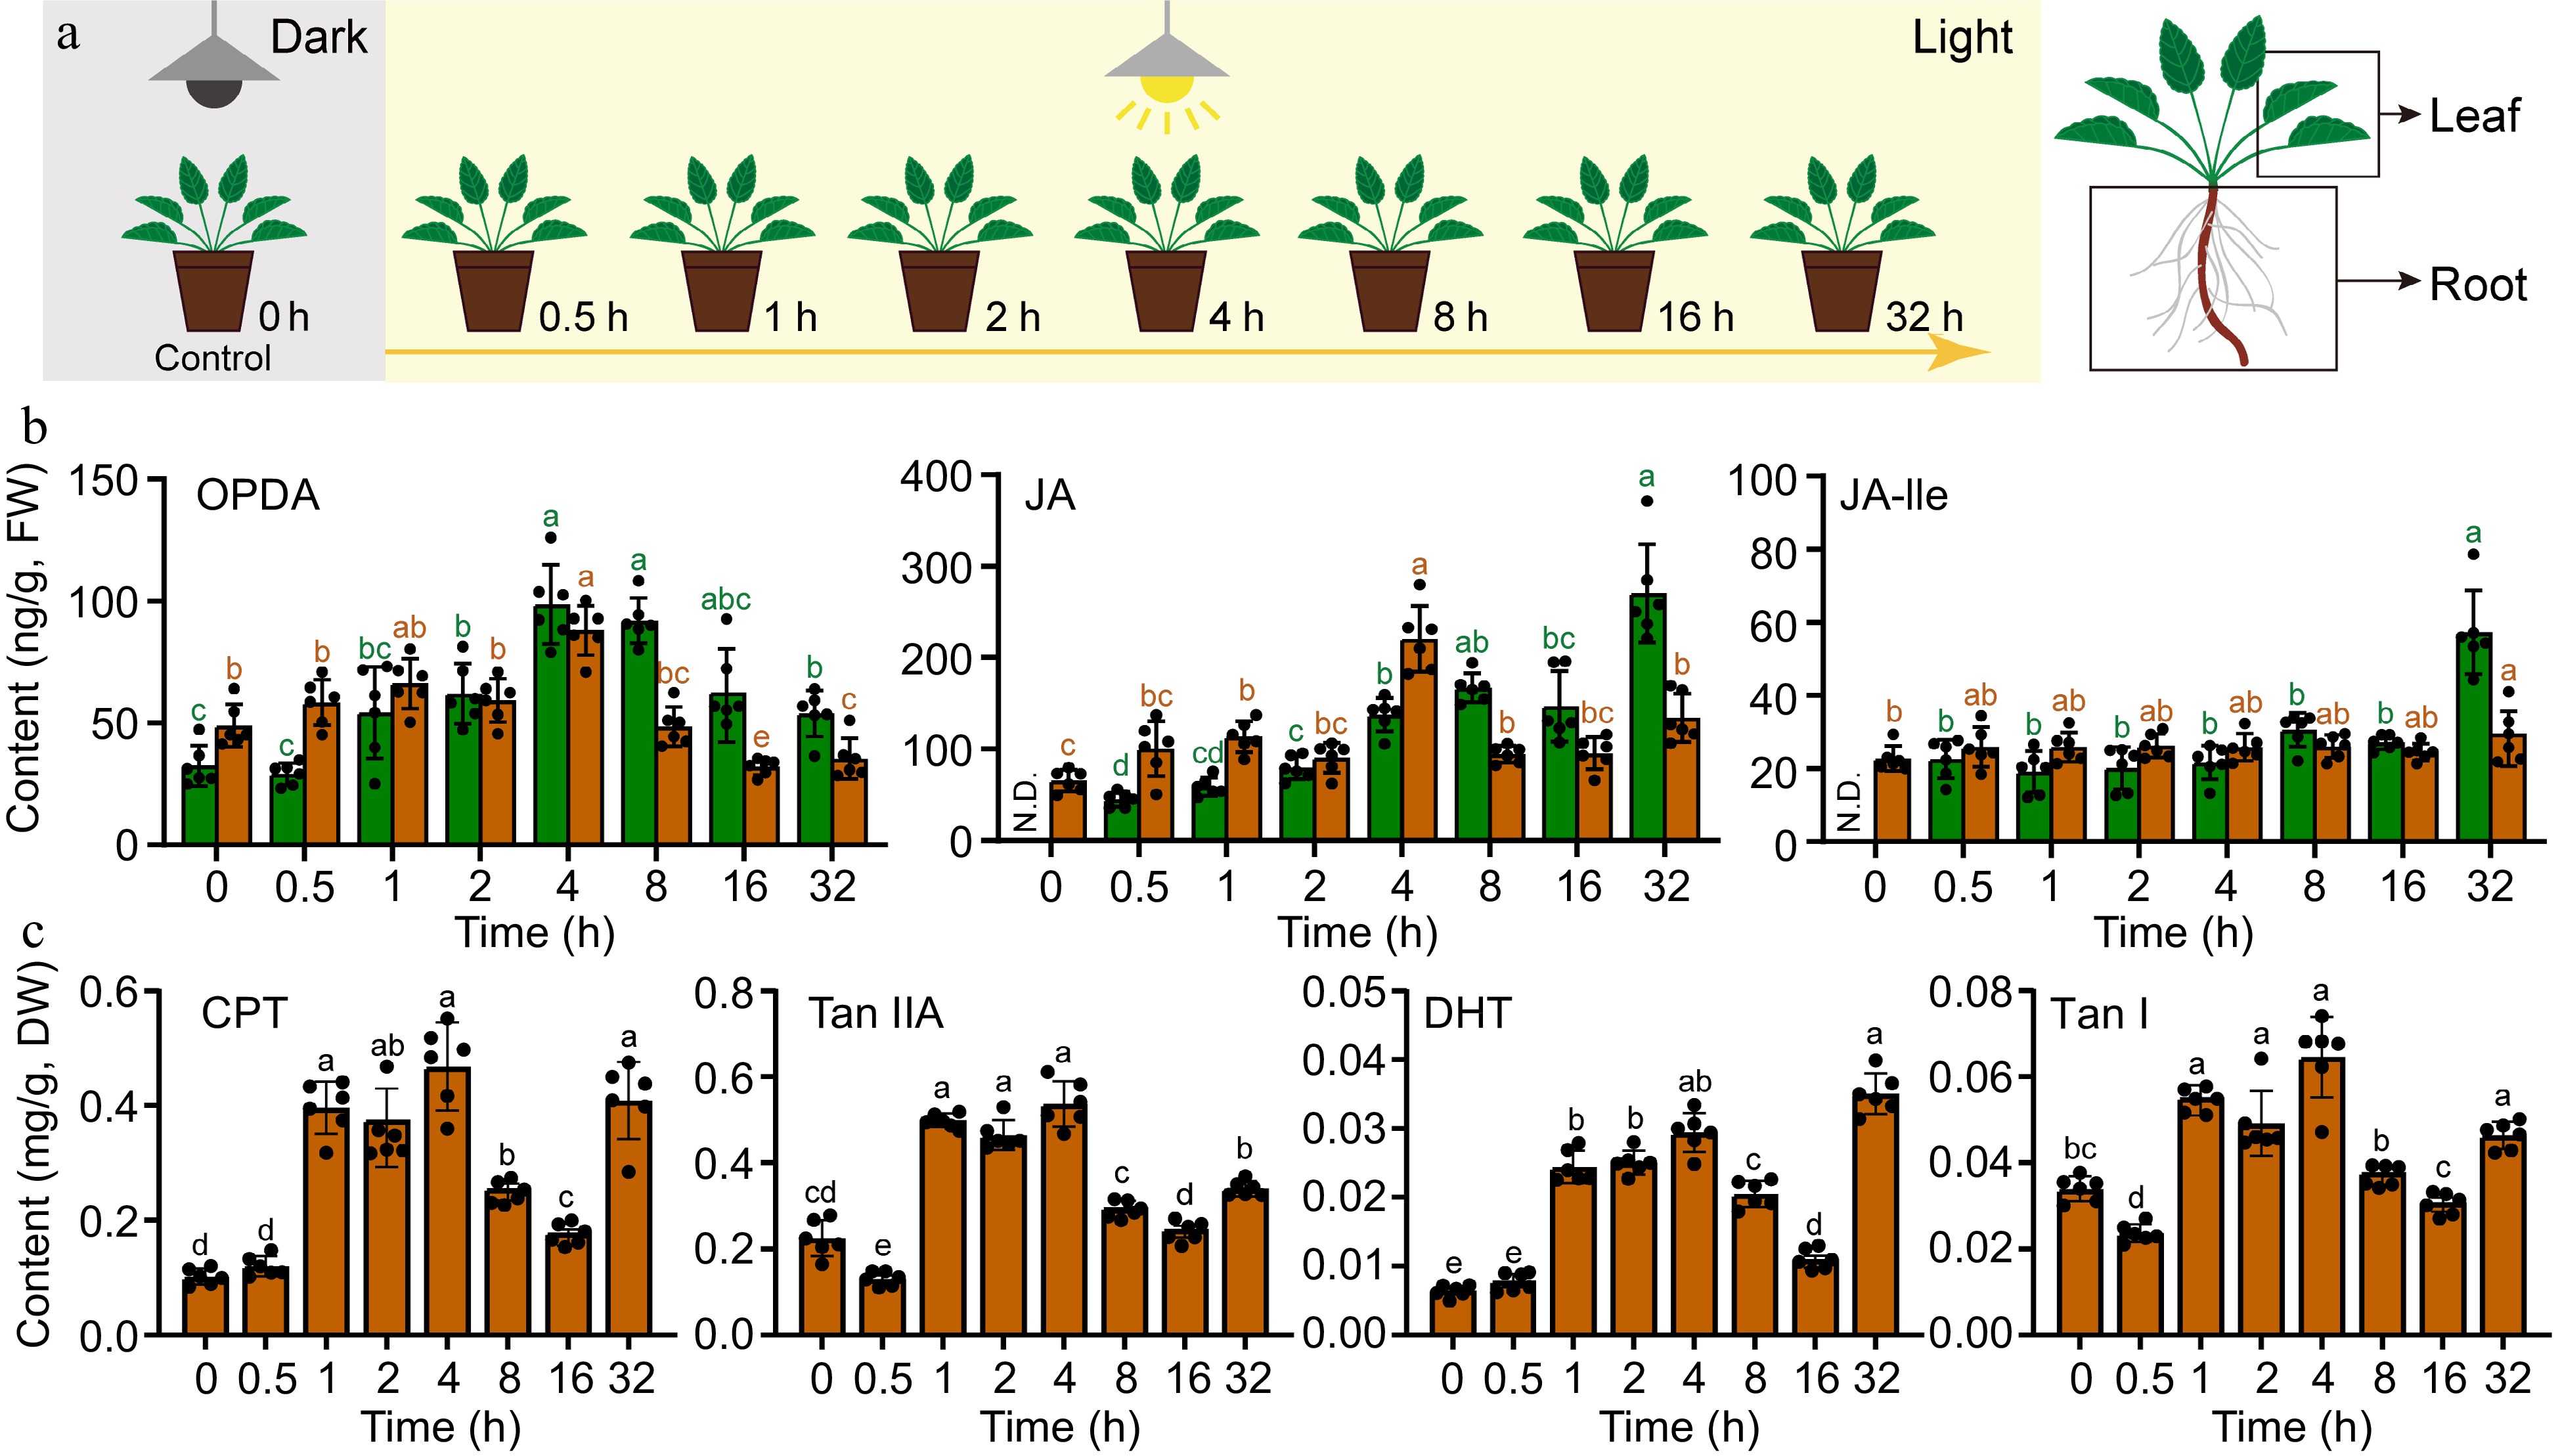
Figure 1.
Transient increase in the accumulation of JAs and tanshinones after dark-to-light transition in Danshen. (a) The schematic representation depicts the dark-to-light transition treatment. (b) Contents of 12-oxo-phytodienoic acid (OPDA), jasmonic acid (JA), jasmonic acid-isoleucine (JA-Ile) in root and leaf determined by UPLC-MS/MS. (c) Contents of Cryptotanshinone I (CPT), Tanshinone IIA (Tan IIA), Dihydrotanshinone (DHT), and Tanshinone I (Tan I) in root determined by UPLC-MS. Data are shown as the mean ± SD (n = 6). Variance test was performed for multigroup comparison, with different lowercase letters indicating significant difference between groups (p < 0.05).
-
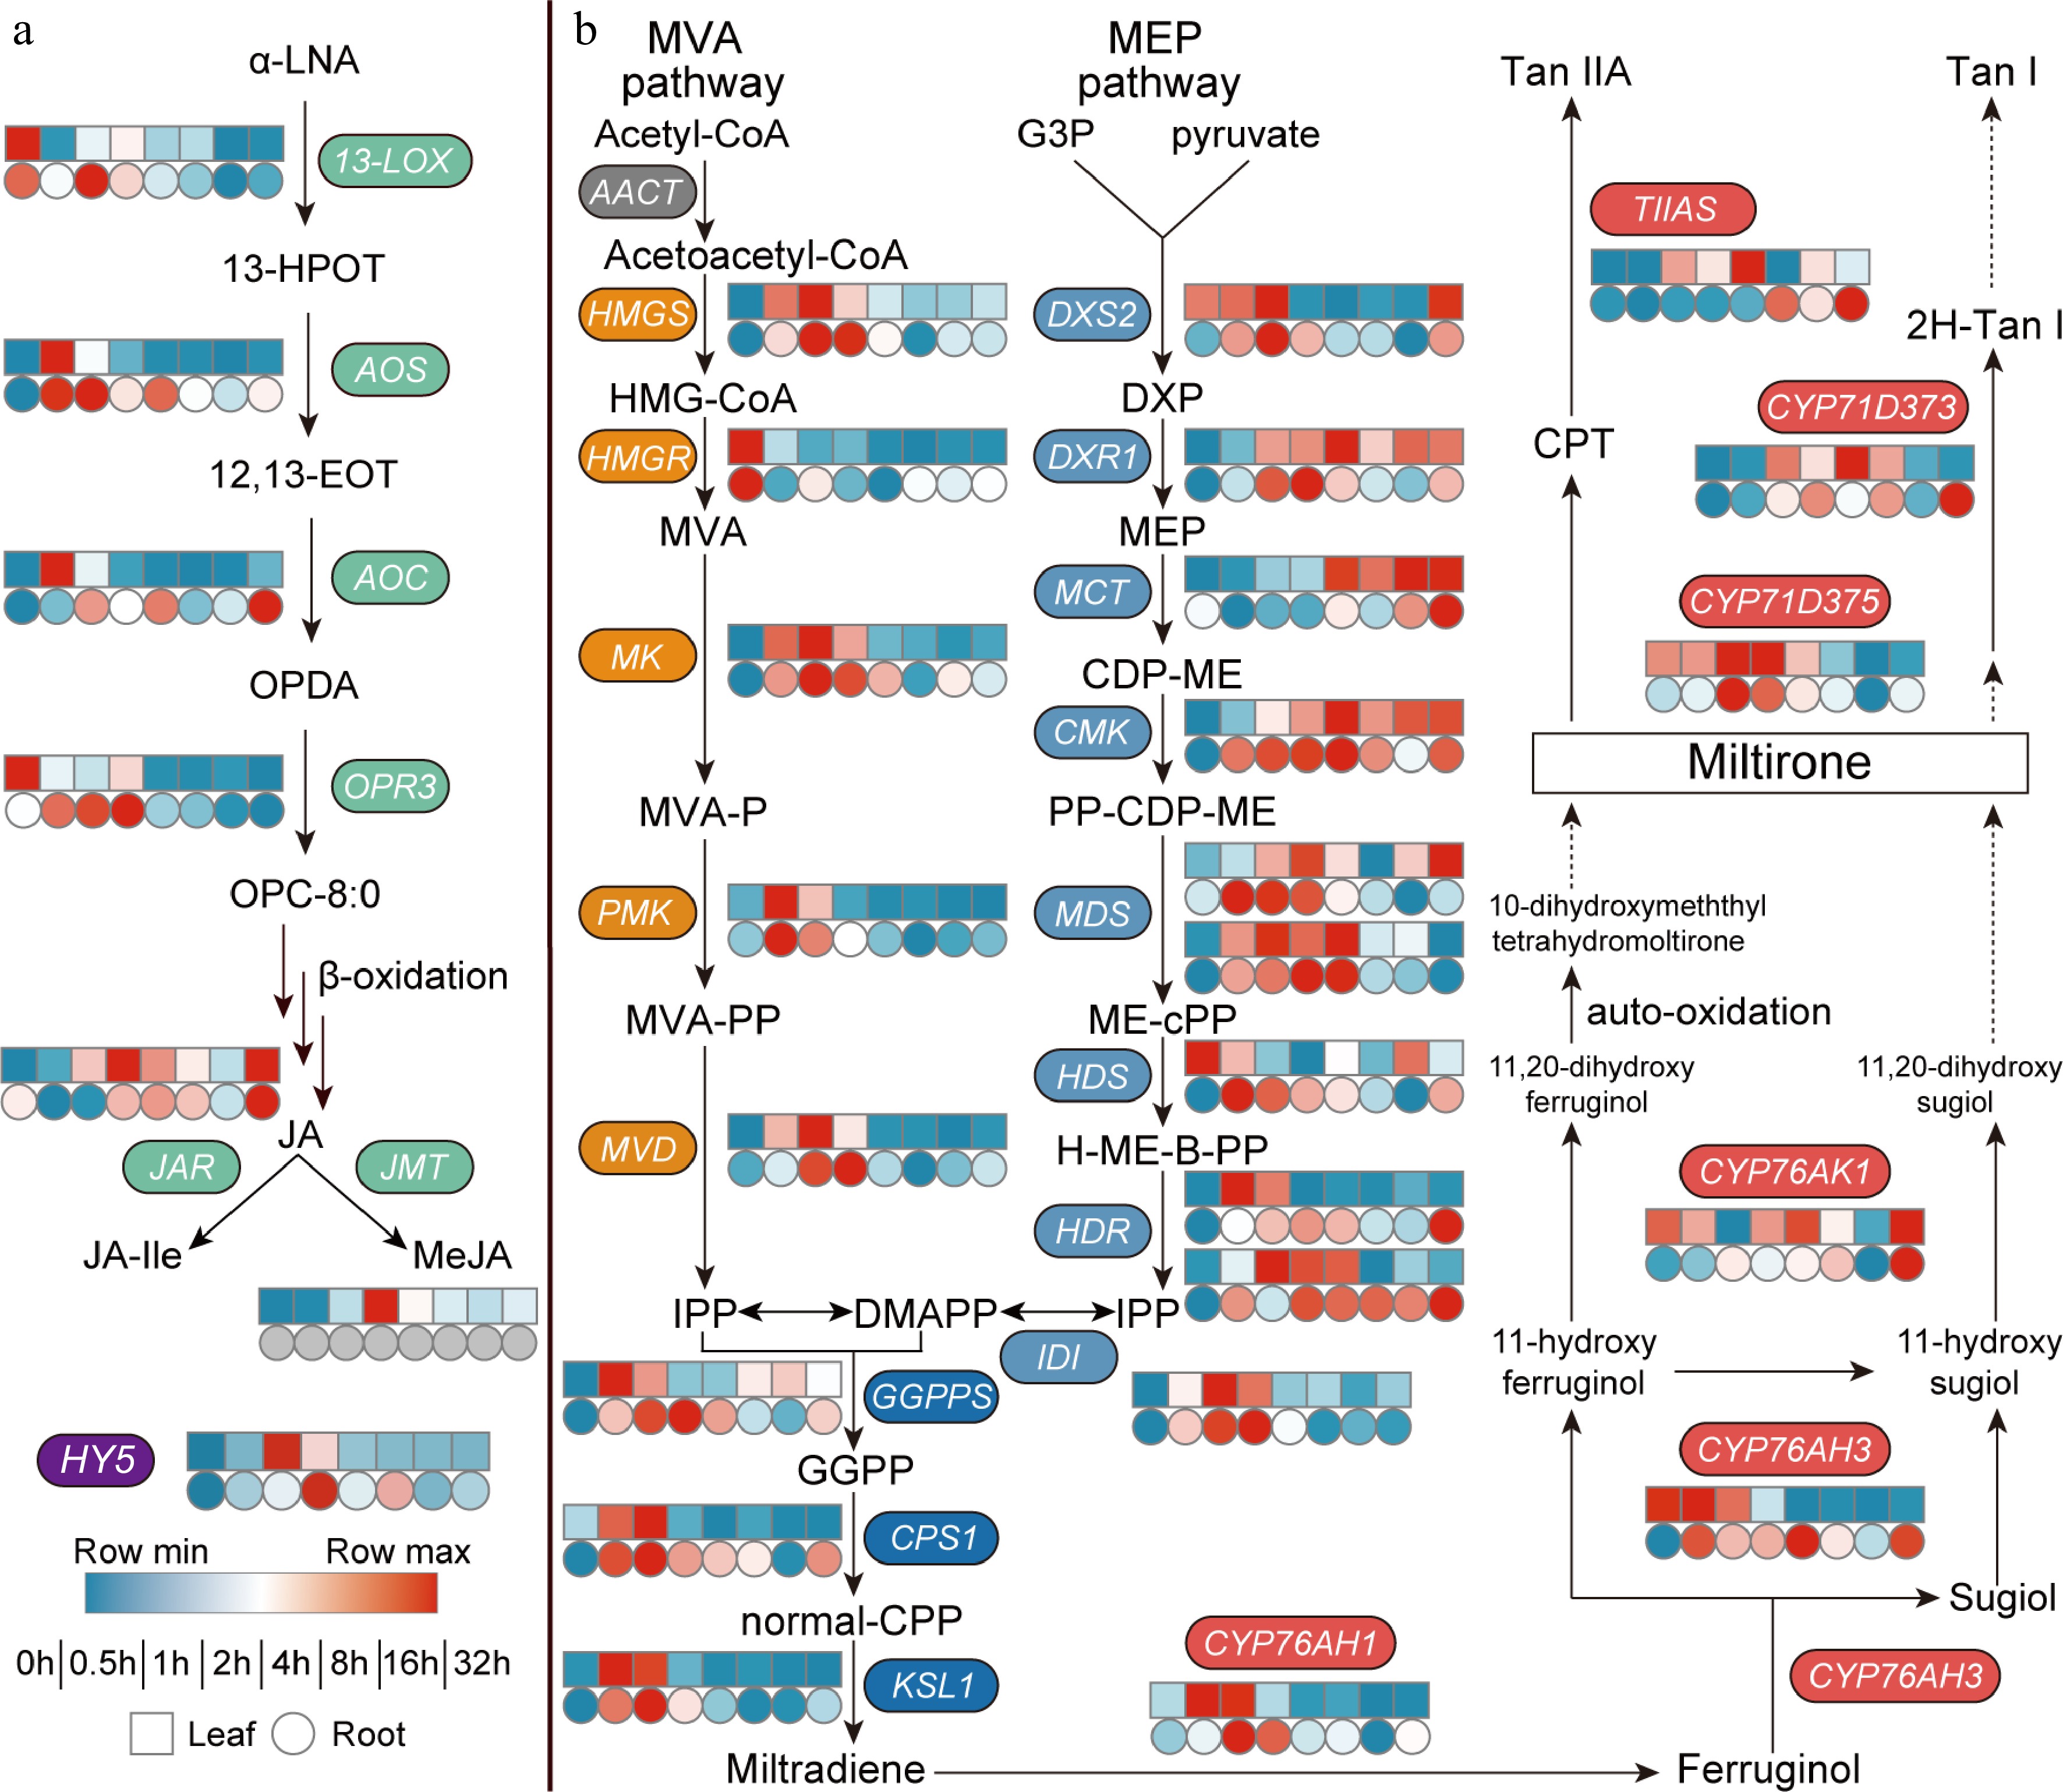
Figure 2.
Dark-to-light transition affects biosynthesis of both (a) JAs and (b) tanshinones. Heat map showing expression fold changes (log2 FC) of genes and FPKM values are shown in Supplemental Table S1. (a) α-LNA, α-Linolenic Acid; 13-HPOT, 13(s) -hydroperoxy-linolenic acid; 12,13-EOT, 12,13(S)-epoxy-9(Z),11,15(Z)-octadecatrienoic acid; OPDA, 12-oxo-phytodienoic acid; OPC-8:0, 3-oxo-2-(2-(Z)-pentenyl)-cyclopentane-1-octanoic acid; JA, jasmonic acid; JA-Ile, jasmonic acid-isoleucine; MeJA, methyl jasmonate; 13-LOX, 13-Lipoxygenase; AOS, allen oxidase; AOC, allene oxide cyclase; OPR, 12-oxophytodienoate reductase; JAR, JA-amino acid synthetase; JMT, jasmonate hydroxymethyl transferase; HY5, elongated hypocotyl 5. (b) MVA pathway, the mevalonate pathway; Acetyl-CoA, acetyl coenzyme A; Acetoacetyl-CoA, acetoacetyl coenzyme A; HMG-CoA, 3-hydroxy-3-methylglutaryl CoA; MVA, mevalonate; MVA-P, mevalonate-5-phosphate; MVA-PP, mevalonate-5-diphosphomevalonate; IPP, isopentenyl pyrophosphate; MEP pathway, the 2-C-methyl-d-erythritol 4-phosphate pathway; G3P, glyceraldehyde 3-phosphate; DXP, 1-deoxy-d-xylulose 5-phosphate; MEP, 2-C-methyl-d-erythritol 4-phosphate; CDP-ME, 4-(cytidine 5'-diphospho)-2-C-methyl-d-erythritol; PP-CDP-ME, 2-phospho-4-(cytidine 5'-diphospho)-2-C-methyl-d-erythritol; ME-cPP, 2-C-methyl-d-erythritol 2,4-cyclodiphosphate; H-ME-B-PP, 1-hydroxy-2-methyl-2-butenyl 4-diphosphate; DMAPP, dimethylallyl pyrophosphate; GGPP, geranylgeranyl diphos-phate; normal-CPP, normal-copalyl diphosphate; AACT, acetoacetyl-CoA transferase; HMGS, hydroxymethyl-glutaryl-CoA synthase; HMGR, 3-hydroxy-3-methylglutaryl CoA reductase; MK, mevalonate kinase; PMK, phosphomevalonate kinase; MVD, mevalonate-5-pyrophosphate decarboxylase; DXS, 1-deoxy-d-xylulose-5-phosphate synthase; DXR, 1-deoxy-d-xylulose-5-phosphate reductoisomerase; MCT, 2-C-methyl-D-erythritol 4-phosphate cytidylyltransferase; CMK, 4-(cytidine 5'-diphospho)-2-C-methyl-d-erythritol kinase; MDS, 2-C-methyl-d-erythritol 2,4-cyclodiphosphate synthase; HDS, 4-hydroxy-3-methylbut-2-enyl diphosphate synthase; HDR: 4-hydroxy-3-methyl-but-2-enyl diphosphate reductase; IDI, Isopentenyl-diphosphate delta-isomerase; GGPPS, GGPP synthase; CPS, copalyl diphosphate synthase; KSL, kaurene synthase-like; TIIAS, tanshinone IIA synthase.
-
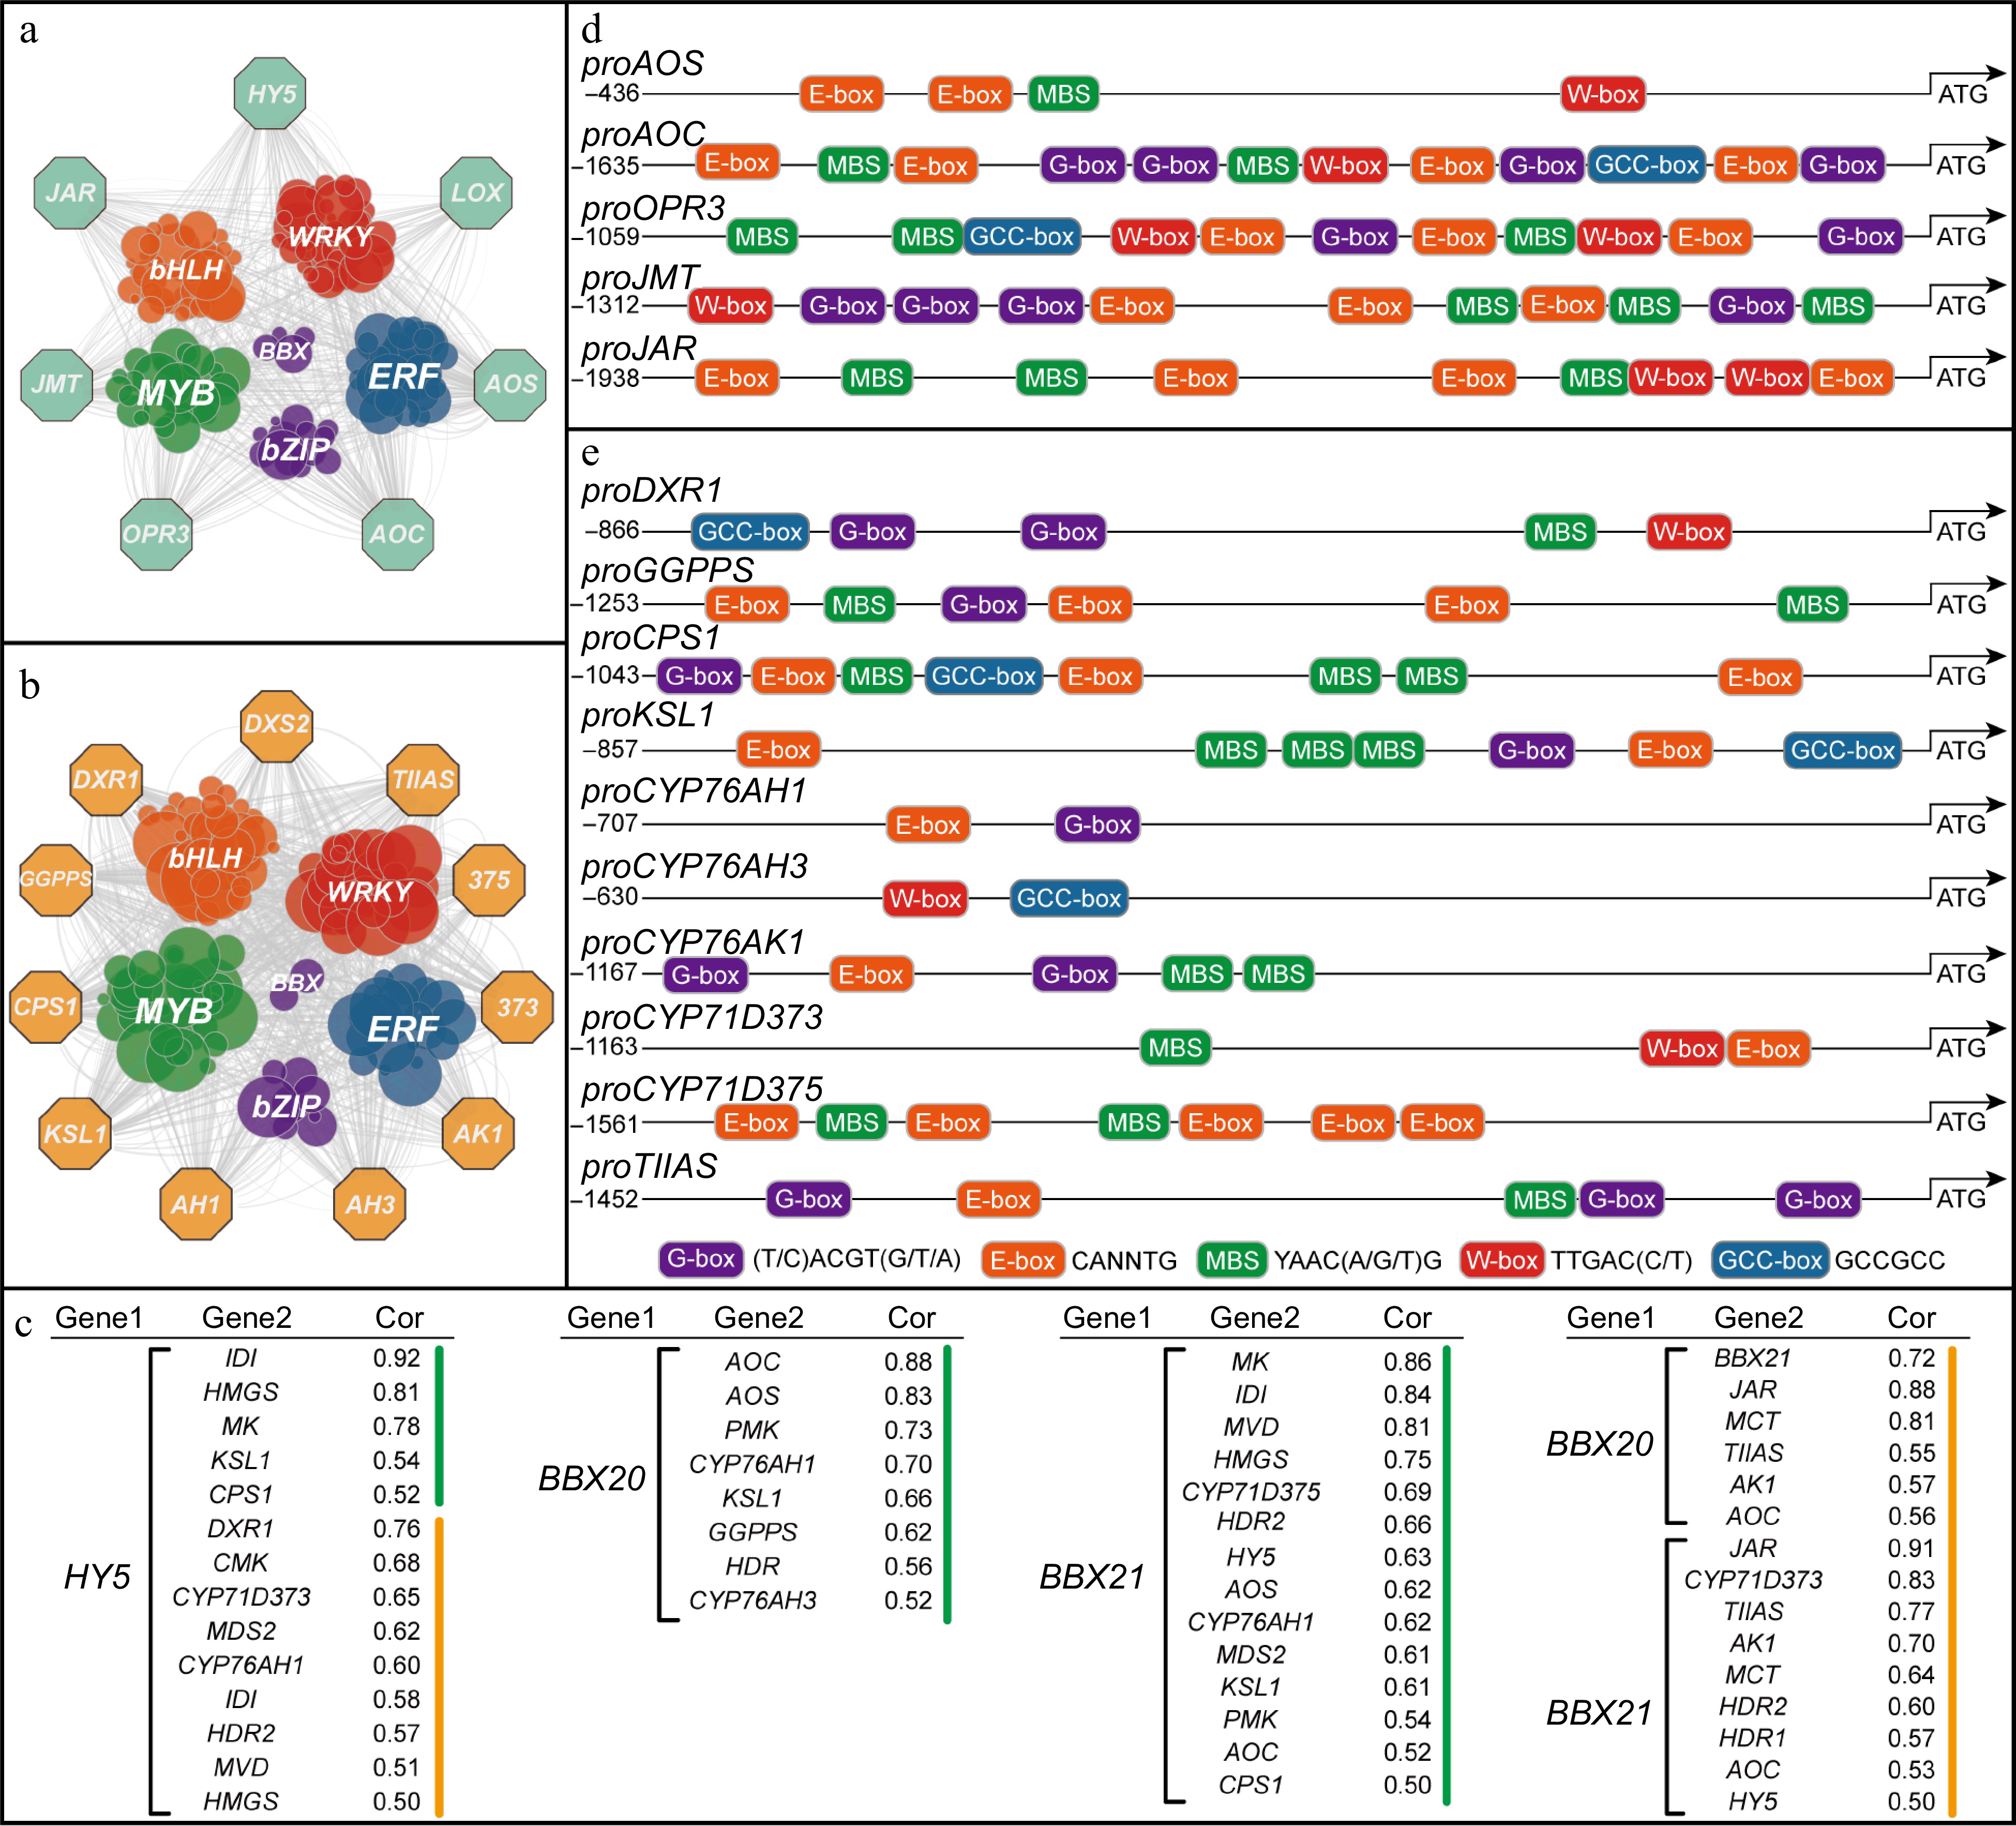
Figure 3.
JAs and tanshinone biosynthetic genes potentially regulated by transcription factors. (a) Co-expression analysis of JAs biosynthetic genes and transcription factors in leaf. (b) Co-expression analysis of tanshinone biosynthetic genes and transcription factors in root, while pathway genes are represented by octagons and transcription factors by circles. The screening criterion for selection was set as a correlation coefficient greater than 0.3. (c) Transcription factor-pathway genes with correlation coefficients, green represents genes in leaves and yellow in roots. (d) Cis-elements of the JAs biosynthetic gene promoters. (e) Cis-elements of the tanshinone biosynthetic gene promoters.
-
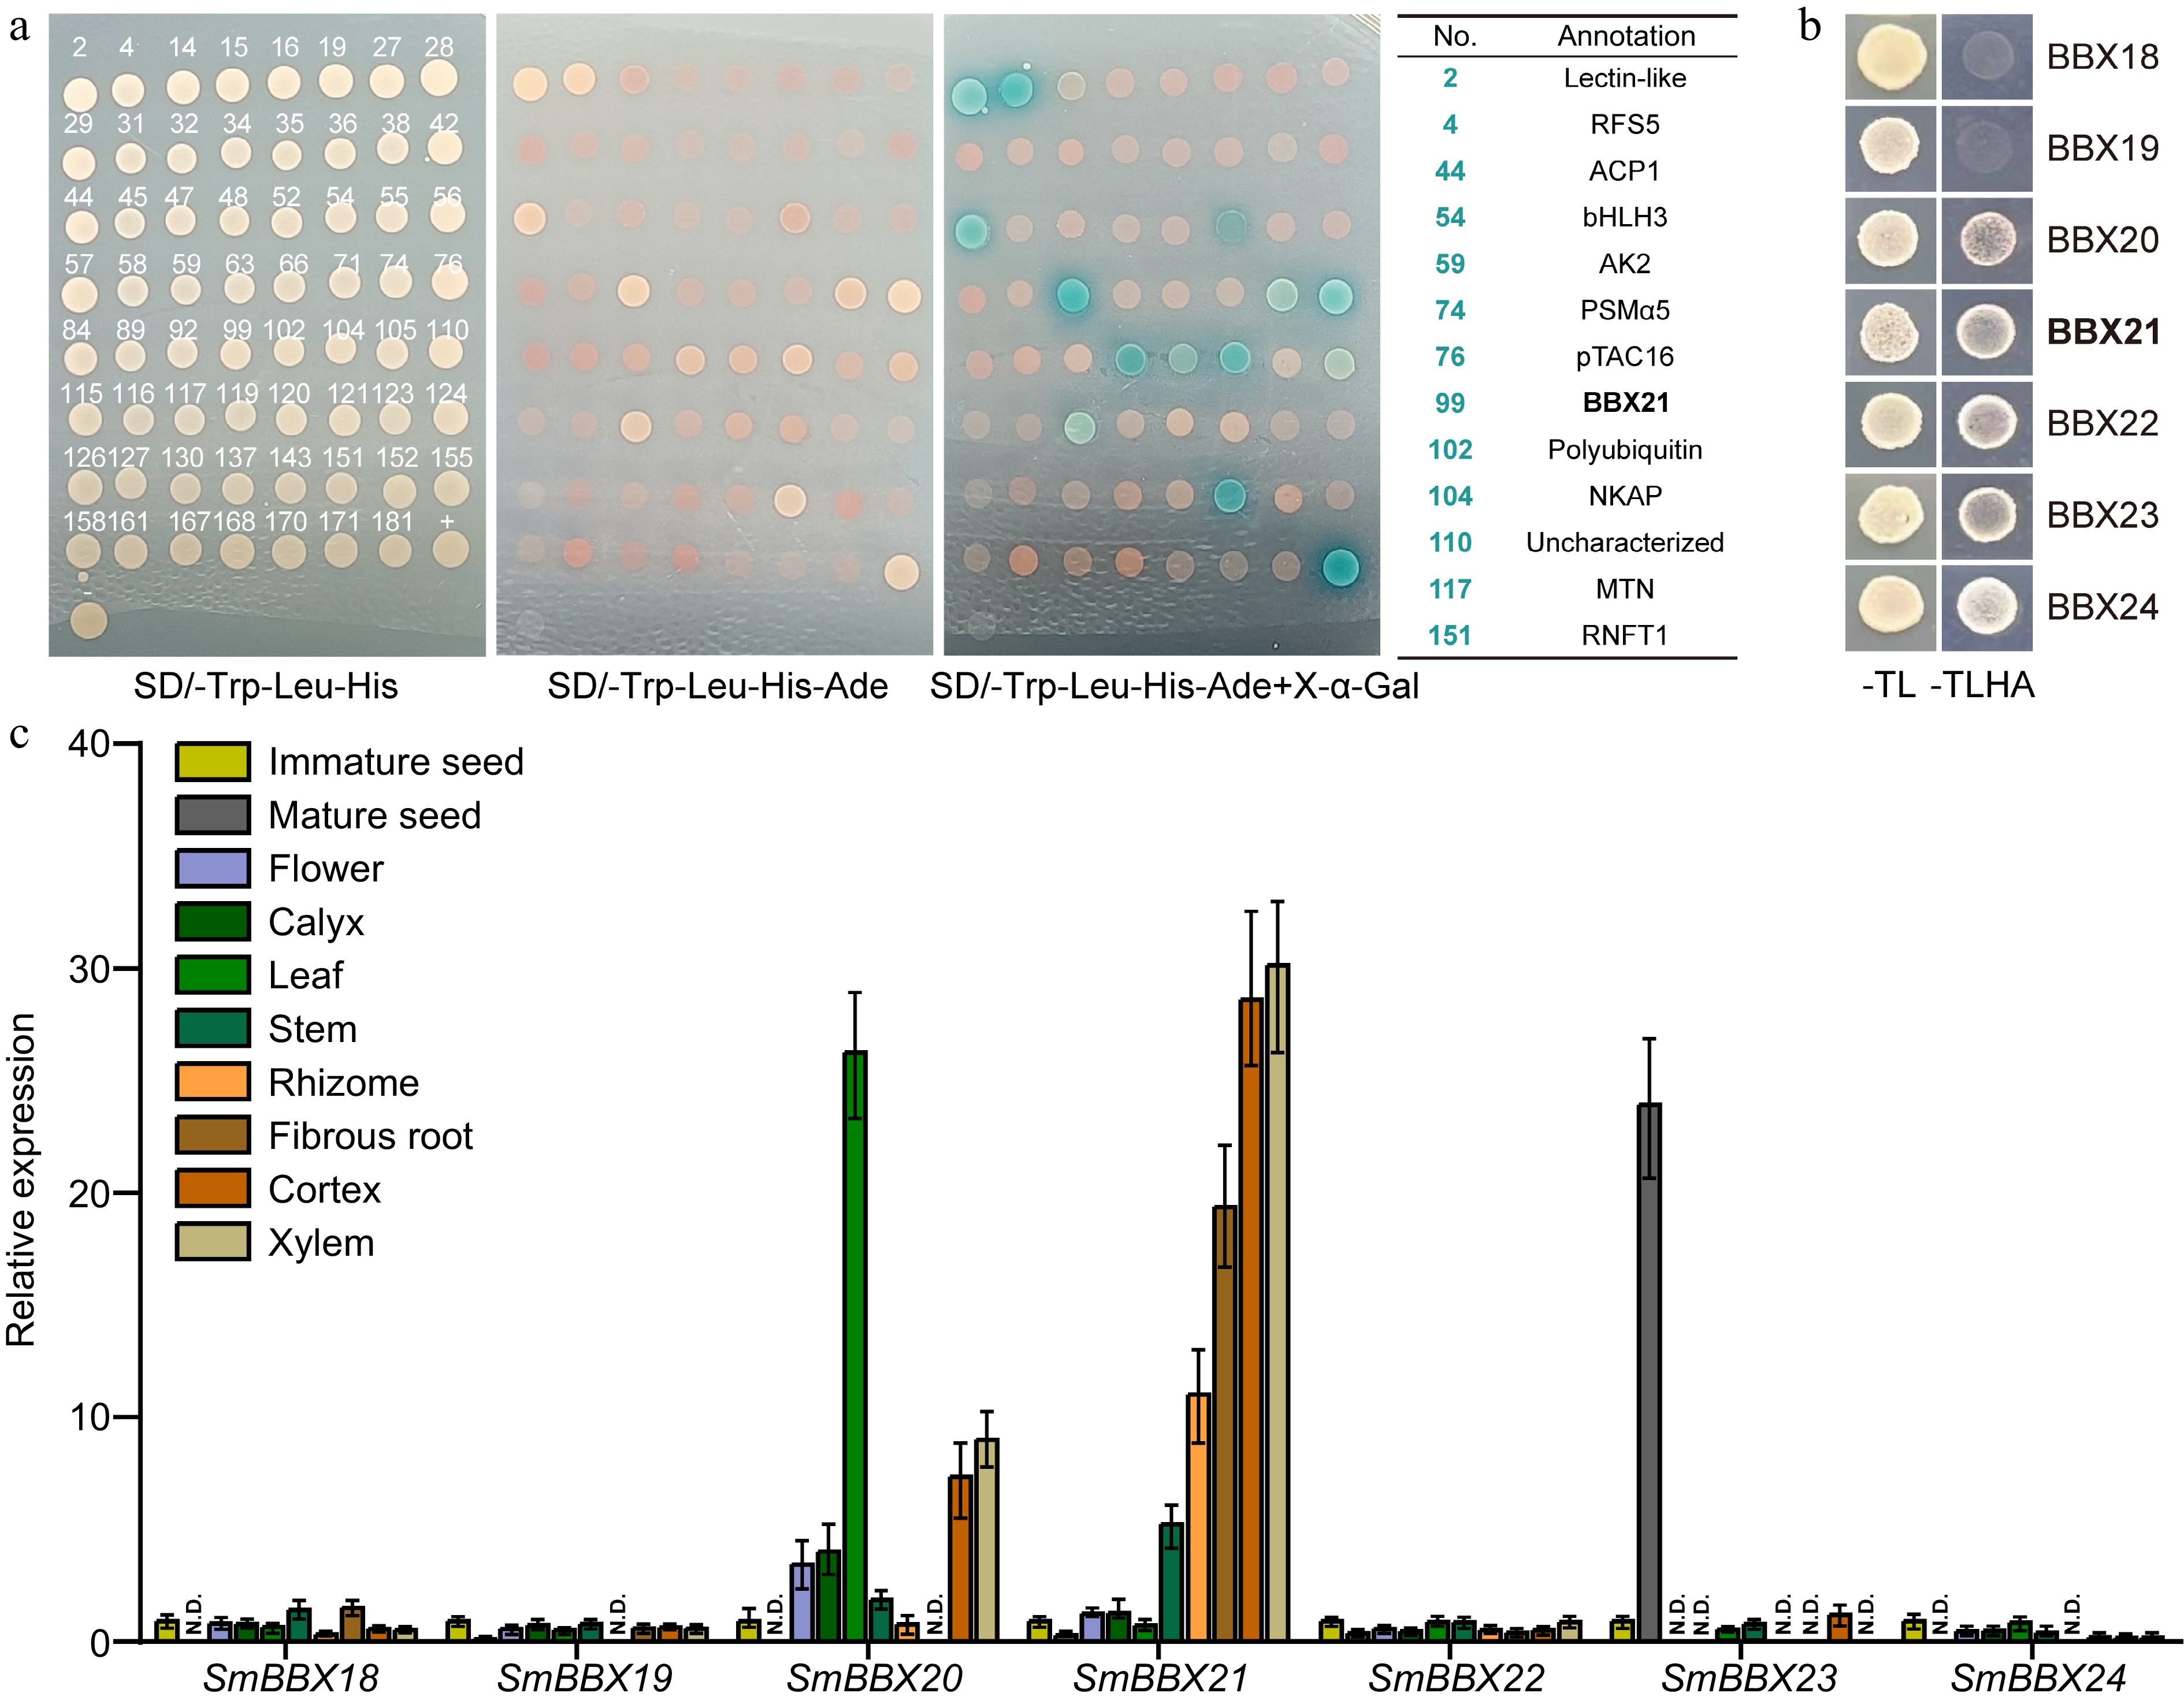
Figure 4.
Potential interaction between root-specific expressed SmBBX21 and SmHY5. (a) Yeast two-hybrid sequencing (Y2H-seq) screened potential interacting proteins of SmHY5 in root. Monoclonal sequencing results are shown in Supplemental Table S2. (b) Y2H confirmed the interaction between SmHY5 and SmBBXs. (c) The expression of the seven candidate SmBBX genes in different tissues of Danshen. ACTIN was used as an internal control; for each gene, the expression level relative to ACTIN in immature seed was taken as 1. Data are shown as the mean ± SD (n = 3).
-
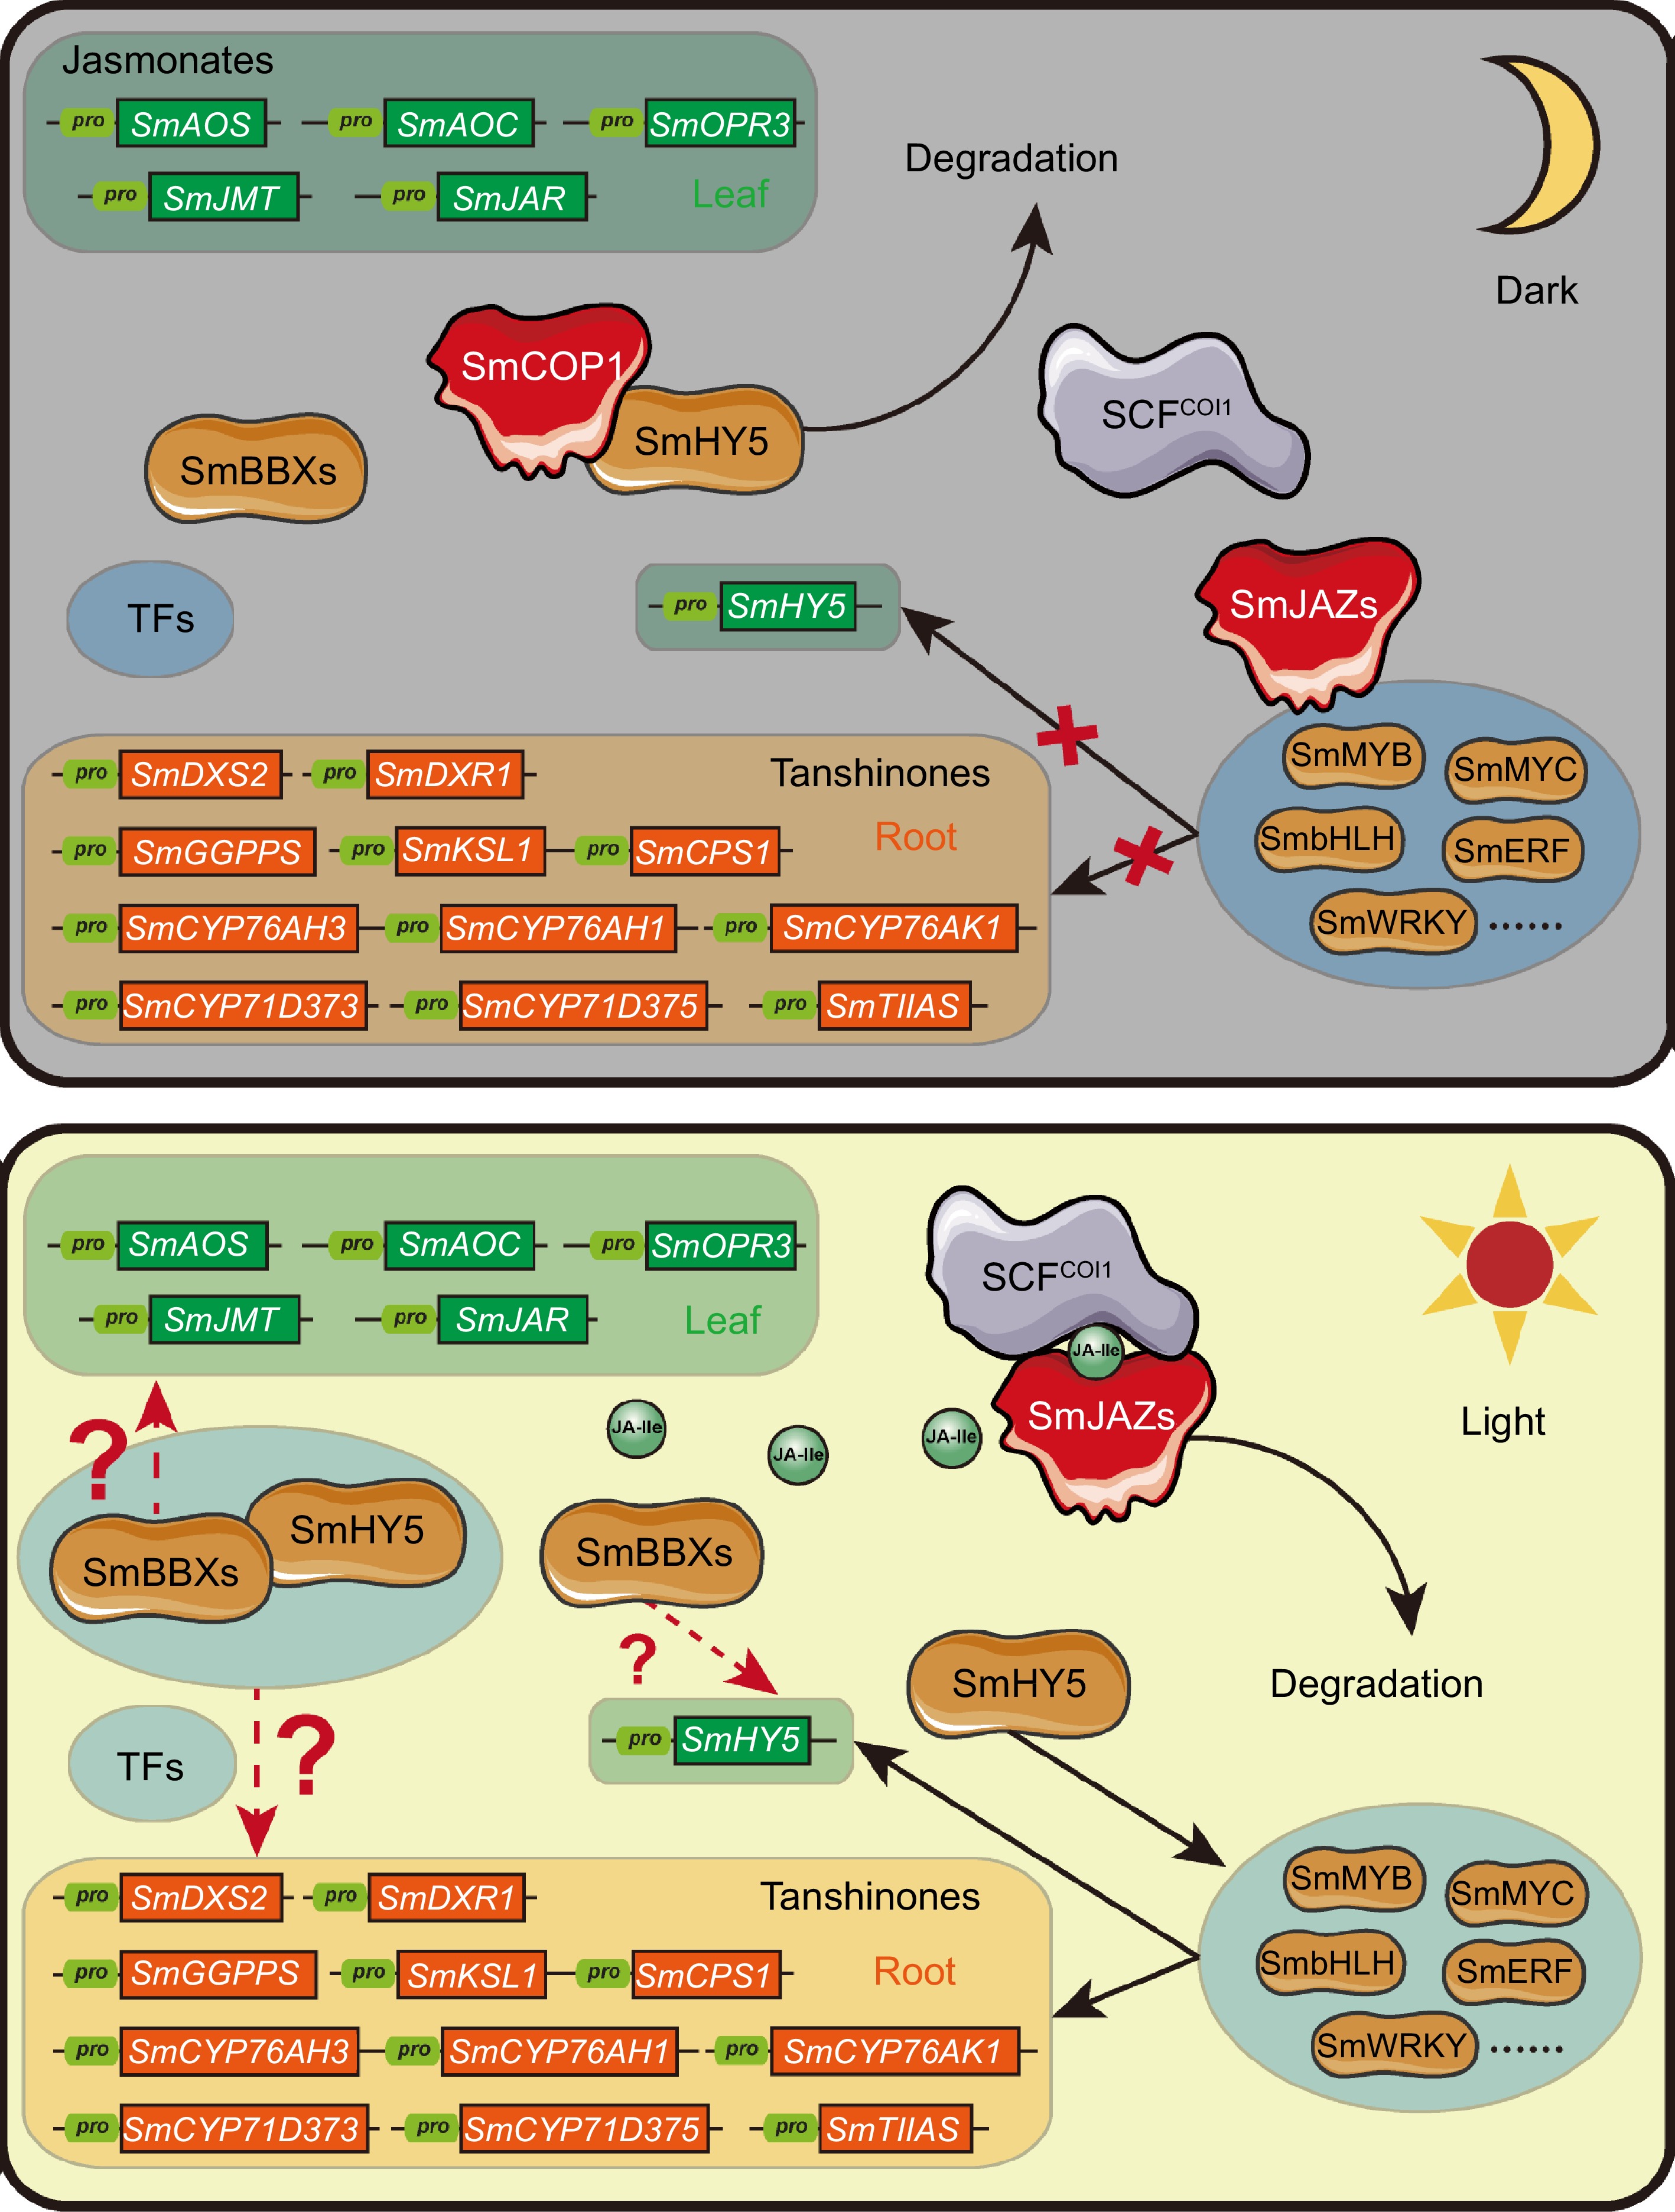
Figure 5.
Hypothesis for crosstalk between light and JA signaling regulating tanshinone biosynthesis through the SmHY5-SmBBXs complex. Under dark conditions, the absence of JA-Ile leads to the inhibition of multiple transcription factors by SmJAZ proteins. Simultaneously, SmCOP1 degrades SmHY5, preventing the formation of a regulatory complex between SmHY5 and SmBBXs. Consequently, the expression of downstream genes involved in tanshinone biosynthesis is at a lower level. In contrast, under light conditions, JA-Ile biosynthesis is enabled, leading to the degradation of SmJAZ proteins and the release of SmMYC and other transcription factors. Additionally, SmCOP1 releases SmHY5, allowing the formation of a regulatory complex between SmHY5 and SmBBXs. This coordination activates the expression of downstream genes involved in tanshinone biosynthesis. Finally, the crosstalk between light and JA signaling on tanshinone biosynthesis was realized through the formation of SmHY5 and SmBBXs complex or not.
Figures
(5)
Tables
(0)