-

Figure 1.
Annotation workflow for I. batata protein-coding genes. The high-quality gene models obtained from Nanopore full-length transcripts were employed to train BRAKER. Comprehensive transcriptomes were constructed using RNA-Seq datasets through full-length and genome-guided transcripts. Additionally, Arabidopsis and UniProt plant protein sequences were incorporated as inputs for BRAKER. The input evidence for EVidenceModeler is highlighted within the red dotted box. Furthermore, manual curation was performed to ensure the accuracy of the annotation.
-
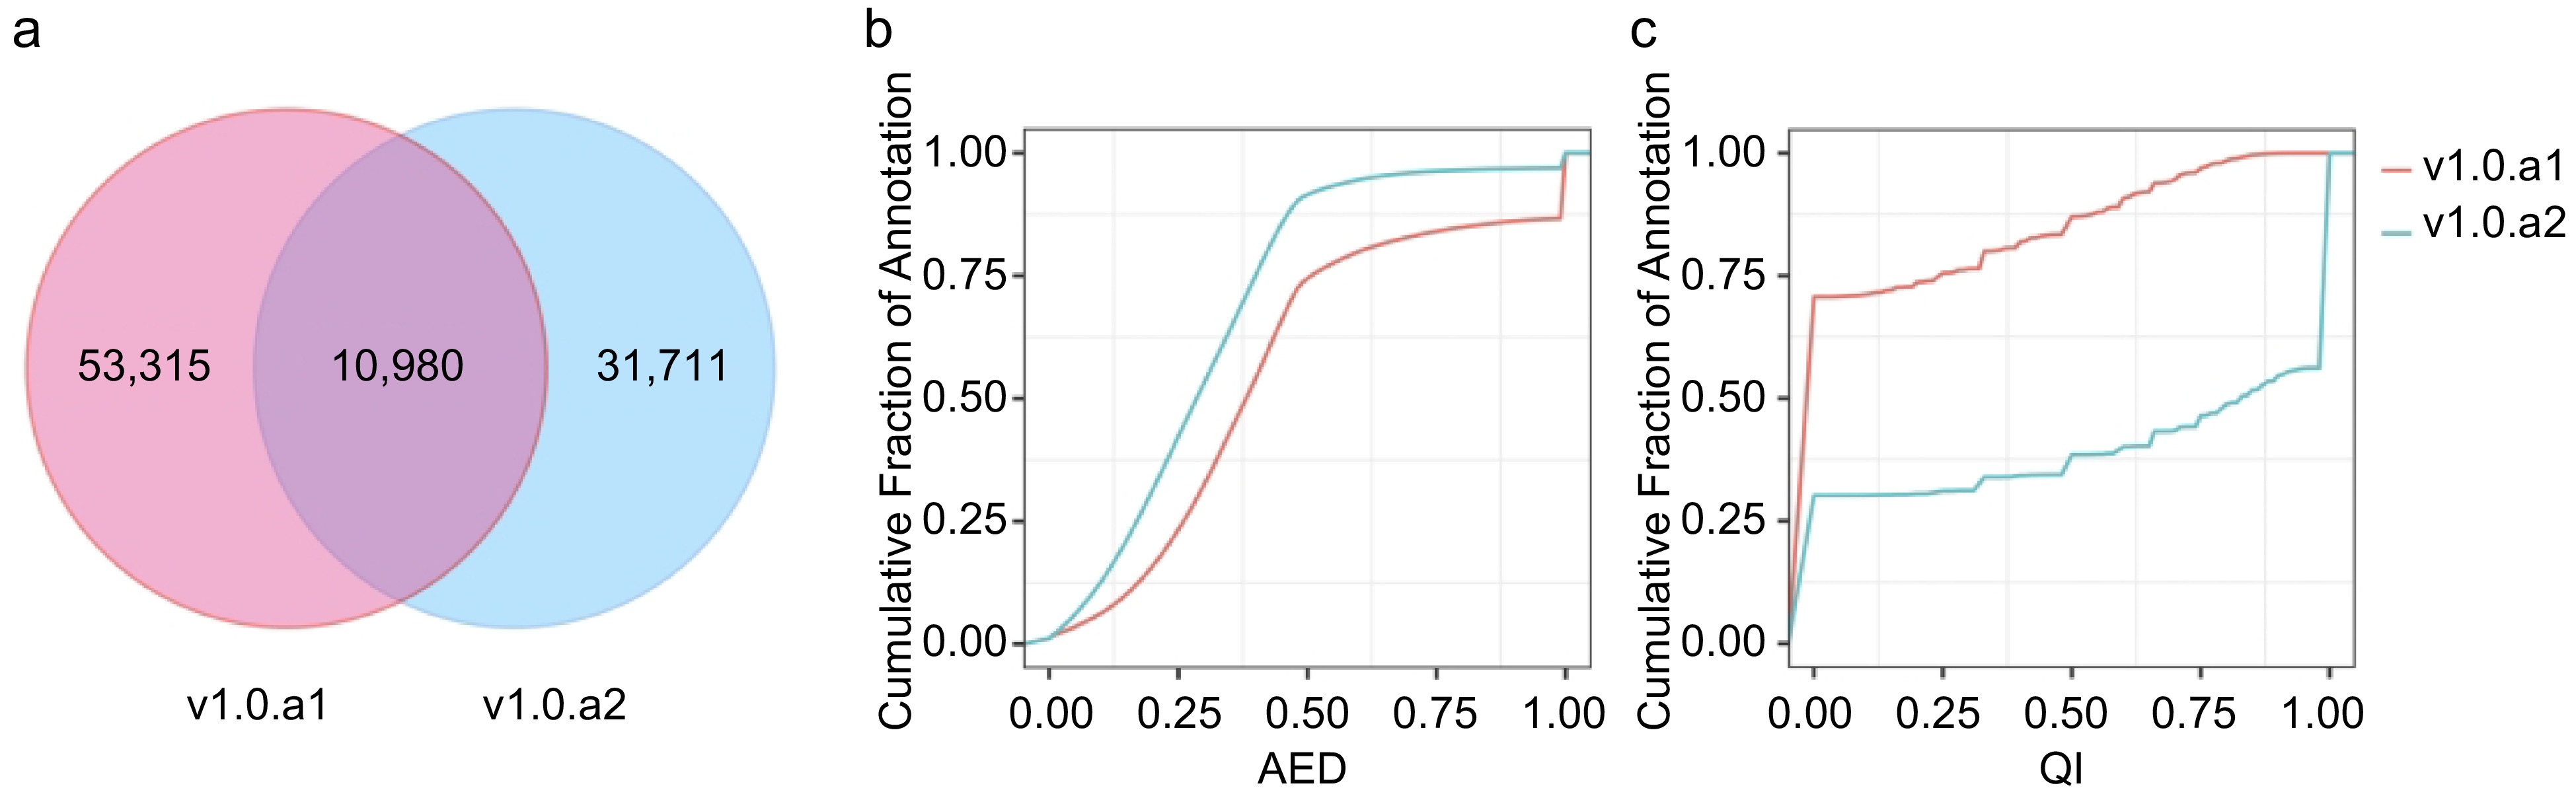
Figure 2.
Comparison of v1.0.a1 and v1.0.a2 annotation. (a) Venn diagram showing the common and unique gene structure of the CDS region between v1.0.a1 and v1.0.a2. (b) Cumulative AED distribution curves for the annotations in v1.0.a1 and v1.0.a2. (c) Cumulative QI distribution curves for the annotations in v1.0.a1 and v1.0.a2.
-
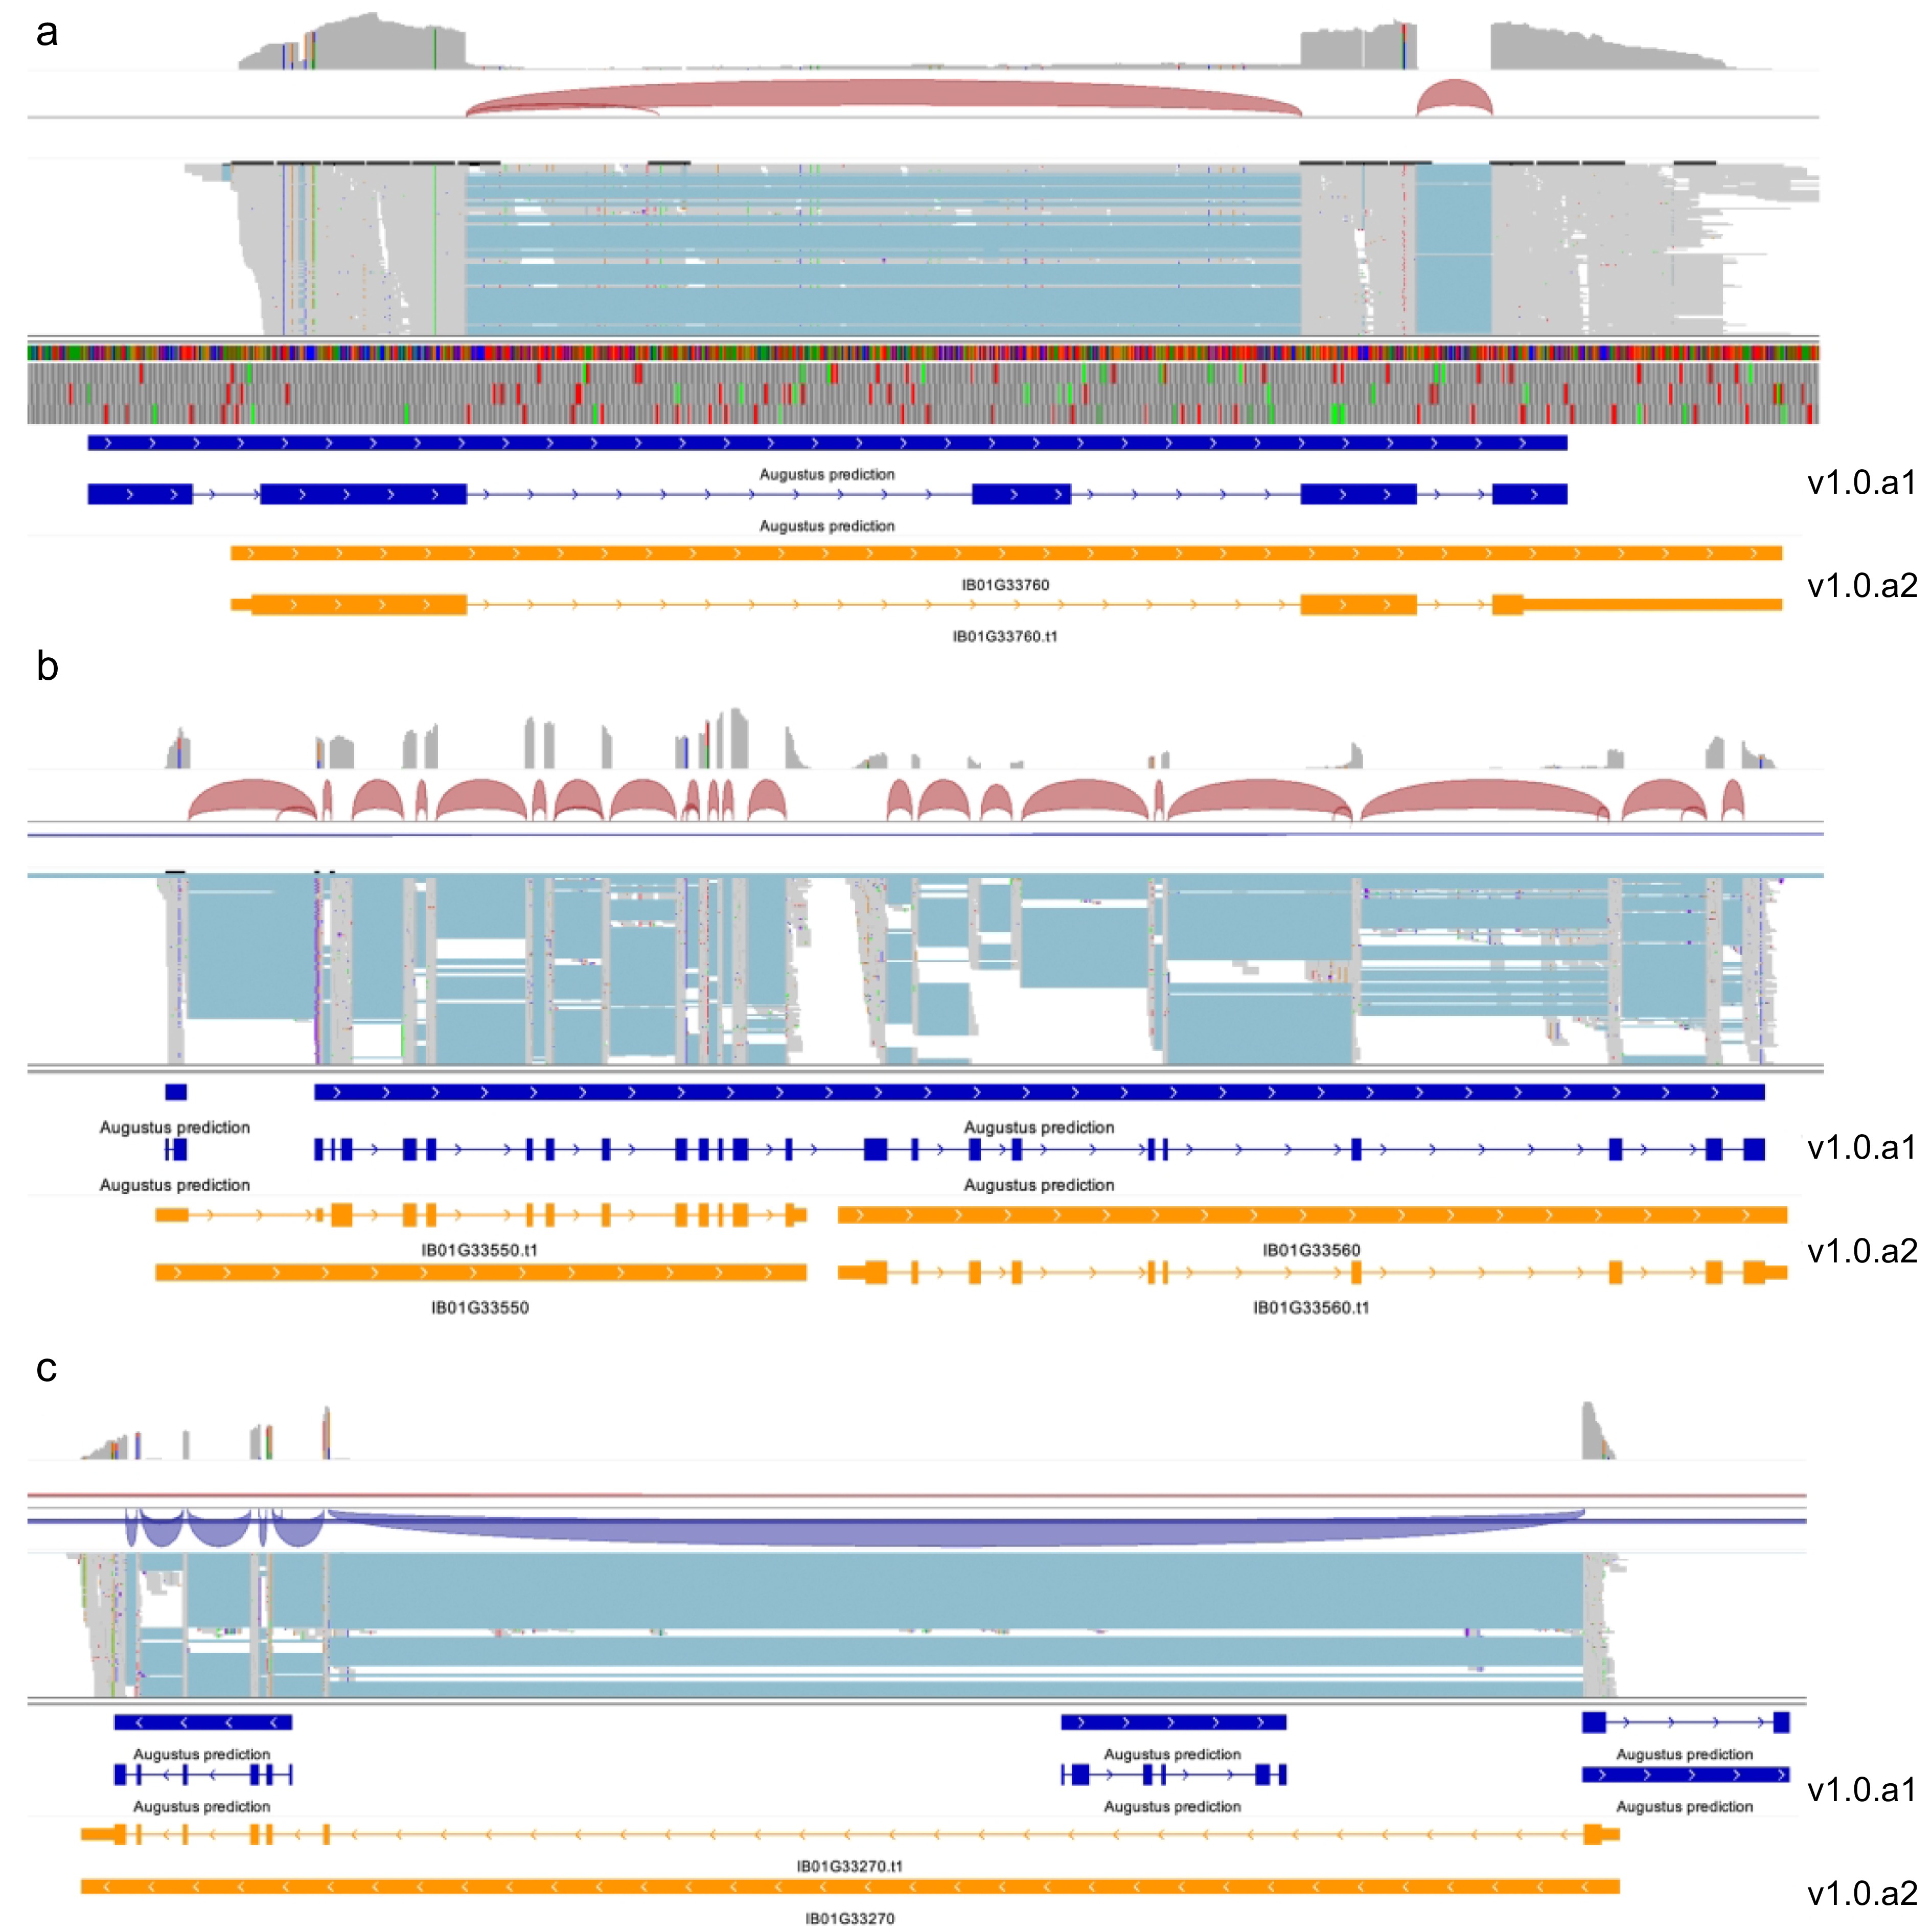
Figure 3.
Examples of known genes with improved annotations. (a) IGV view of the gene model for IB01G33760 has been updated in the new annotation. (b) IGV view of the RNA-seq mapped reads for the two adjacent genes (IB01G33550 and IB01G33560) with modified gene models in v1.0.a2 are compared to those in v1.0.a1. (c) In v1.0.a2, three genes from v1.0.a1 have been merged into a single gene, now identified as IB01G33270.
-
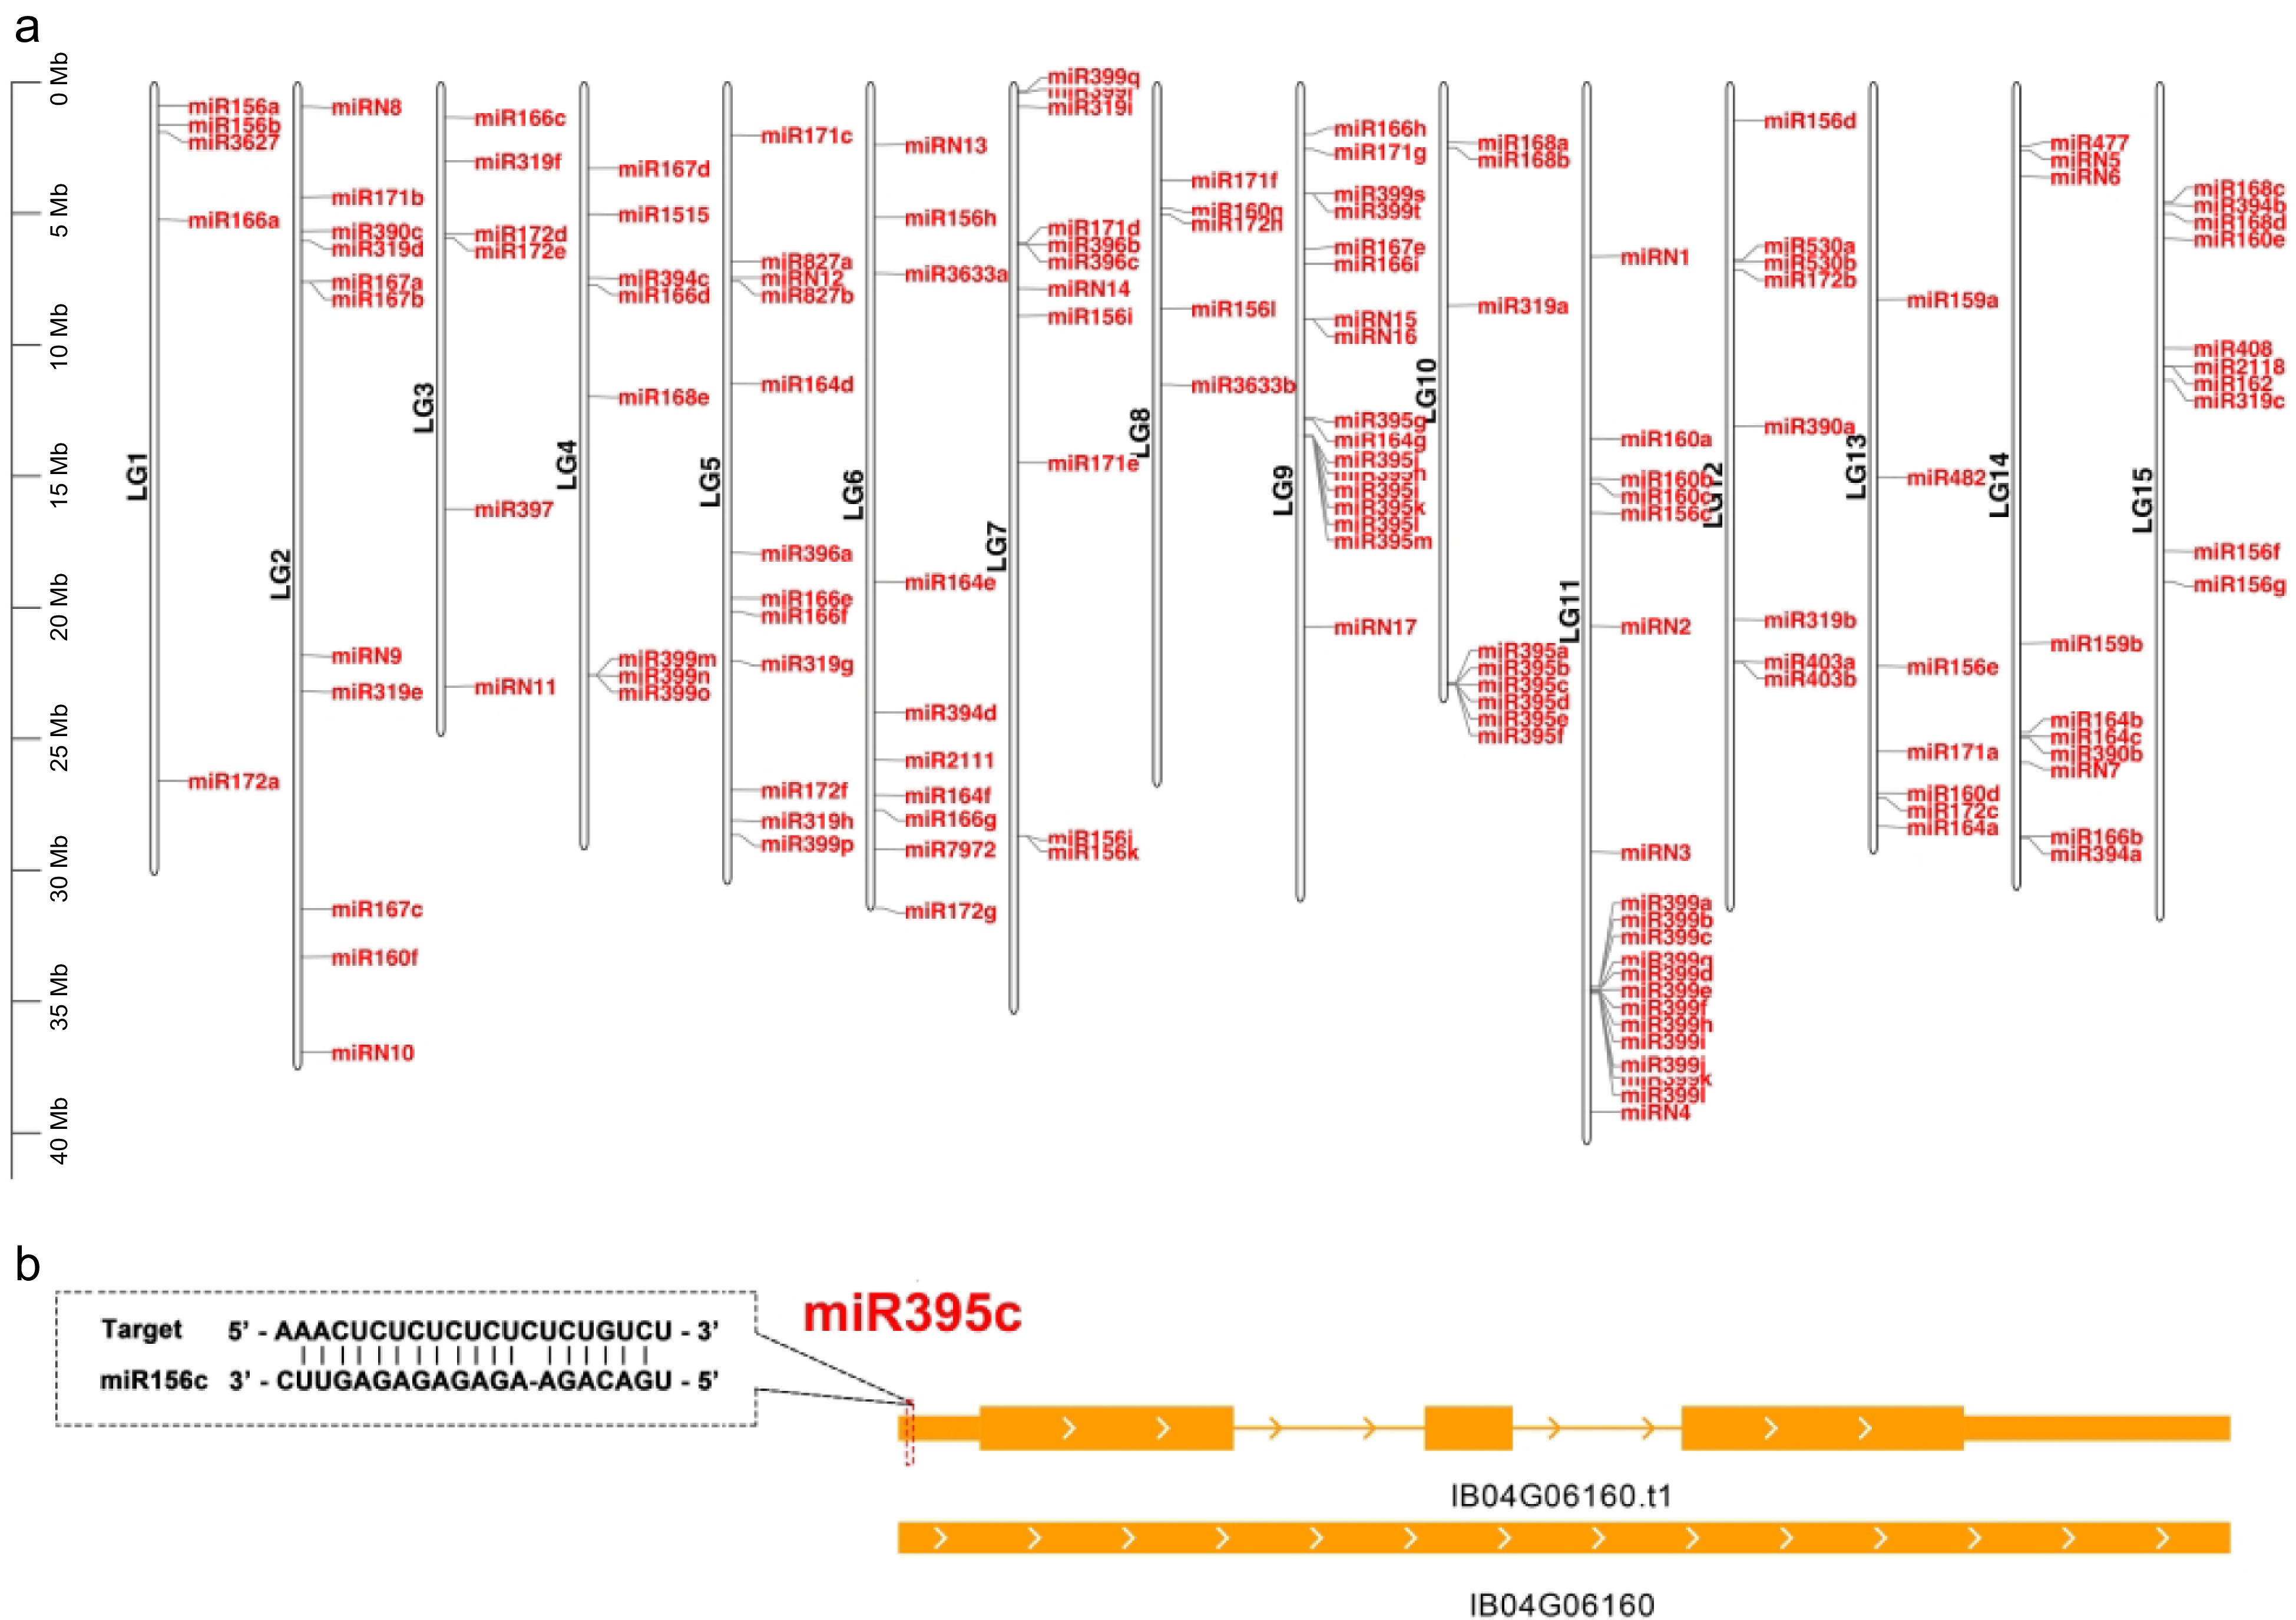
Figure 4.
Distribution of the miRNA genes in different chromosomes. (a) Distribution of the annotated miRNA genes (both known and new) in different chromosomes in the Taizhong 6 genome. (b) The target site of miR395c in IB04G06160. This gene is targeted by miR395c at the 5' UTR. The target sites are indicated by a red dashed box.
-

Figure 5.
Expression profiles of miRNAs in storage roots. In this figure, we present the expression profiles of miRNAs in various storage root stages: F for fibrous roots, D1 for initial storage roots (with a diameter of approximately 1 cm), D3 for storage roots (with a diameter of approximately 3 cm), D5 for storage roots (with a diameter of approximately 5 cm), and D10 for storage roots (with a diameter of approximately 10 cm). The color bar on the right side of the panel indicates the relative expression levels of miRNAs across different stages.
-
Type v1.0.a1 v1.0.a2 Protein-coding genes Number of genes 64,295 42,751 Mean length of genomic loci 2,498 2,953 Mean exon number 5.2 8.1 Mean CDS length 227 214 Mean length of introns 307 423 Genes with 5' UTR − 32,220 Genes with 3' UTR − 32,241 Genes with both 5' and 3' UTR − 31,859 Mean 5' UTR length (bp) − 428 Mean 3' UTR length (bp) − 525 Number of genes with isoforms − 8,736 Mean isoform number per gene 1.0 1.5 Genes with GO terms 17,873 17,720 Genes with functional annotations 38,602 32,629 Complete BUSCOs 89.5% 97.4% Fragmented BUSCOs 6.0% 0.7% Missing BUSCOs 4.5% 1.9% Table 1.
Summary of the v1.0.a2 annotation.
Figures
(5)
Tables
(1)