-
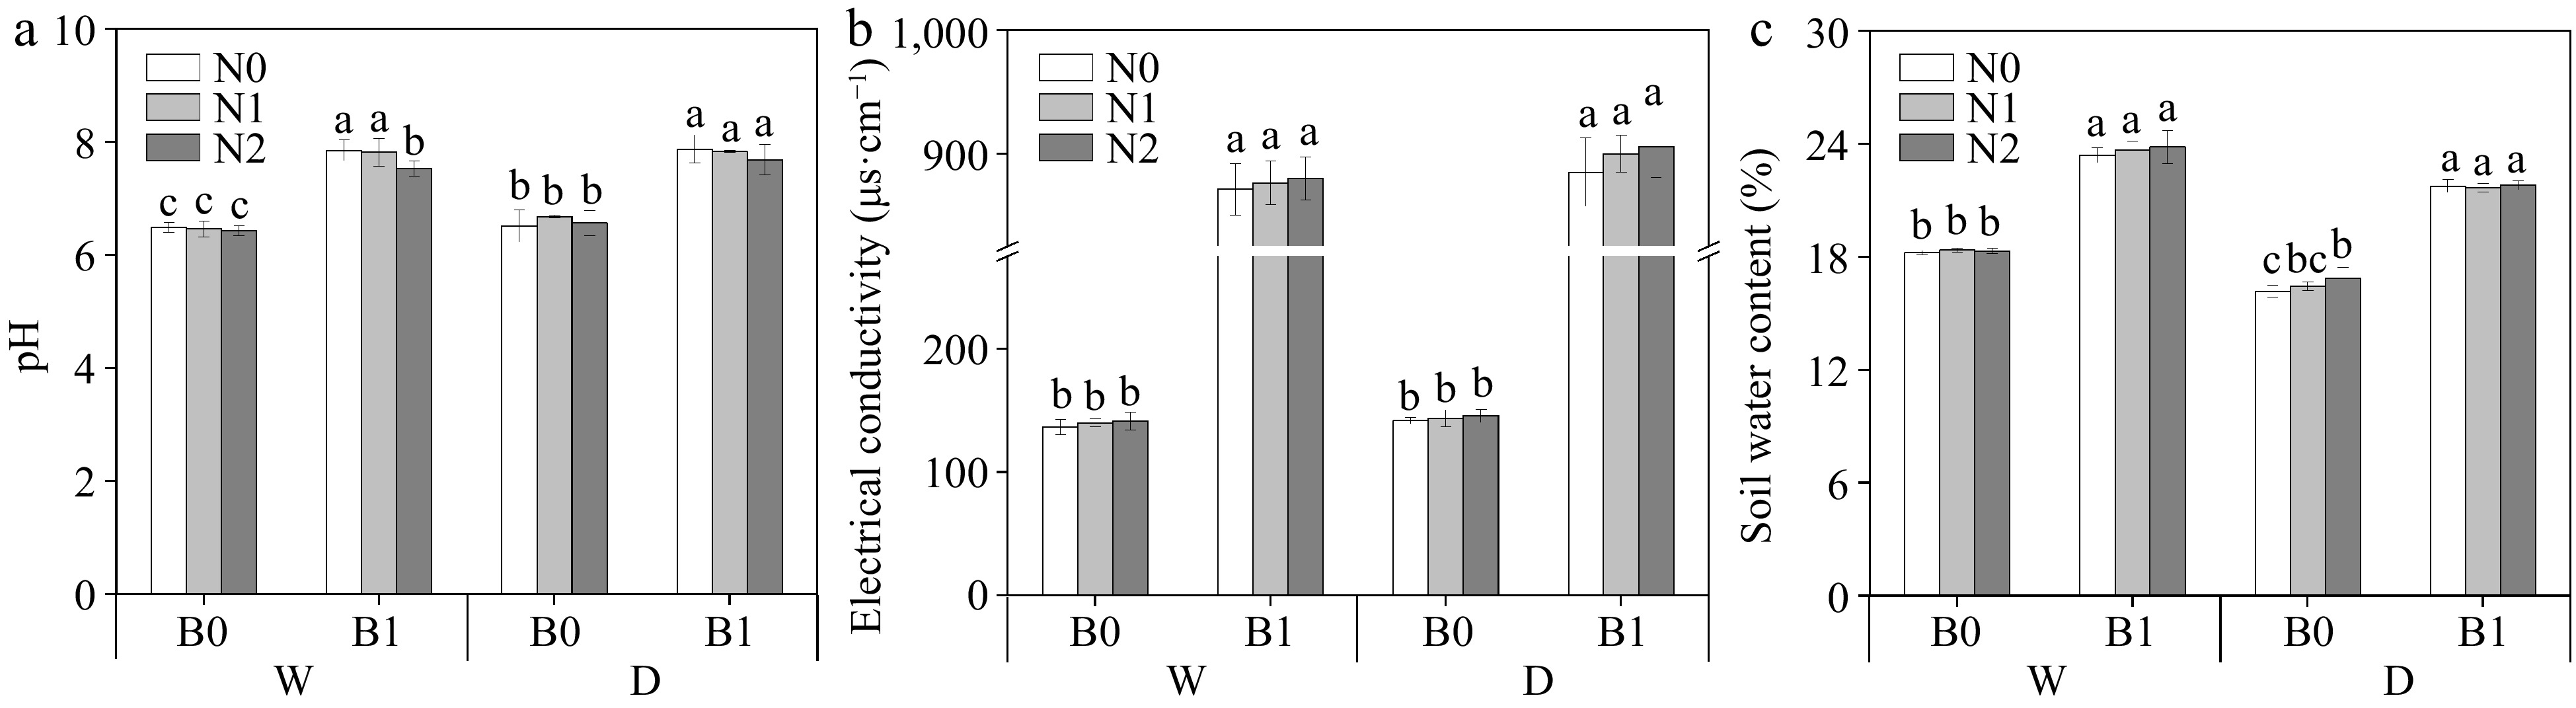
Figure 1.
Effect of different treatments on soil pH, electrical conductivity (EC), and soil water content (SWC). The different letters indicate significant differences (p < 0.05) between different treatments. The treatments are biochar (B0 and B1), nitrogen fertilizer (N0, N1, and N2) and irrigation (W and D).
-
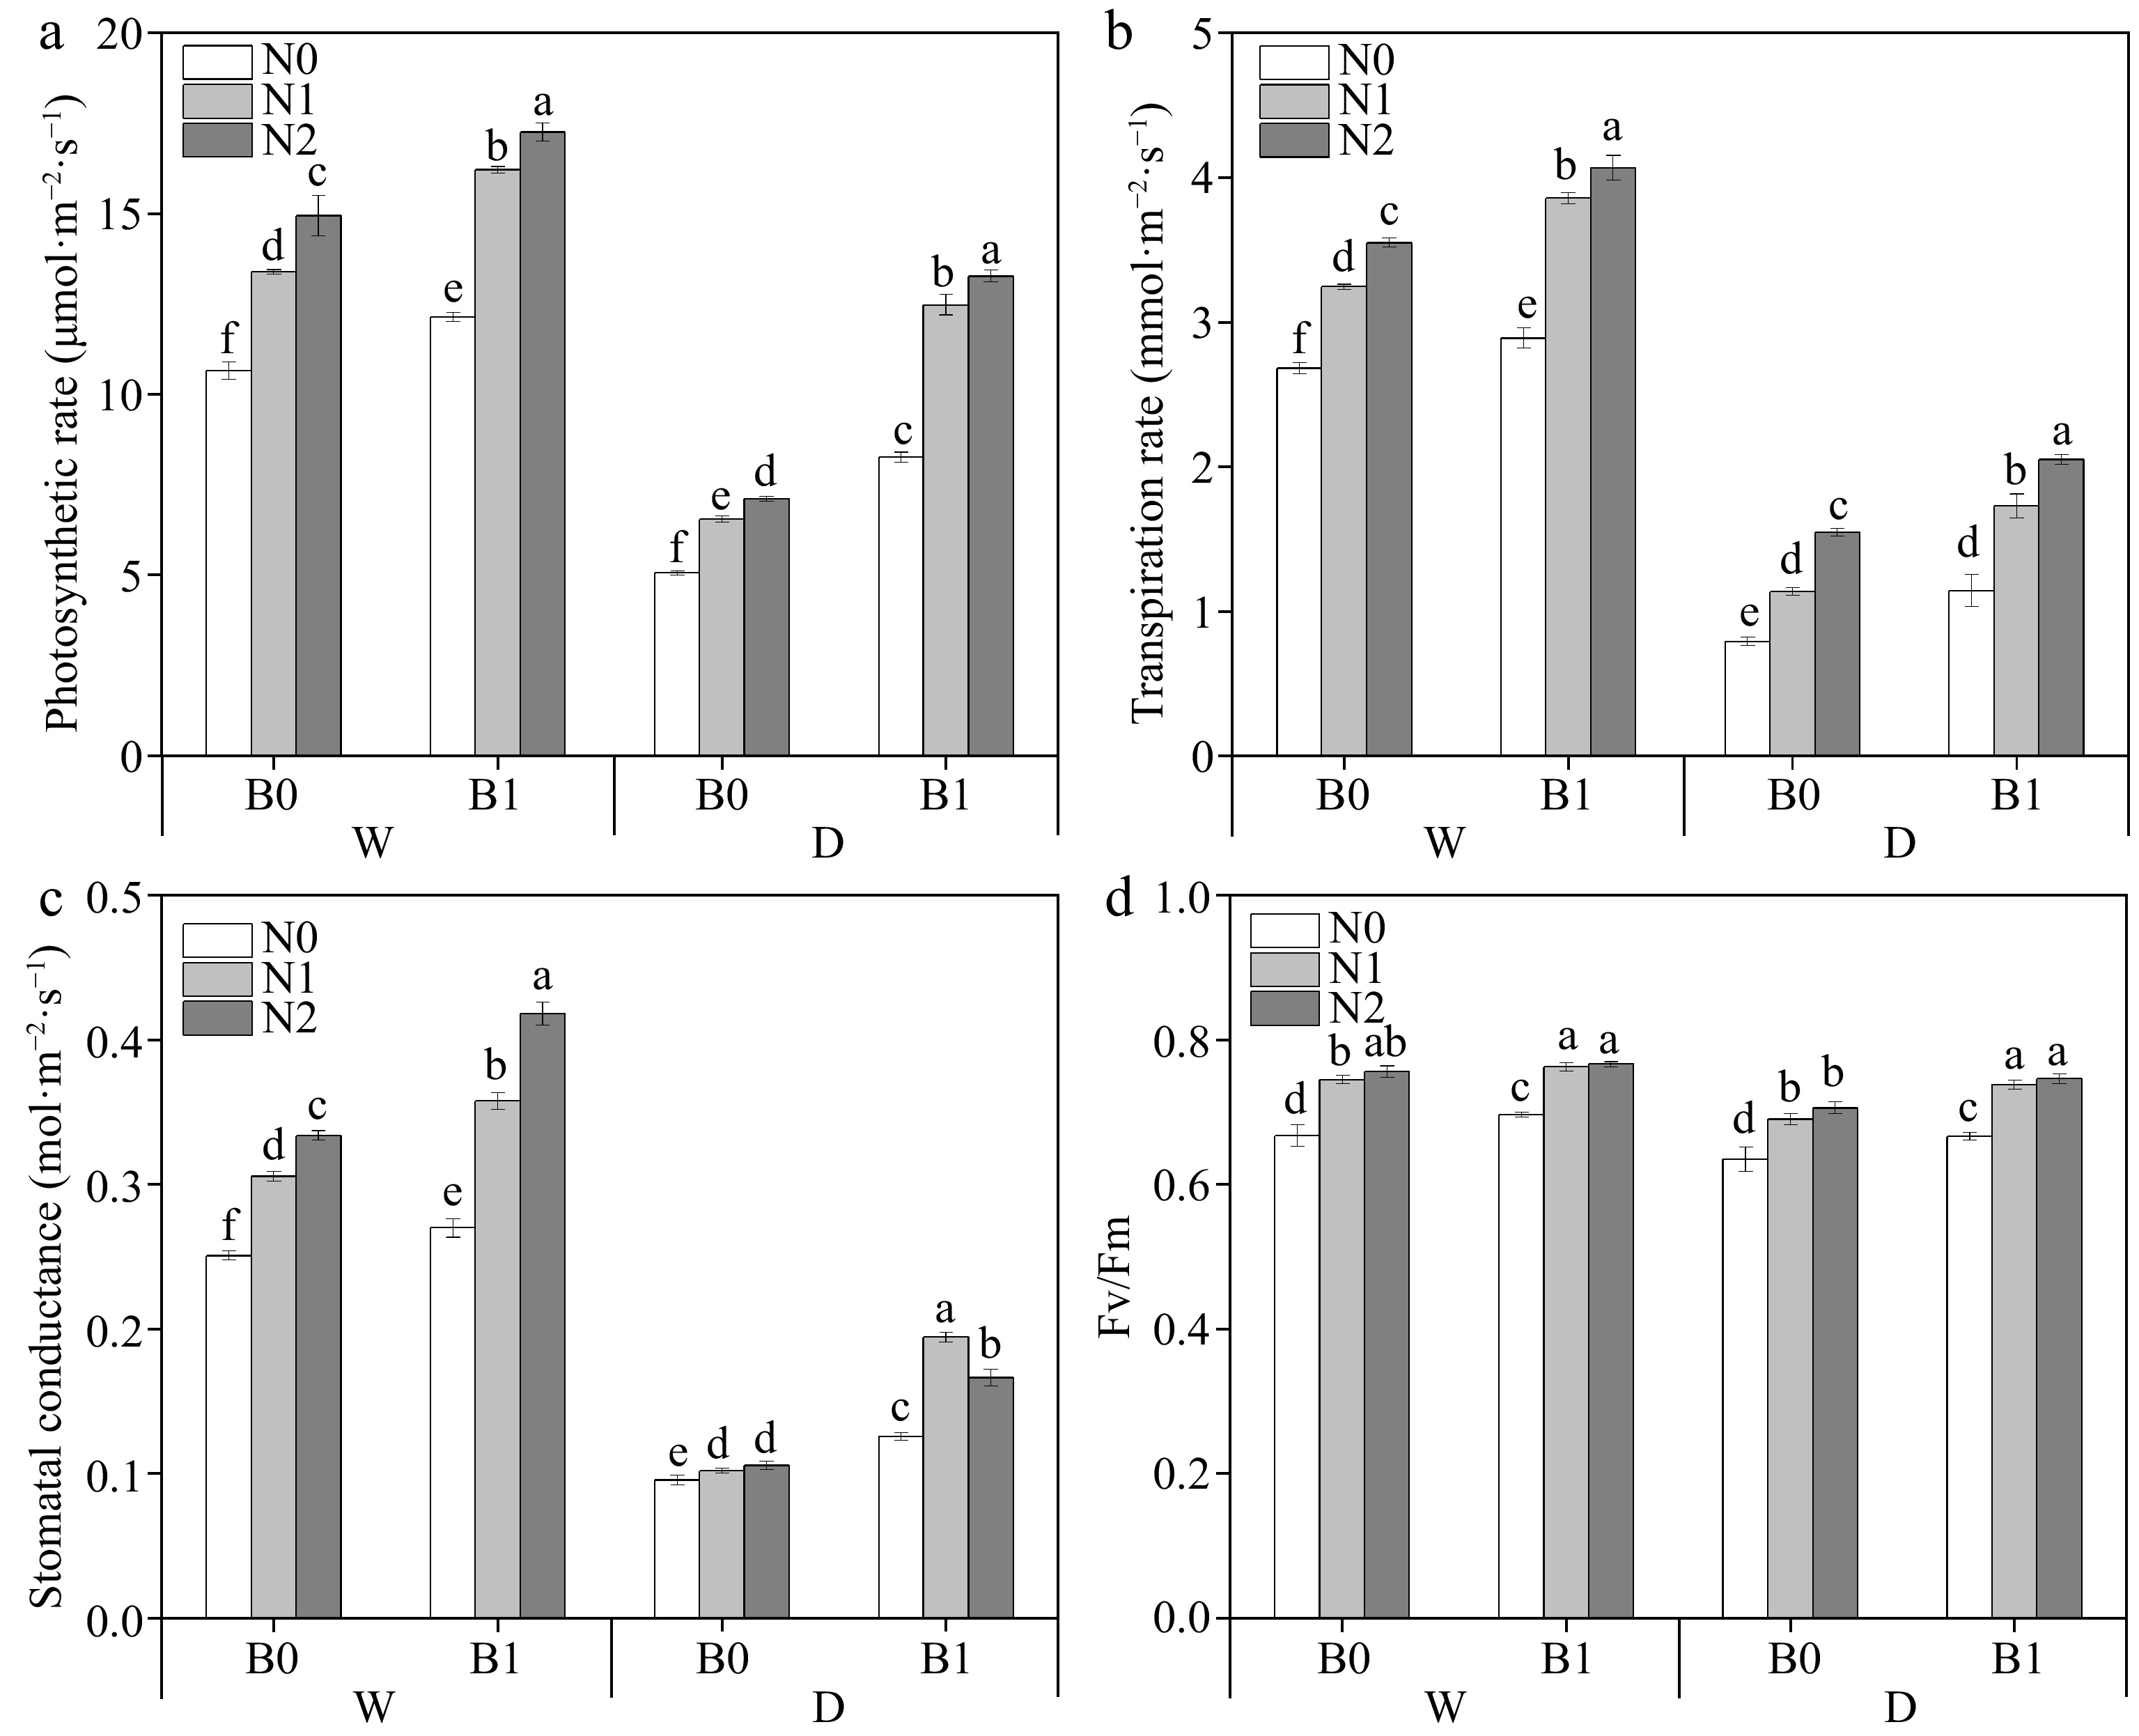
Figure 2.
Effects of different treatments on photosynthetic rate (Pn), transpiration rate (Tr), stomatal conductance (gs) and photochemical efficiency (Fv/Fm) in perennial ryegrass. The different letters indicate significant differences (p < 0.05). The treatments are biochar (B0 and B1), nitrogen fertilizer (N0, N1, and N2) and irrigation (W and D).
-
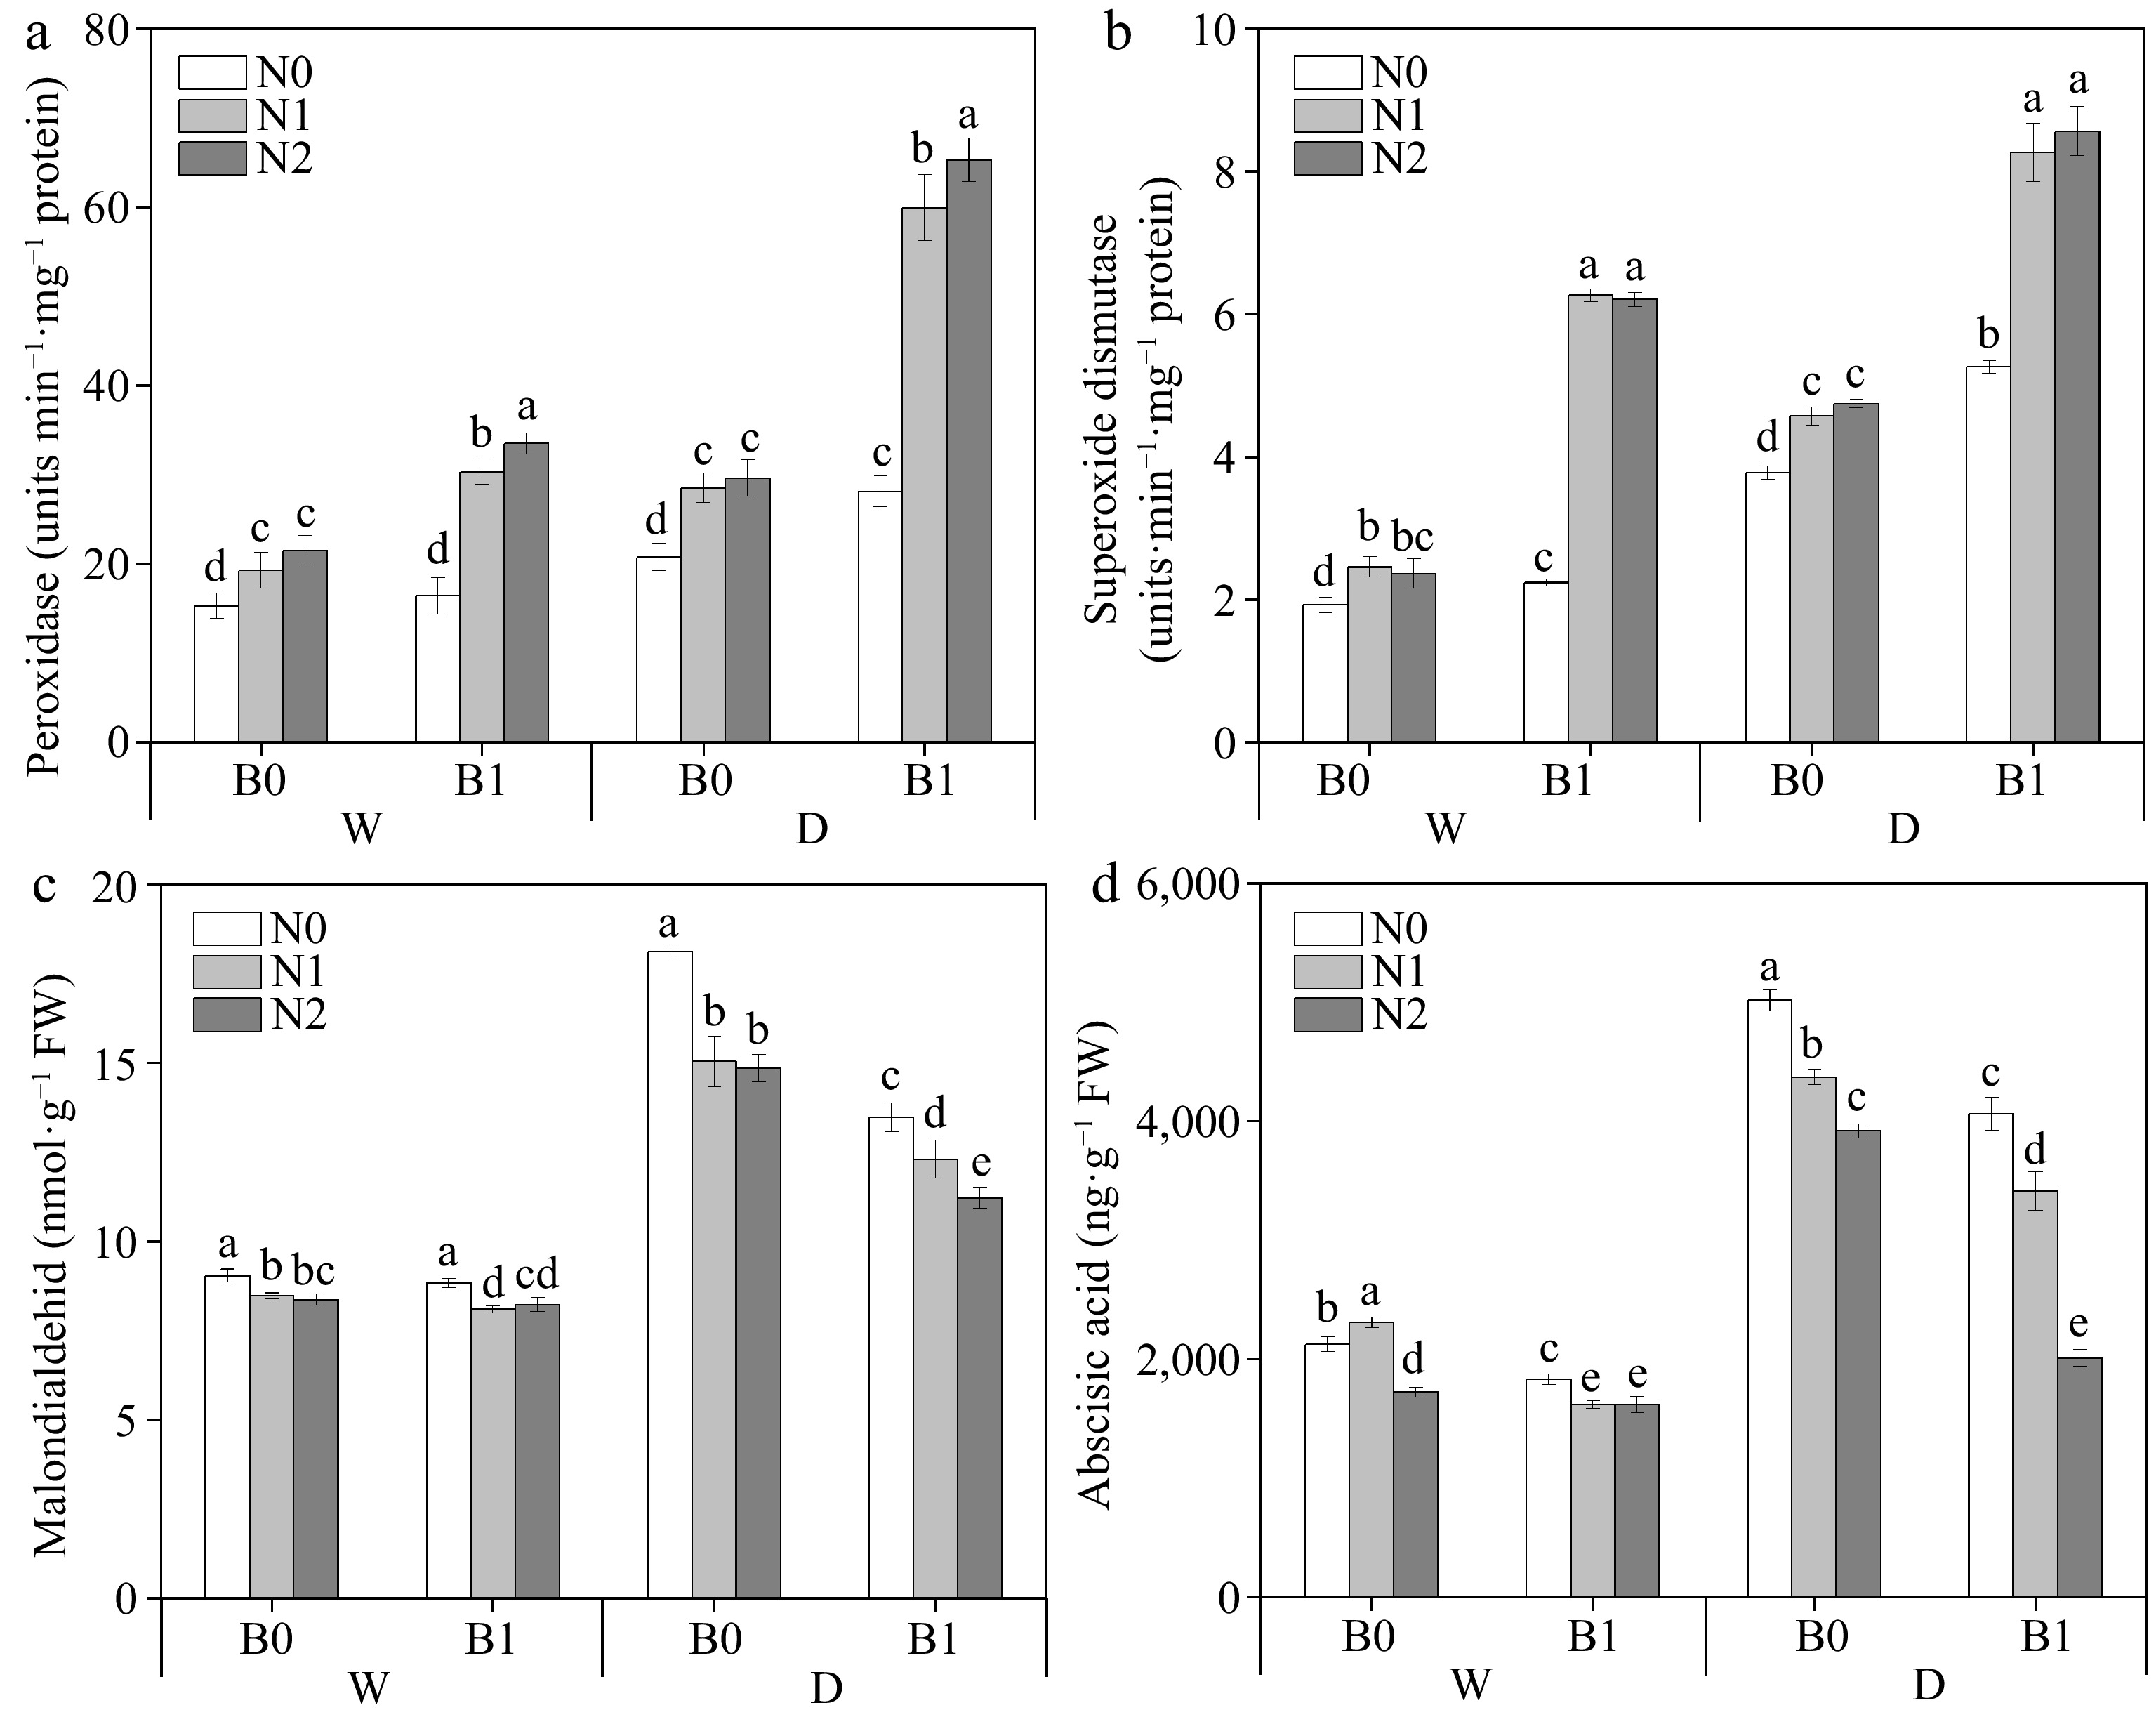
Figure 3.
Effects of different treatments on perennial ryegrass leaf peroxidase (POD) activity. (a) Photosynthetic rate, (b) superoxide dismutase (SOD) activity, (c) malondialdehid (MDA) content, and (d) abscisic acid (ABA) content. The different letters indicate significant differences (p < 0.05). The treatments are biochar (B0 and B1), nitrogen fertilizer (N0, N1, and N2) and irrigation (W and D).
-
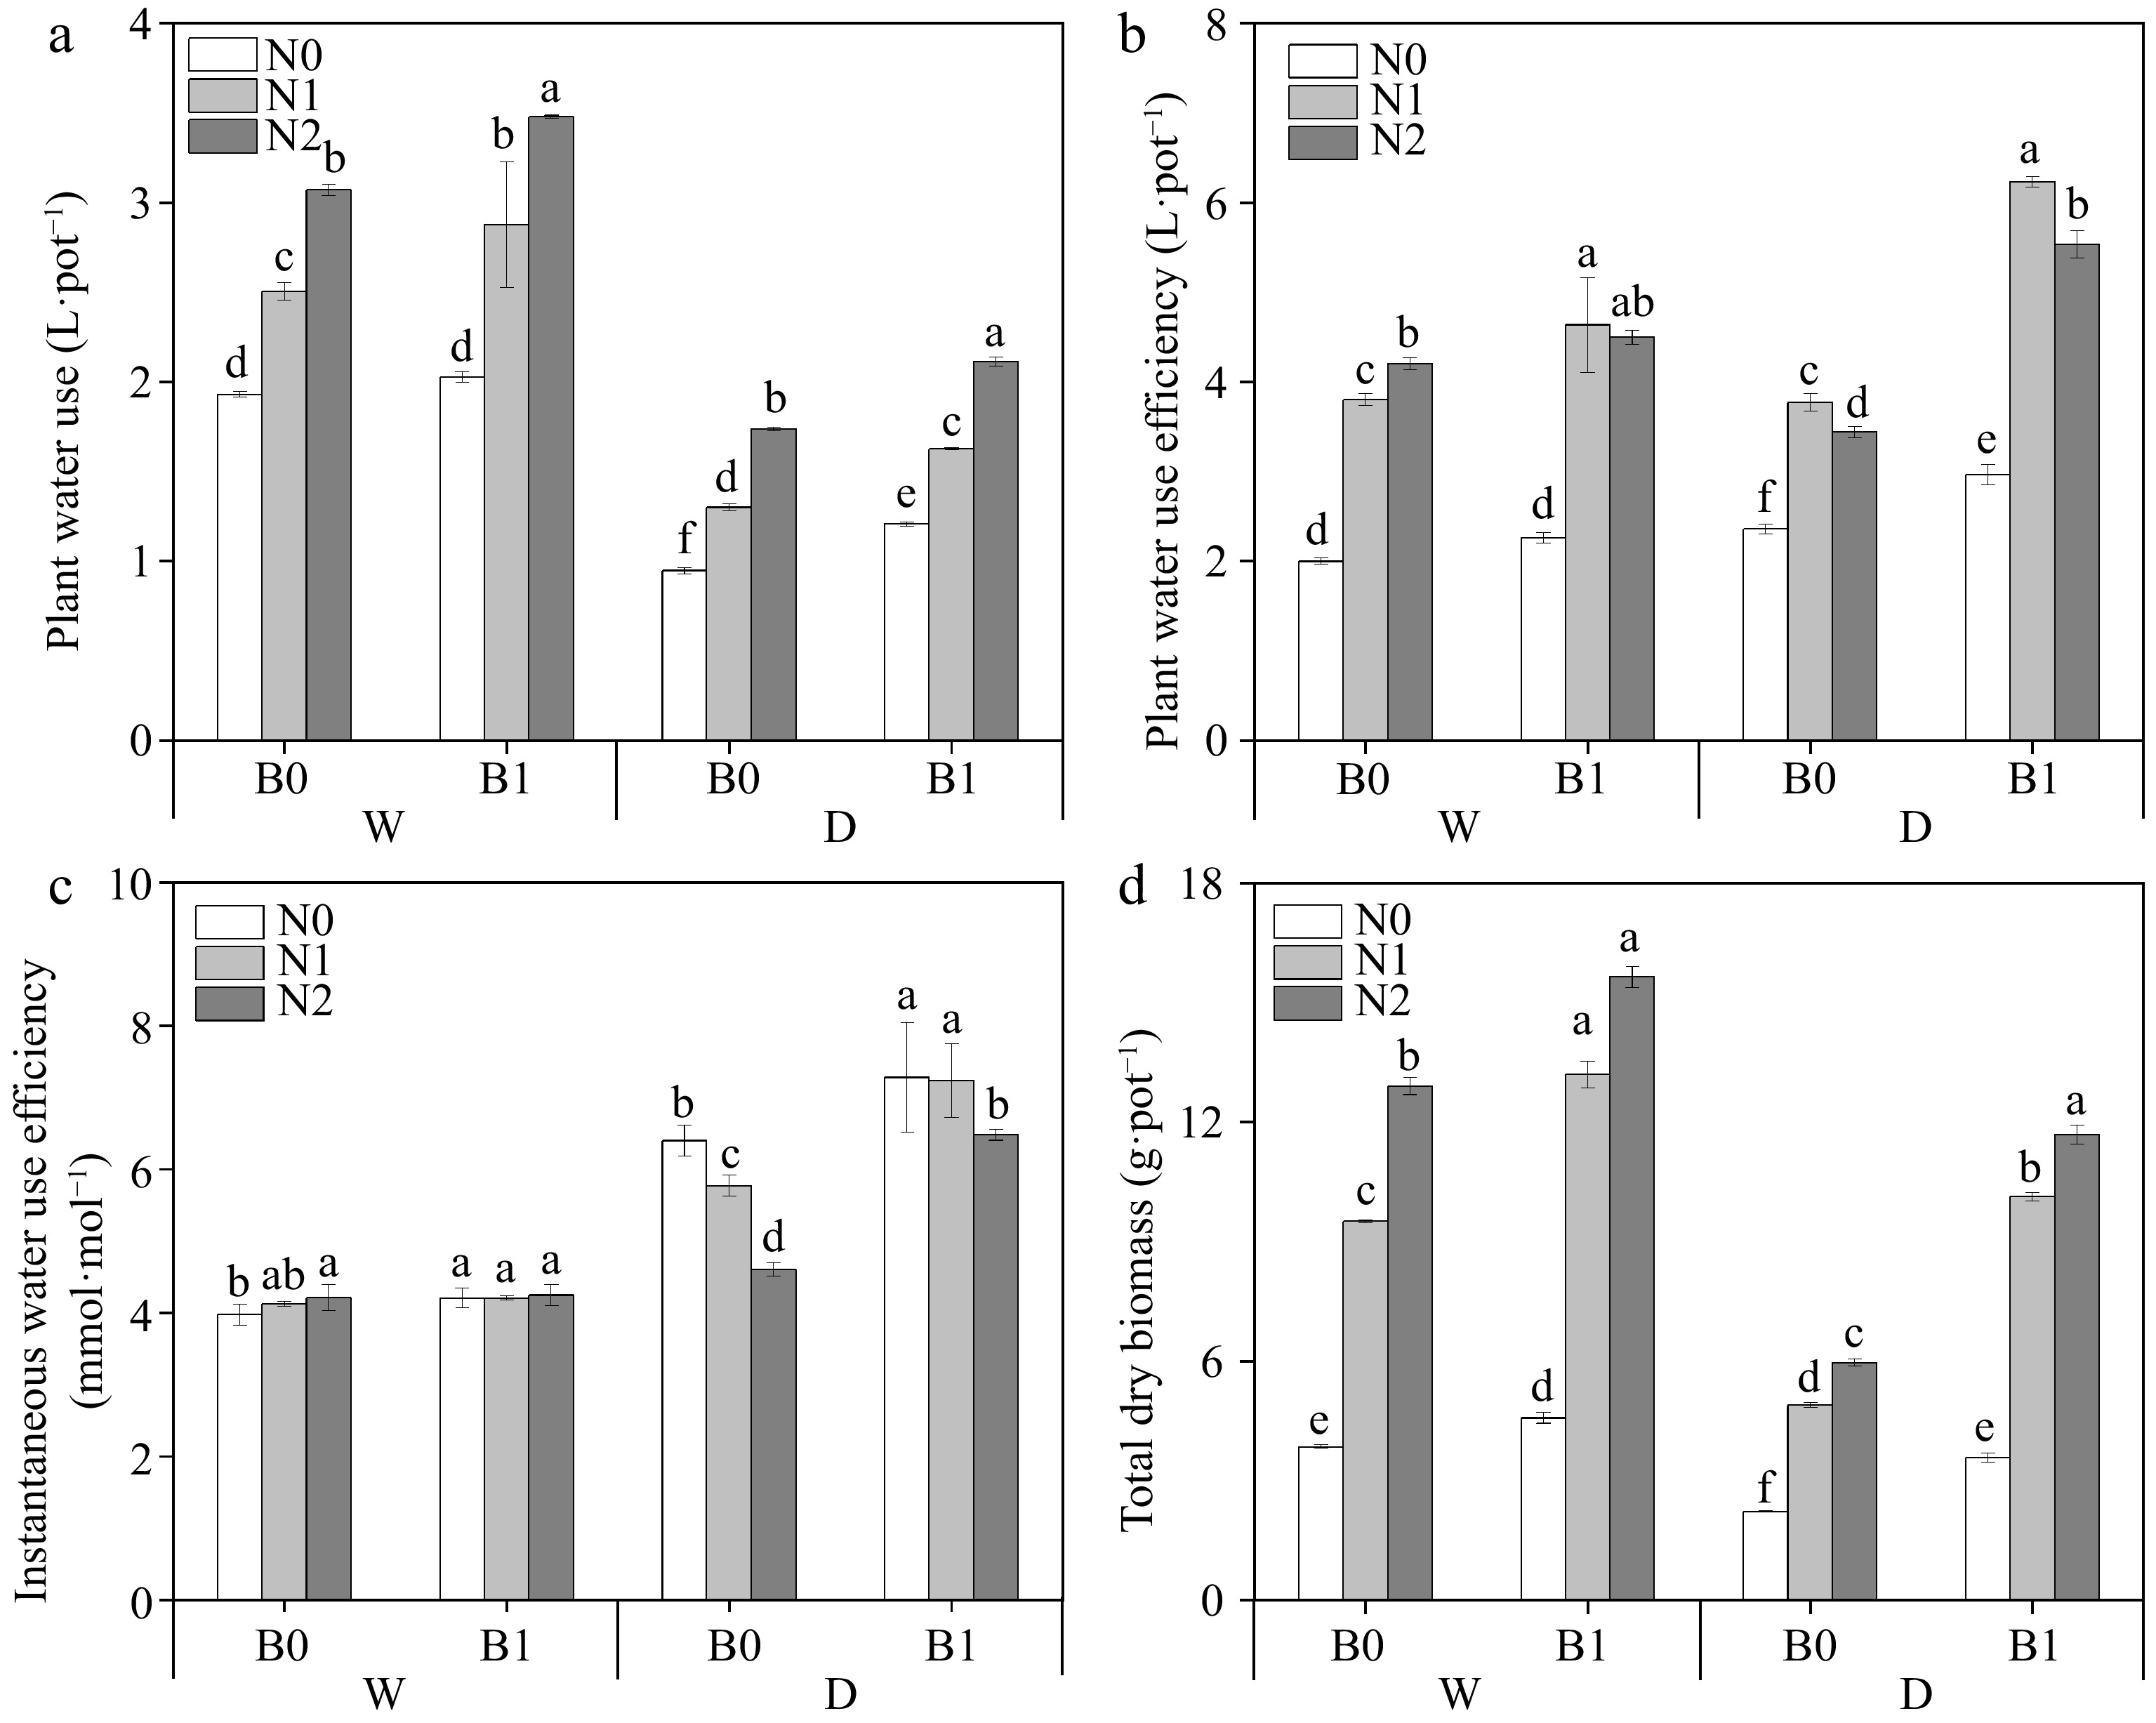
Figure 4.
Effects of different treatments on plant water use (PWU), plant water use efficiency (WUEp), instantaneous water use efficiency (WUEins) and total dry biomass (DW). The different letters indicate significant differences (p < 0.05). The treatments are biochar (B0 and B1), nitrogen fertilizer (N0, N1, and N2) and irrigation (W and D).
-
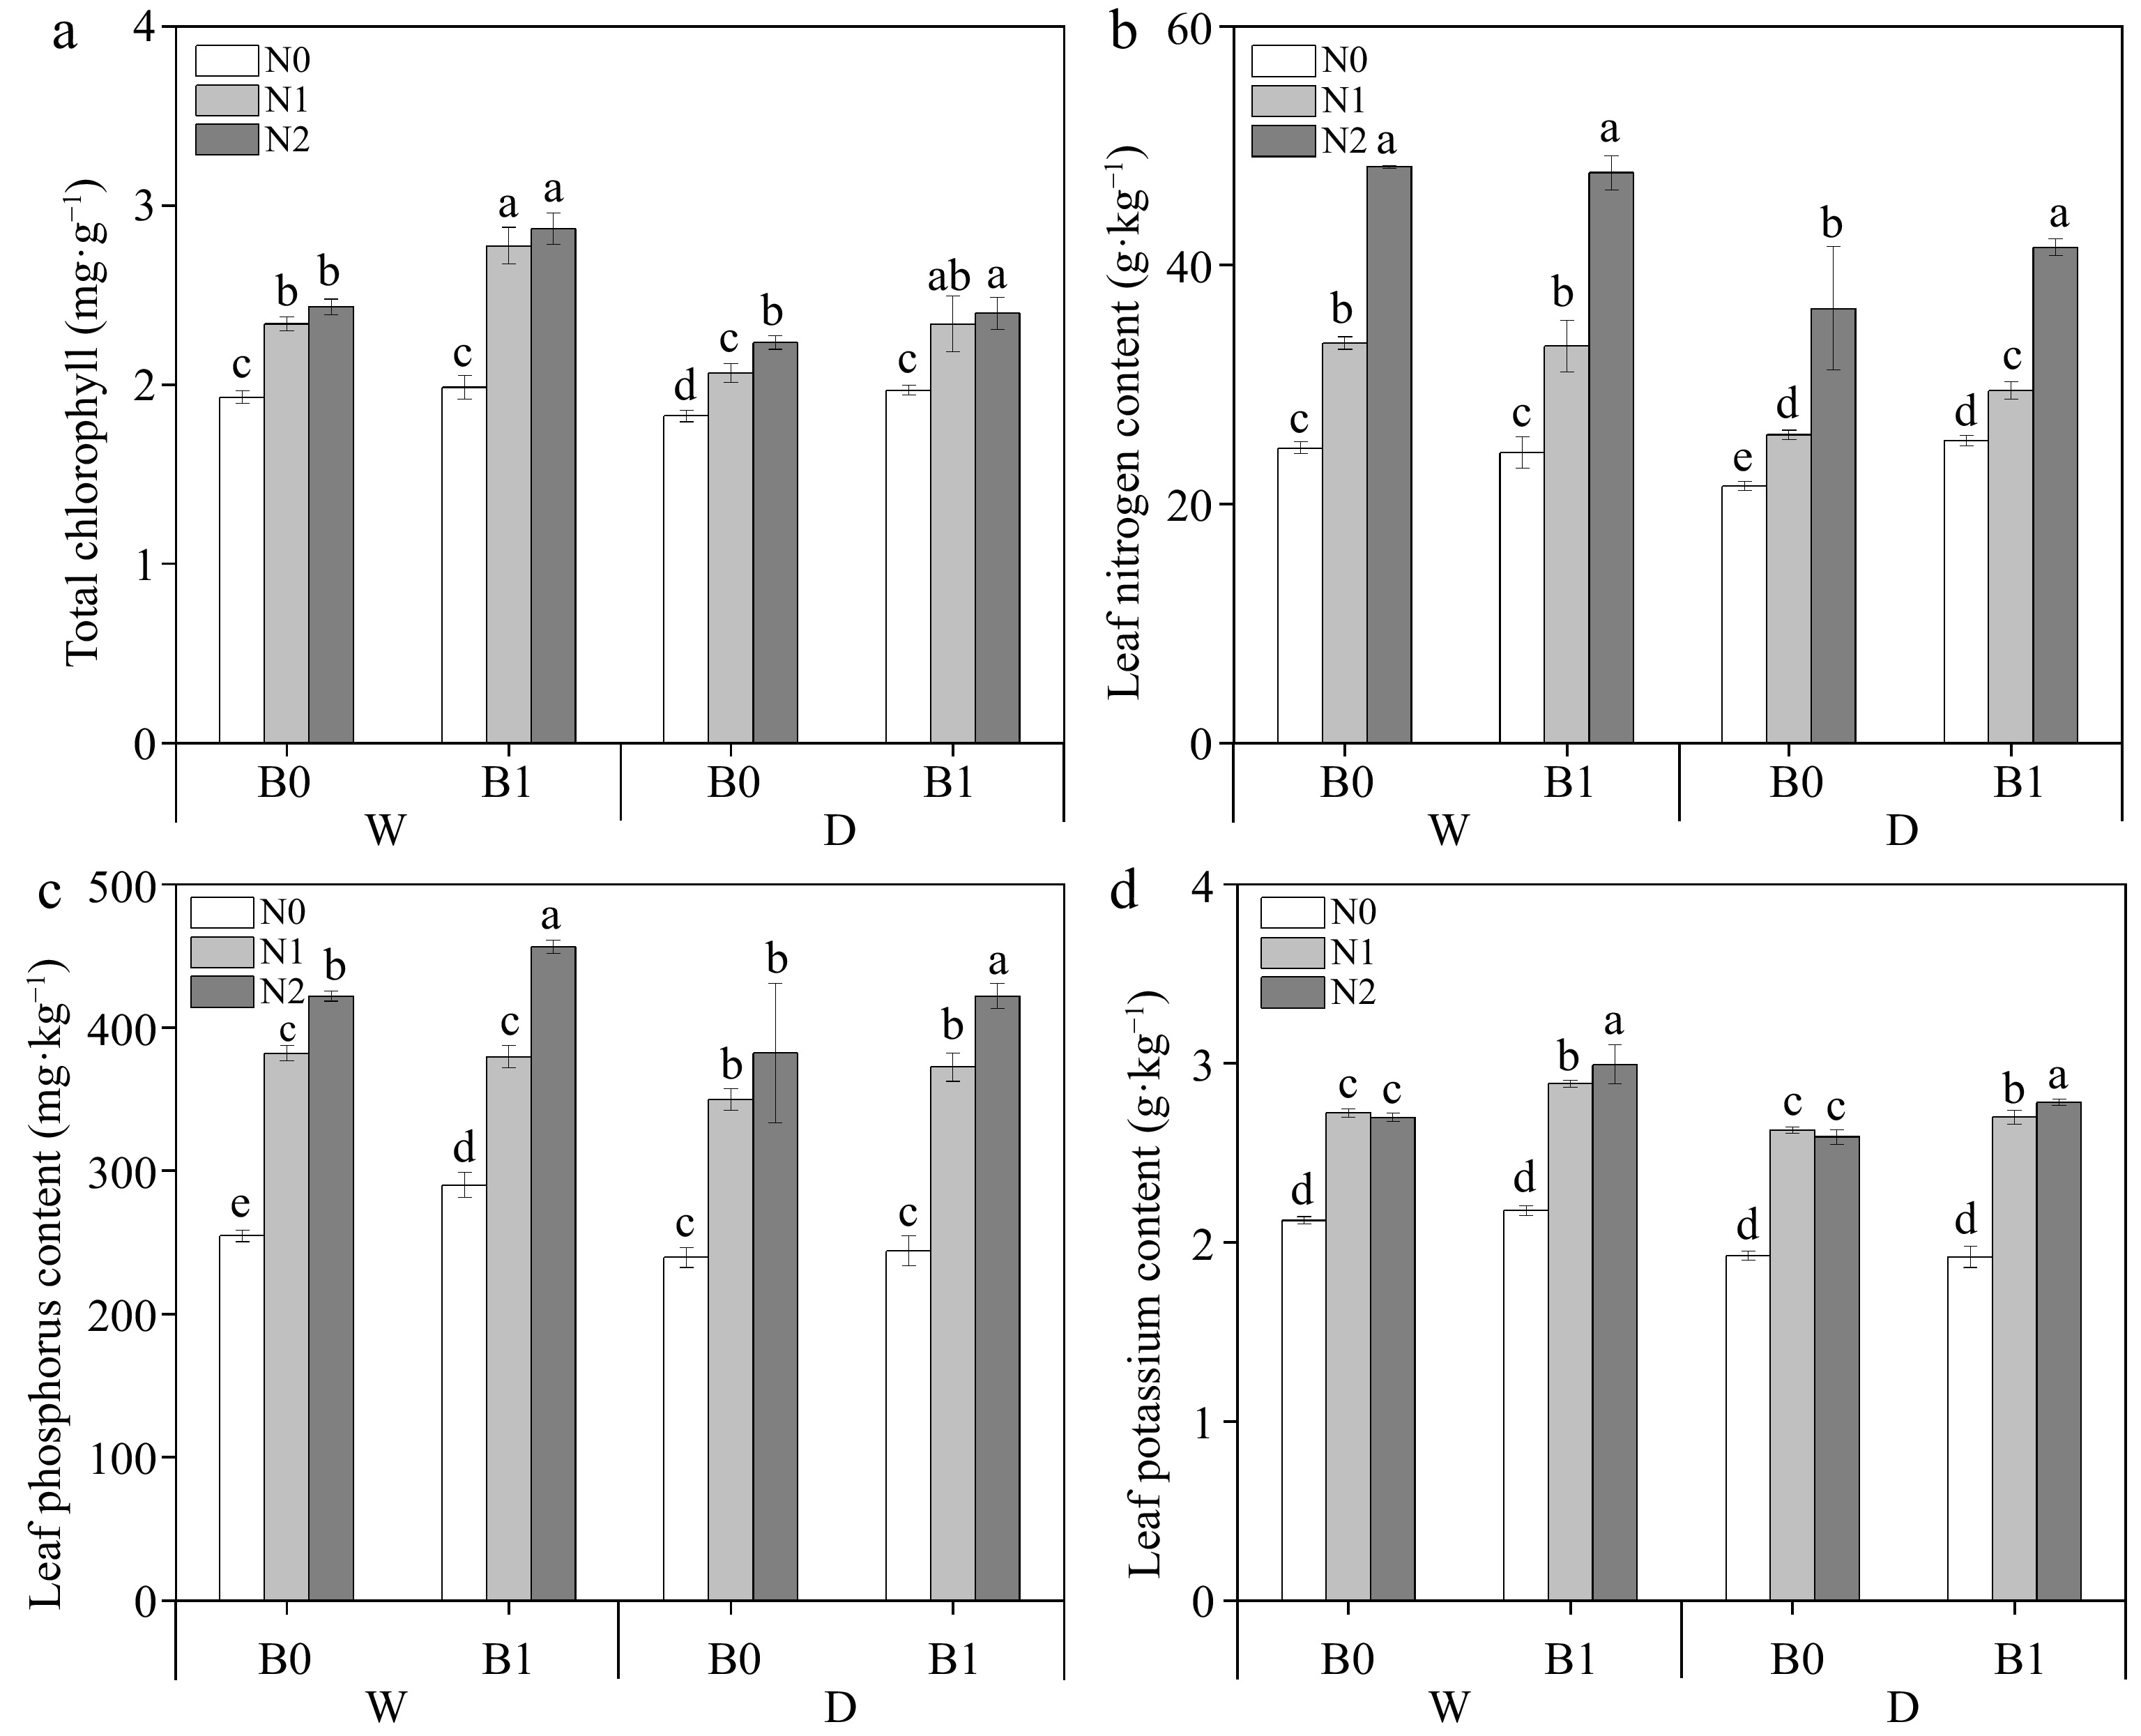
Figure 5.
Effect of different treatments on total chlorophyll content, total nitrogen (TN), total phosphorus (TP) and total potassium (TK) in perennial ryegrass leaves. The different letters indicate significant differences (p < 0.05). The treatments are biochar (B0 and B1), nitrogen fertilizer (N0, N1, and N2) and irrigation (W and D).
-
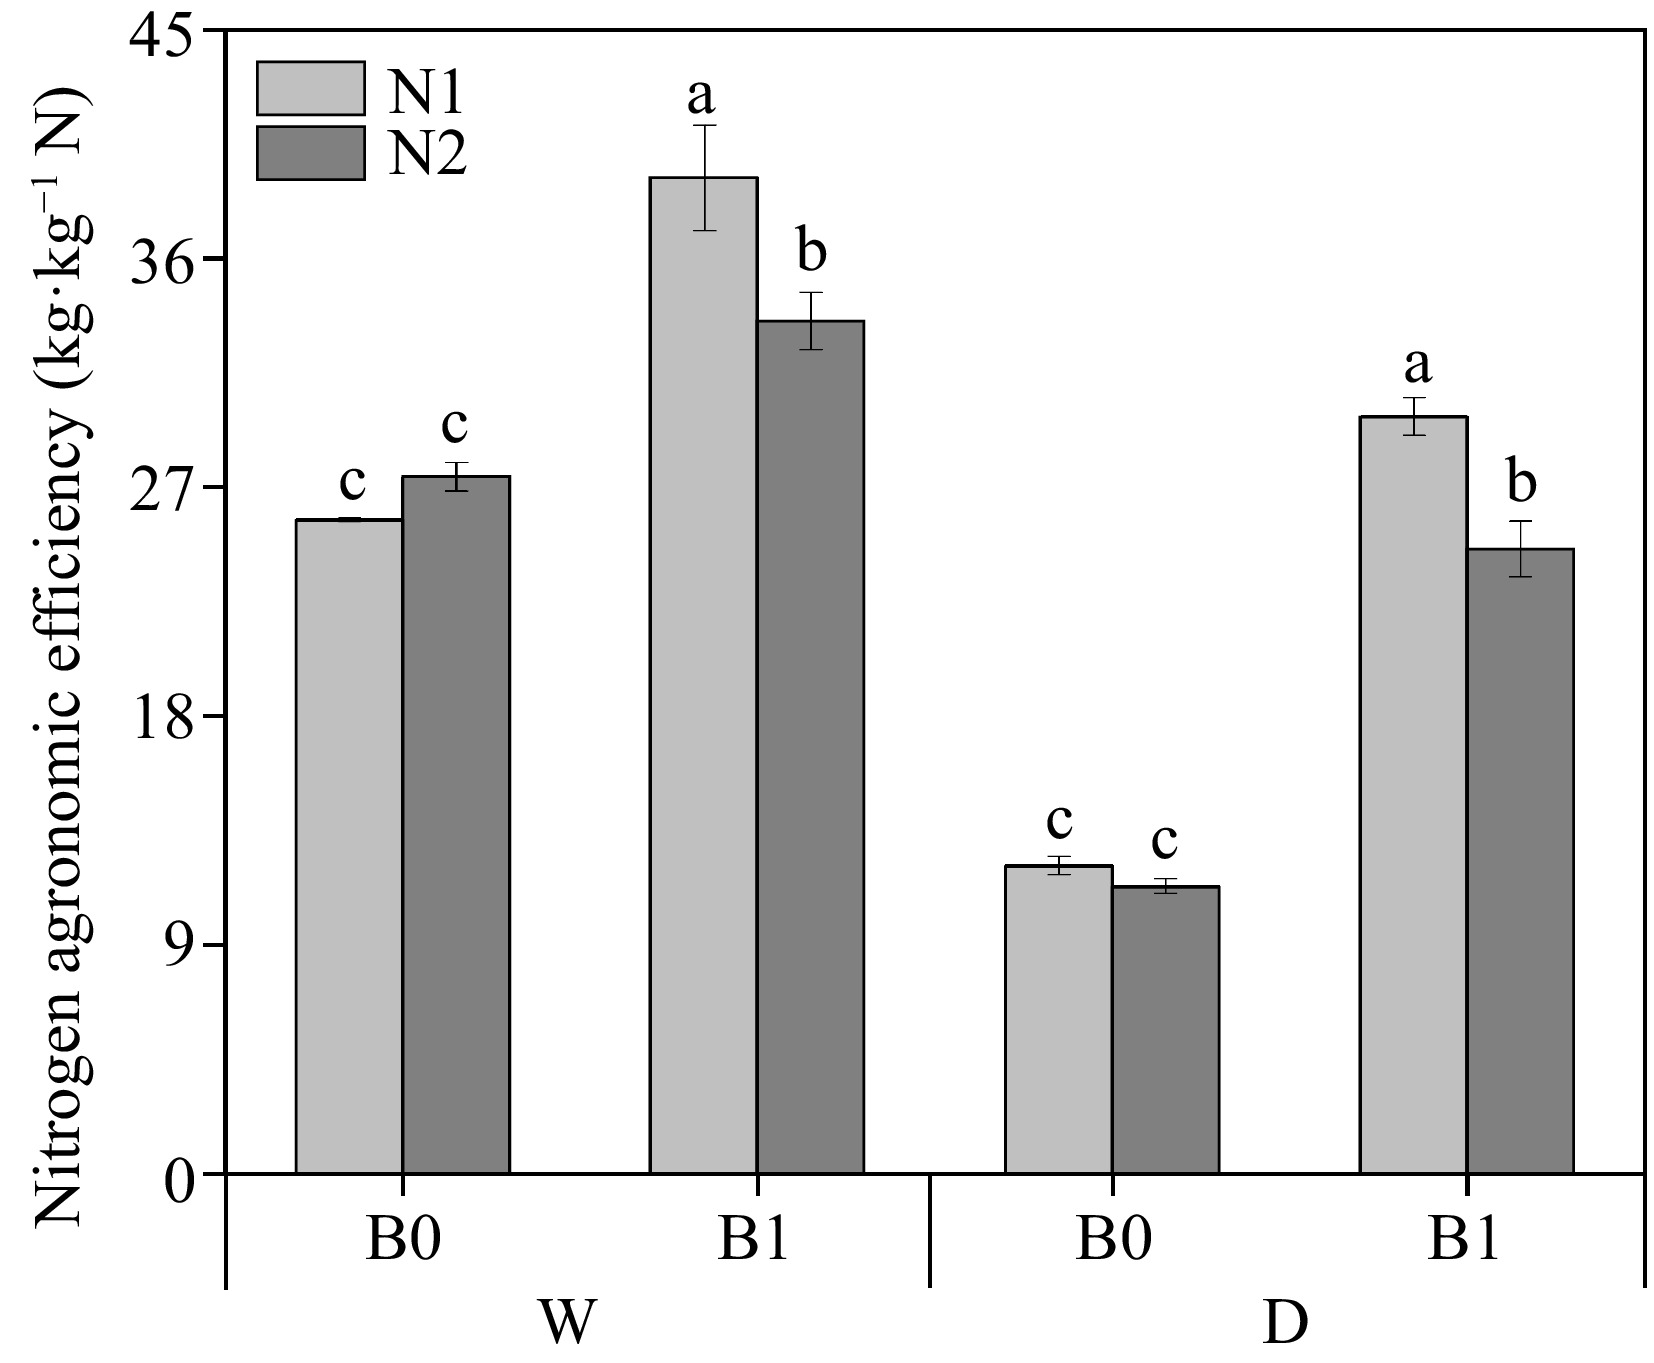
Figure 6.
Effect of different treatments on nitrogen agronomic efficiency (NAE) of perennial ryegrass. The different letters indicate significant differences (p < 0.05). The treatments are biochar (B0 and B1), nitrogen fertilizer (N1 and N2) and irrigation (W and D).
-
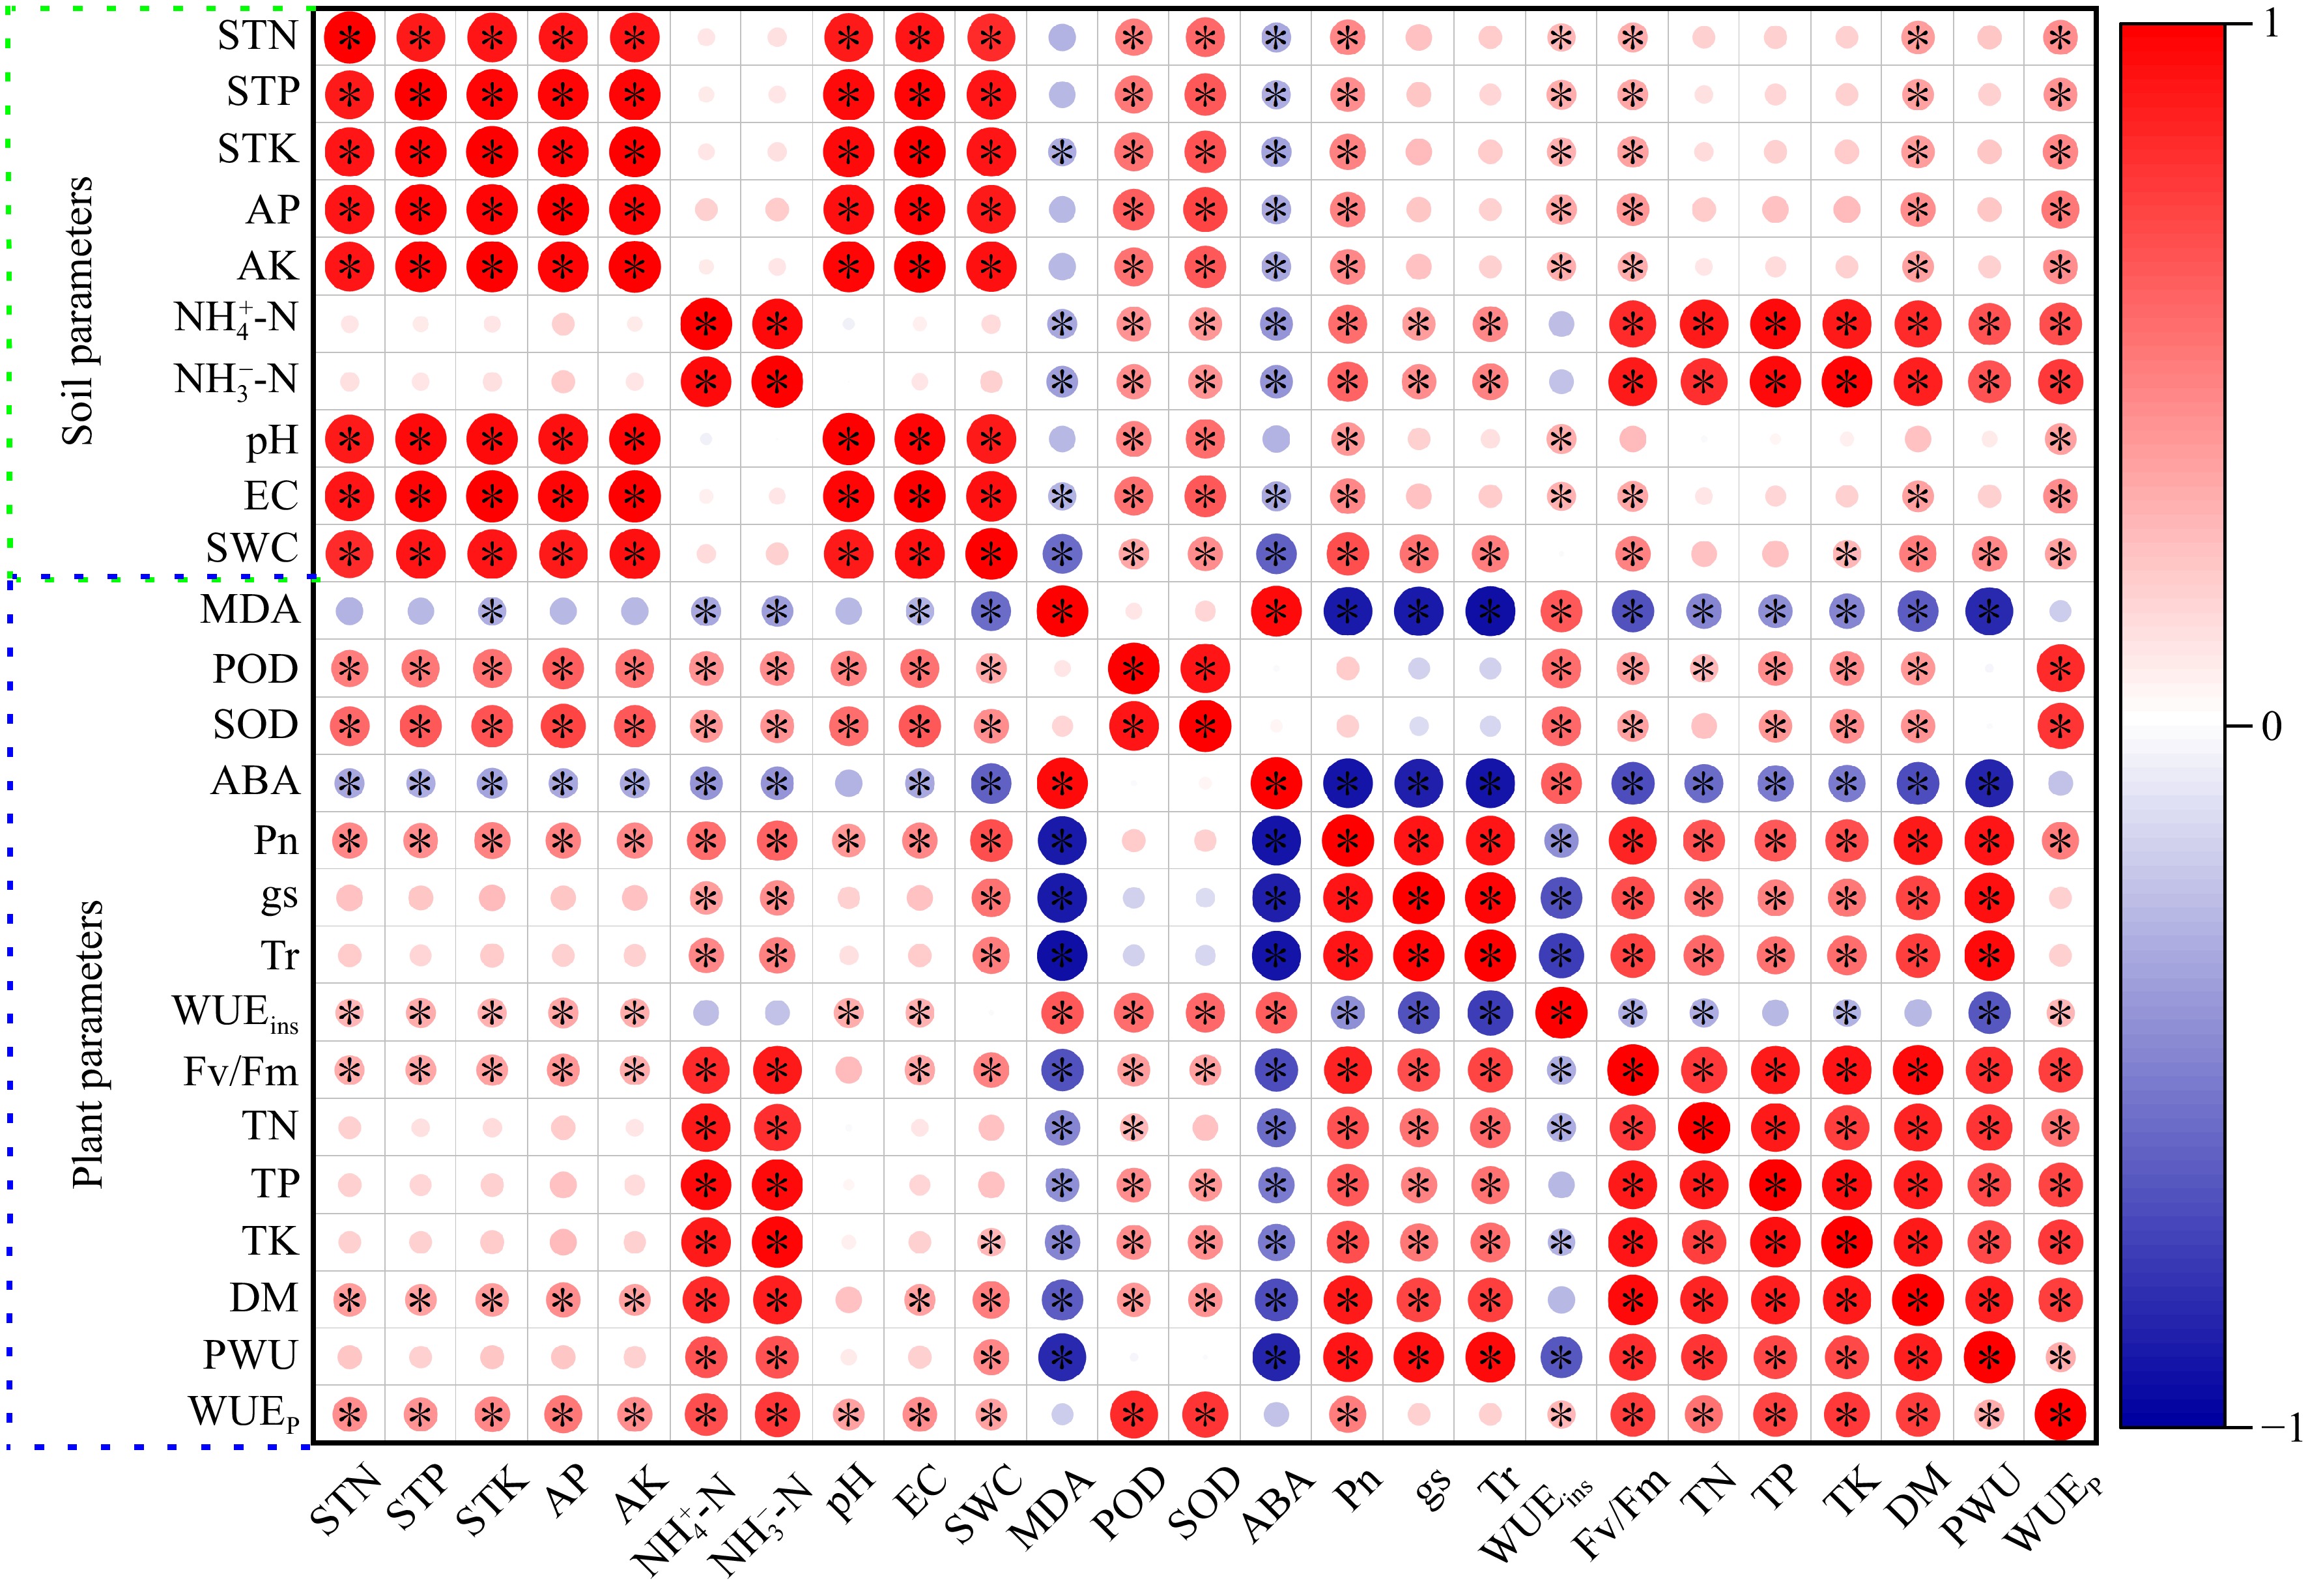
Figure 7.
Heatmap of Pearson's correlation coefficients between soil and plant system under well-watered (W) or deficit irrigation (D) with nitrogen fertilizer (N0, N1, and N2) supply and with biochar (B0 and B1). * stands for significant at the level of p < 0.05. Increases and decreases in abundance are indicated by bars of color, in red and blue, respectively. Photosynthetic rate (Pn), transpiration rate (Tr), stomatal conductance (gs), photochemical efficiency (Fv/Fm), plan water use (PWU), plant water use efficiency (WUEp), instantaneous water use efficiency (WUEins), total dry biomass (DW), total N (TN), total P (TP), total K (TK), peroxidase (POD) activity, Superoxide dismutase (SOD) activity, malondialdehid (MDA) content and abscisic acid (ABA) content, total N (STN), total P (STP), total K (STK), soil water content (SWC), electrical conductivity (EC),
${\text{NH}^+_4} $ ${\text{NO}^-_3} $ -
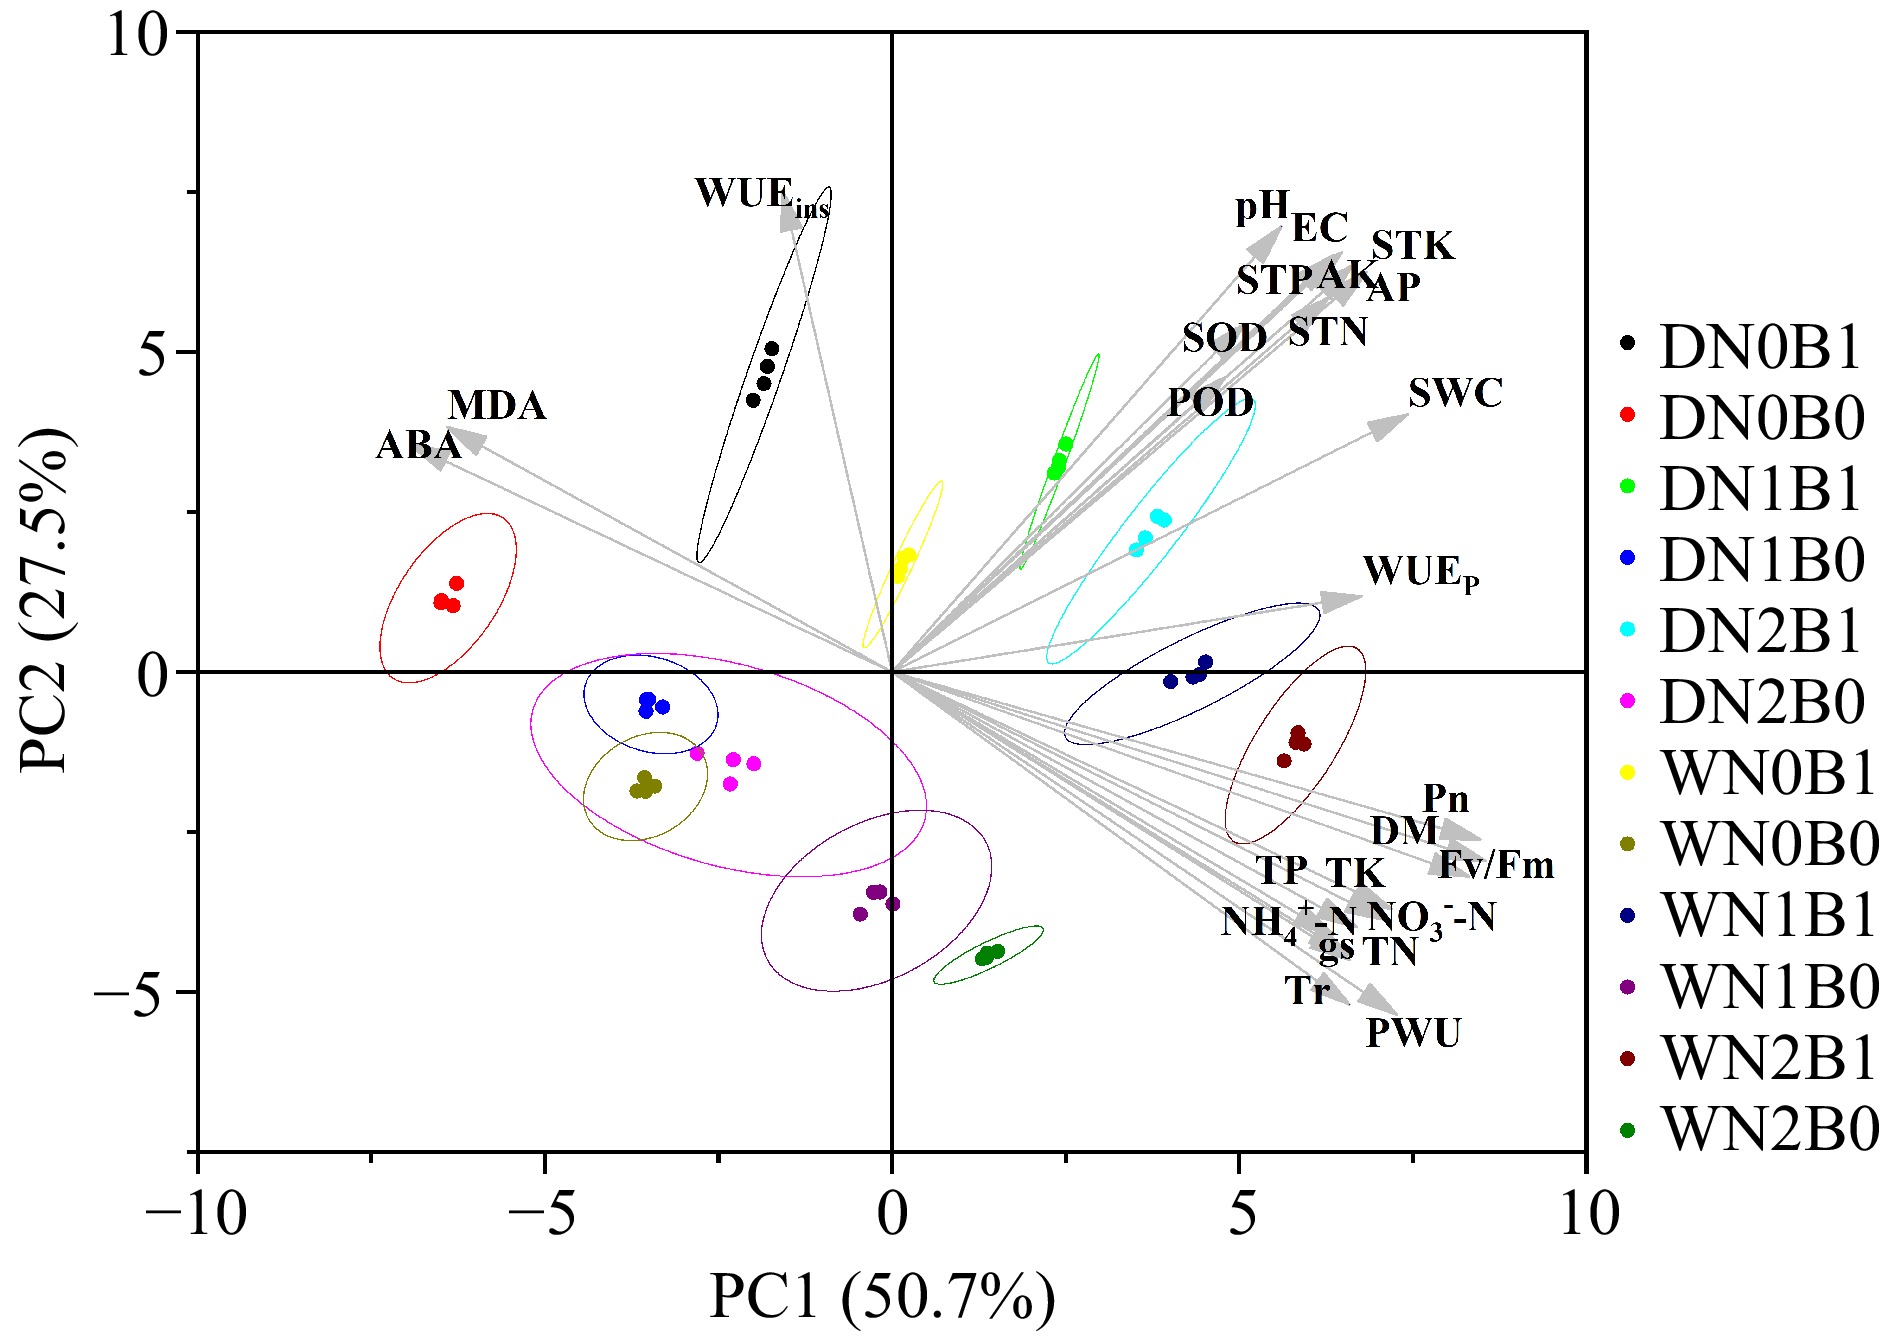
Figure 8.
Principal component analysis (PCA) of plant and soil parameters under well-watered (W) or deficit irrigation (D) with nitrogen fertilizer (N0, N1, and N2) supply and with biochar (B0 and B1). Photosynthetic rate (Pn), transpiration rate (Tr), stomatal conductance (gs), photochemical efficiency (Fv/Fm), plan water use (PWU), plant water use efficiency (WUEp), instantaneous water use efficiency (WUEins), total dry biomass (DW), total N (TN), total P (TP), total K (TK), peroxidase (POD) activity, Superoxide dismutase (SOD) activity, malondialdehid (MDA) content and abscisic acid (ABA) content, total N (STN), total P (STP), total K (STK), soil water content (SWC), electrical conductivity (EC),
${\text{NH}^+_4} $ ${\text{NO}^-_3} $ -
Material pH EC
(μS·cm−1)Total N
(g·kg−1)Total P
(g·kg−1)Total K
(g·kg−1)Available N
(mg·kg−1)Available P
(mg·kg−1)Available K
(mg·kg−1)Soil 6.61 152.63 1.19 0.81 3.25 30.58 18.21 50.85 Biochar 8.32 − − − − 85.36 316.59 653.86 Note: '−' represents no data; EC, electrical conductivity. Table 1.
Physicochemical parameters of experiment materials.
-
Treatments Total N
(g·kg−1)Total P
(g·kg−1)Total K
(g·kg−1)Available K
(mg·kg−1)Available P
(mg·kg−1)${\text{NH}^+_4} $
(mg·kg−1)${\text{NO}^-_3} $
(mg·kg−1)WN0B0 1.21 ± 0.06c 0.80 ± 0.03b 3.23 ± 0.06b 17.99 ± 0.30f 51.67 ± 2.76b 3.52 ± 0.11ef 15.57 ± 0.71h WN1B0 1.26 ± 0.04bc 0.82 ± 0.04b 3.20 ± 0.04b 18.61 ± 0.99ef 52.22 ± 3.18b 6.90 ± 0.52c 44.17 ± 0.91e WN2B0 1.41 ± 0.05bc 0.82 ± 0.02b 3.26 ± 0.05b 18.96 ± 0.80ef 52.92 ± 4.88b 8.66 ± 1.10b 50.71 ± 1.14b WN0B1 1.78 ± 0.07a 1.16 ± 0.03a 4.21 ± 0.05a 27.27 ± 1.68d 121.99 ± 2.30a 3.68 ± 0.07e 18.51 ± 0.63g WN1B1 1.73 ± 0.19a 1.16 ± 0.06a 4.26 ± 0.17a 28.22 ± 0.75cd 124.40 ± 3.28a 6.97 ± 0.19c 47.64 ± 0.80c WN2B1 1.76 ± 0.21a 1.17 ± 0.05a 4.25 ± 0.09a 30.12 ± 0.99ab 124.56 ± 10.67a 9.21 ± 0.15a 55.98 ± 1.15a DN0B0 1.31 ± 0.04bc 0.81 ± 0.04b 3.15 ± 0.04b 18.29 ± 0.38ef 53.77 ± 2.40b 3.09 ± 0.18f 14.04 ± 1.43h DN1B0 1.23 ± 0.06c 0.82 ± 0.02b 3.22 ± 0.09b 18.90 ± 0.10ef 52.91 ± 2.59b 6.16 ± 0.05d 40.49 ± 1.77f DN2B0 1.27 ± 0.10bc 0.85 ± 0.06b 3.24 ± 0.06b 19.44 ± 0.46e 54.54 ± 2.86b 8.26 ± 0.07b 44.69 ± 1.48de DN0B1 1.76 ± 0.11a 1.18 ± 0.05a 4.25 ± 0.10a 28.86 ± 0.55bc 124.92 ± 5.95a 3.46 ± 0.11ef 14.85 ± 1.36h DN1B1 1.78 ± 0.12a 1.17 ± 0.04a 4.31 ± 0.14a 29.32 ± 1.09bc 126.06 ± 4.51a 6.50 ± 0.05cd 44.63 ± 1.10de DN2B1 1.80 ± 0.13a 1.17 ± 0.05a 4.32 ± 0.12a 31.16 ± 0.90a 125.79 ± 4.32a 8.50 ± 0.20b 46.36 ± 0.81cd ANOVA I ns ns ns *** ns *** *** N ns ns ns *** ns *** *** B *** *** *** *** *** ** *** I * N ns ns ns ns ns ns *** I * B ns ns ns ns ns ns * N * B ns ns ns * ns ns ns I * N * B ns ns ns ns ns ns * Each value is the average (± SE) of four biological replicates. Different letters in the table represent significant differences between treatments at the level of p < 0.05. *, **, and *** indicate significant levels at p < 0.05, p < 0.01, and p < 0.001, respectively; ns denotes no significance. The treatments are biochar (B0 and B1), nitrogen fertilizer (N0, N1, and N2) and irrigation (W and D). Table 2.
Analysis of variance table and means of biochar (B), irrigation (I), and N fertilizer (N) treatments on soil physicochemical parameters. The meaning of treatments are different biochar (B0 and B1), nitrogen fertilization (N1 and N2) and irrigation (W and D).
-
Factors Pn Tr gs Fv/Fm PWU WUEp WUEins DW TN TP TK POD SOD MDA ABA I *** *** *** ns *** *** *** *** *** *** ns *** *** *** *** N *** *** *** *** *** *** *** *** *** *** ns *** *** *** *** B *** *** *** *** *** *** *** *** ** *** *** *** *** *** *** I * N *** *** *** *** *** *** *** *** *** ns ns *** ns *** *** I * B *** ns ** ns ns *** *** *** *** ns ns *** * *** *** N * B *** *** *** *** ns *** ns *** ns ns ns *** *** ** *** I * N * B *** ns *** ns ns *** * *** ns ns ns *** *** *** *** Photosynthetic rate (Pn), transpiration rate (Tr), stomatal conductance (gs), photochemical efficiency (Fv/Fm), plan water use (PWU), plant water use efficiency (WUEp), instantaneous water use efficiency (WUEins), total dry biomass (DW), total N (TN), total P (TP), total K (TK), peroxidase (POD) activity, Superoxide dismutase (SOD) activity, malondialdehid (MDA) content, and abscisic acid (ABA) content. The outputs of the three-way ANOVA are shown where *, **, and *** indicate significant levels at p < 0.05, p < 0.01 and p < 0.001, respectively; ns denotes no significance. The treatments are biochar (B0 and B1), nitrogen fertilizer (N0, N1, and N2) and irrigation (W and D). Table 3.
Analysis of variance table and means of biochar (B), irrigation (I), and N fertilizer (N) treatments on plant physiological parameters. The meaning of treatments are different biochar (B0 and B1), nitrogen fertilization (N1 and N2) and irrigation (W and D).
Figures
(8)
Tables
(3)