-

Figure 1.
Location of experimental sites and layout of treatment plots at each site and photos of canopy nitrogen and water increase.
-
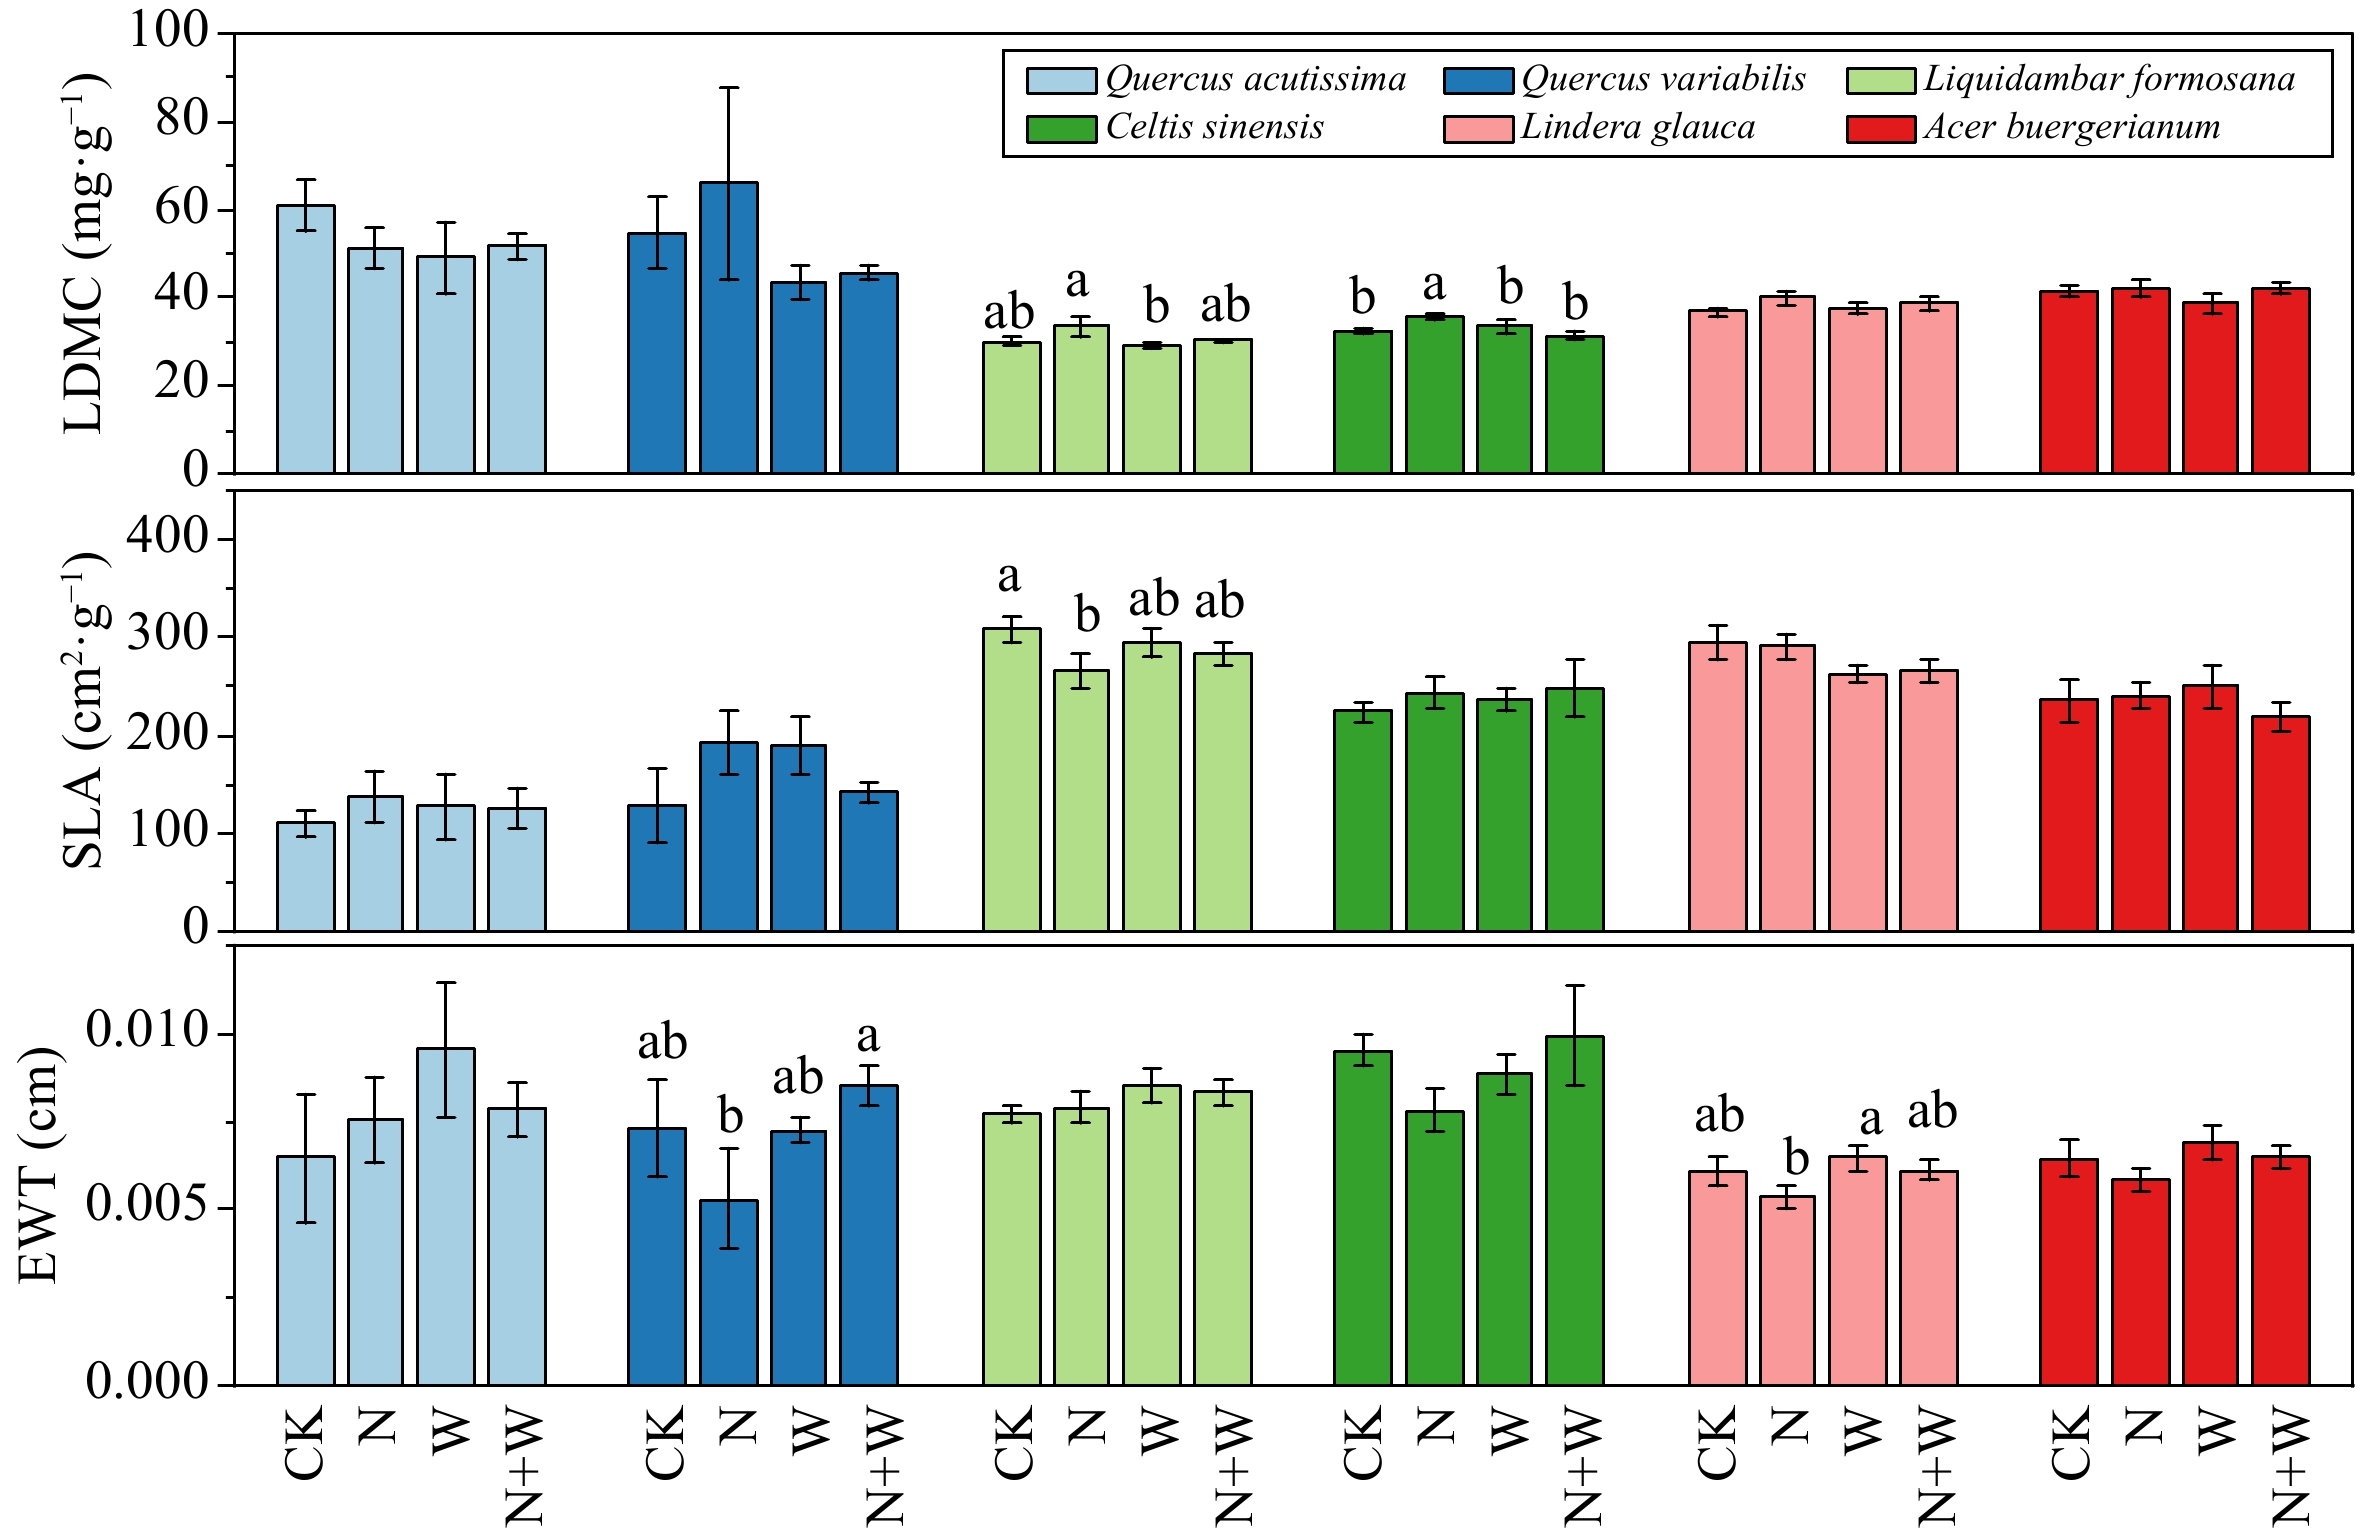
Figure 2.
Effect of nitrogen (N) and water addition on leaf functional traits. Treatments included a control (CK), canopy addition N at 25 kg·ha−1·yr−1 (N), canopy water addition at 30% of the local precipitation (W), canopy N addition at 25 kg·ha−1·yr−1 and water addition at 30% of the local precipitation (N + W). Different lowercase letters above the error bar (standard error) indicate differences of statistical significance.
-
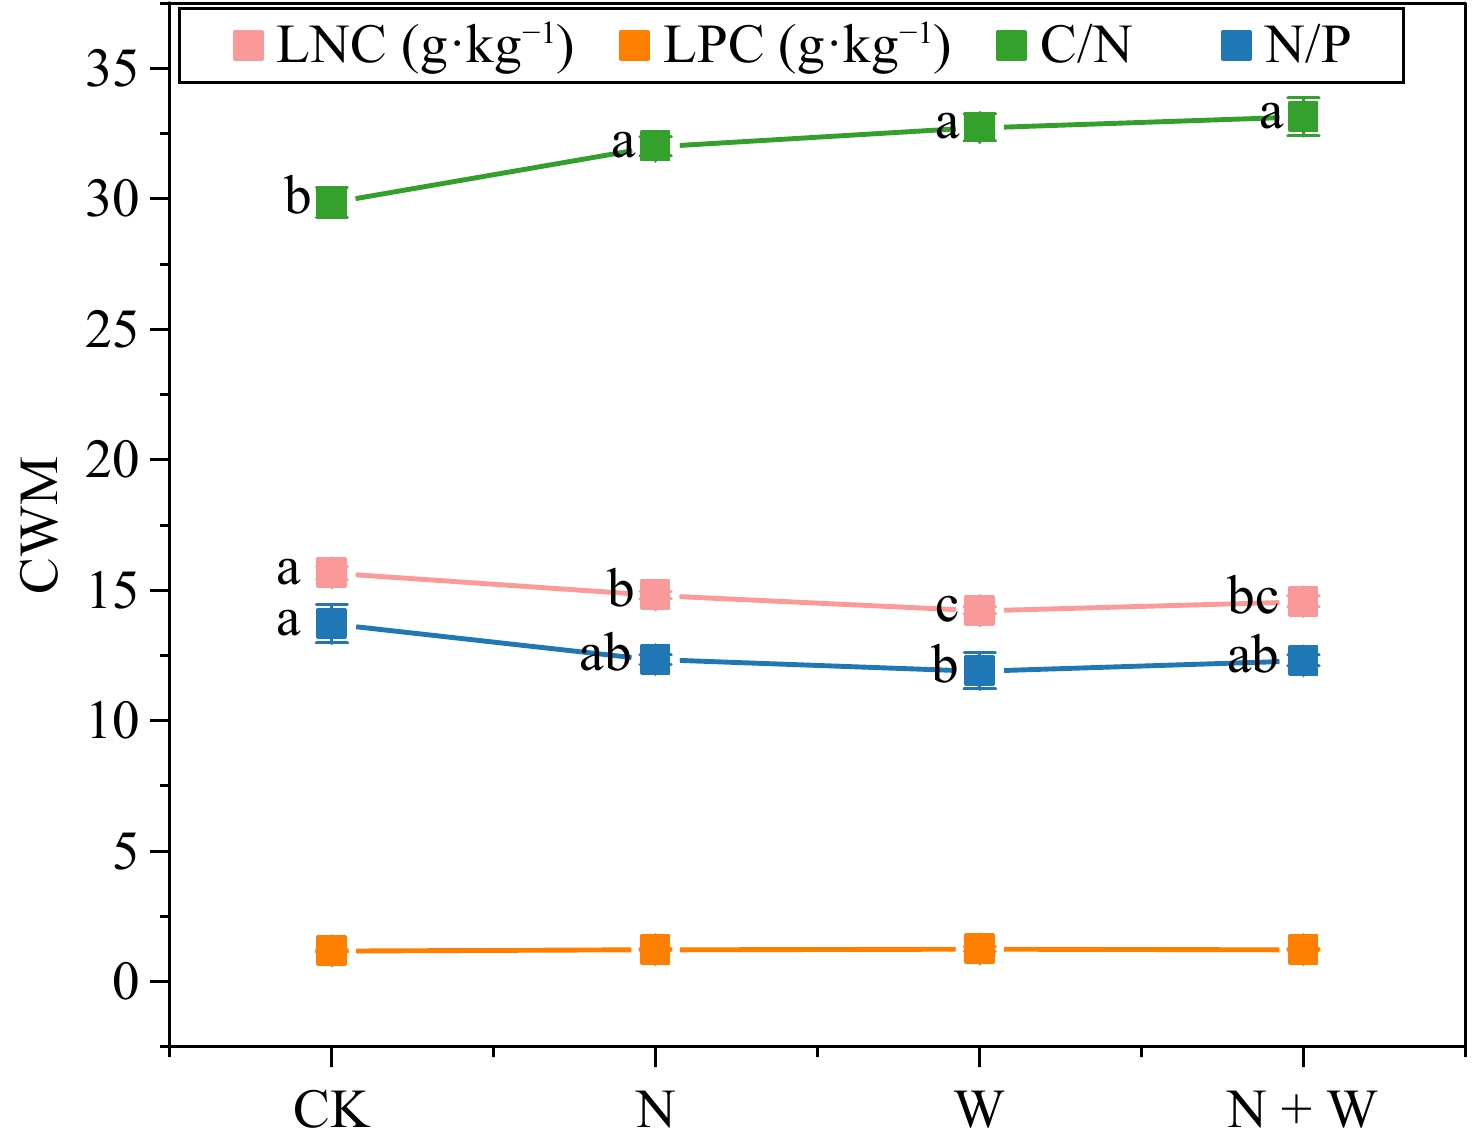
Figure 3.
Effect of nitrogen (N) and water addition on leaf chemical properties. Treatments included a control (CK), canopy addition N at 25 kg·ha−1·yr−1 (N), canopy water addition at 30% of the local precipitation (W), canopy N addition at 25 kg·ha−1·yr−1 and water addition at 30% of the local precipitation (N + W). Different lowercase letters above the error bar (standard error) indicate differences of statistical significance.
-
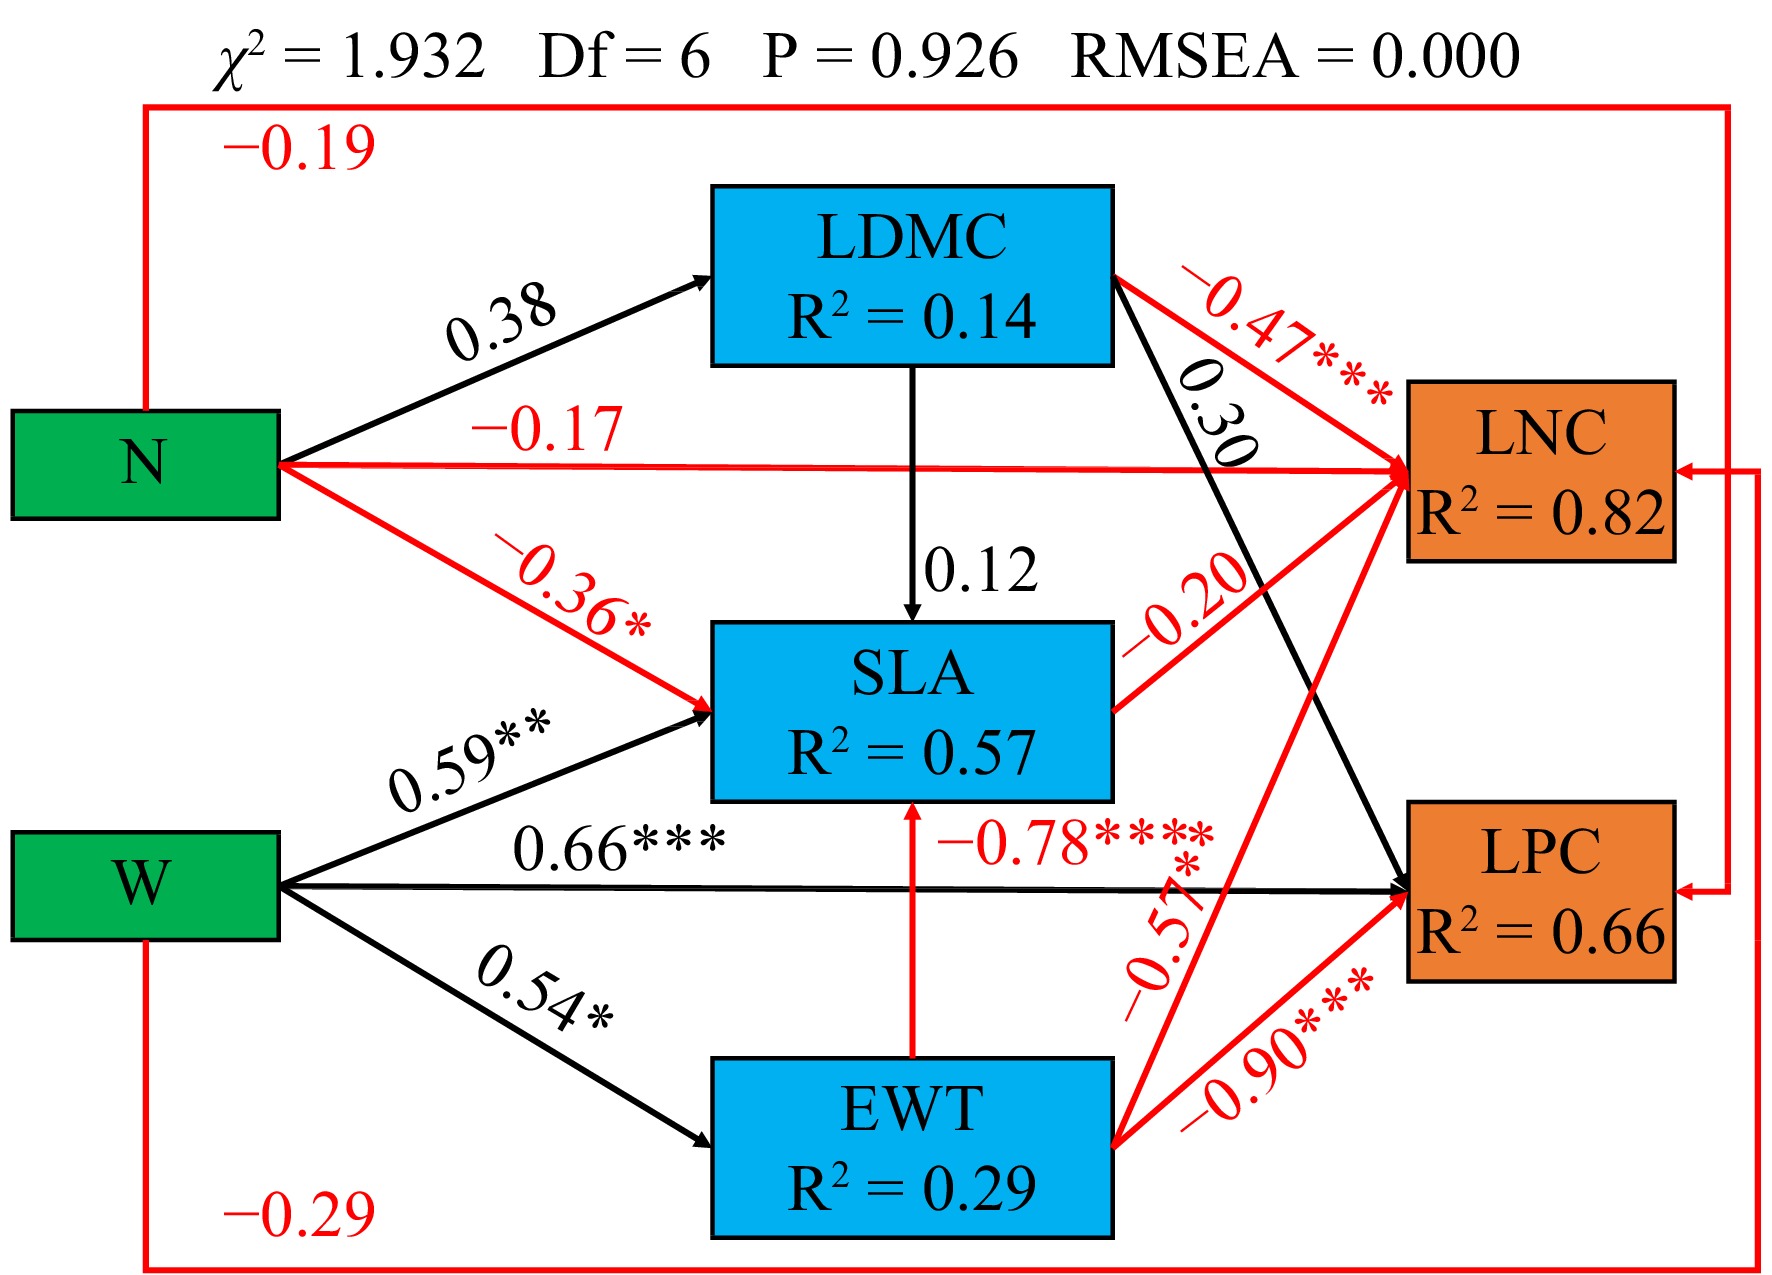
Figure 4.
Results of the structural equation model. The arrows represent the hypothesized causal relationships between the variables: N, canopy nitrogen addition at 25 kg·ha−1·yr−1; W, canopy water addition at 30% of the local precipitation; *, p < 0.05; **, p < 0.01; ***, p < 0.001. Black arrows represent positive effects, and the red arrows represent negative effects. The values next to the arrows are the standardized path coefficients. The values of R2 represent the percentage of the response variations explained by the observed variables.
-
Life form Species names Family Genera Abundance Tree Liquidambar formosana Hance Hamamelidaceae Liquidambar 84 Quercus acutissima Carruth Fagaceae Chestnut 464 Quercus variabilis Bl Fagaceae Chestnut 100 Shrubs Celtis sinensis Pers Ulmaceae Celtis 212 Lindera glauca (Sieb. et Zucc.) Bl Lauraceae Lindera 212 Acer buergerianum Miq Aceraceae Acer 441 Table 1.
Sampled dominant tree species in canopy and shrub layers in the warm temperate zone.
-
N W N + W F P F P F P LDMC Quercus acutissima 0.392 0.542 1.043 0.326 1.234 0.287 Quercus variabilis 0.32 0.582 1.824 0.202 0.145 0.71 Liquidambar formosana 2.855 0.098 2.493 0.121 0.865 0.357 Celtis sinensis 0.31 0.581 2.371 0.131 6.187 0.017 Lindera glauca 2.133 0.151 0.021 0.886 0.548 0.463 Acer buergerianum 1.484 0.23 0.614 0.438 0.52 0.475 SLA Quercus acutissima 0.258 0.62 0.018 0.895 0.337 0.571 Quercus variabilis 0.086 0.774 0.022 0.884 3.638 0.081 Liquidambar formosana 3.575 0.065 0.016 0.901 1.134 0.293 Celtis sinensis 0.904 0.347 0.266 0.609 0.041 0.841 Lindera glauca 0.003 0.96 4.715 0.035 0.064 0.801 Acer buergerianum 0.485 0.49 0.025 0.875 0.882 0.353 EWT Quercus acutissima 0.046 0.833 1.387 0.26 0.919 0.355 Quercus variabilis 0.116 0.74 2.291 0.156 2.48 0.141 Liquidambar formosana 0 0.997 2.583 0.115 0.228 0.635 Celtis sinensis 0.177 0.676 0.866 0.358 3.415 0.072 Lindera glauca 2.788 0.102 2.995 0.091 0.398 0.531 Acer buergerianum 1.36 0.25 1.541 0.221 0.029 0.865 LDMC, leaf dry matter content; SLA, specific leaf area; EWT, equivalent water thickness; bold characters indicate significant differences. Table 2.
The effects of nitrogen (N), water (W) and the interaction (N + W) of the two on the functional traits of the leaves.
-
N W N + W F P F P F P LNC 1.854 0.198 19.842 0.001 10.116 0.008 LPC 0.027 0.872 0.475 0.504 0.435 0.522 C/N 0.856 0.373 3.03 0.107 2.779 0.121 N/P 5.218 0.041 12.613 0.004 2.401 0.147 LNC, leaf nitrogen content; LPC, Leaf phosphorus content; bold characters indicate significant differences. Table 3.
The effects of nitrogen (N), water (W) and the interaction (N + W) of the two on leaf chemical properties.
-
Treatment Moisture (%) NH4-N (mg·kg–1) NO3-N (mg·kg–1) CK 29.01 ± 1.21 b 4.41 ± 0.21 b 17.97 ± 2.92 b N 28.23 ± 1.04 b 5.11 ± 0.62 ab 21.37 ± 1.64 ab W 36.98 ± 3.13 a 4.4 ± 0.08 b 15.73 ± 2.92 b N+W 33.65 ± 2.09 ab 7.61 ± 0.16 a 30.28 ± 3.71 a CK, control; N, canopy N addition at 25 kg·ha−1·yr−1; W, canopy water addition at 30% of the local precipitation; N + W, canopy N addition at 25 kg·ha−1·yr−1 and water addition at 30% of the local precipitation. Table 4.
Soil moisture content and available N (NH4-N, and NO3-N) content.
Figures
(4)
Tables
(4)