-
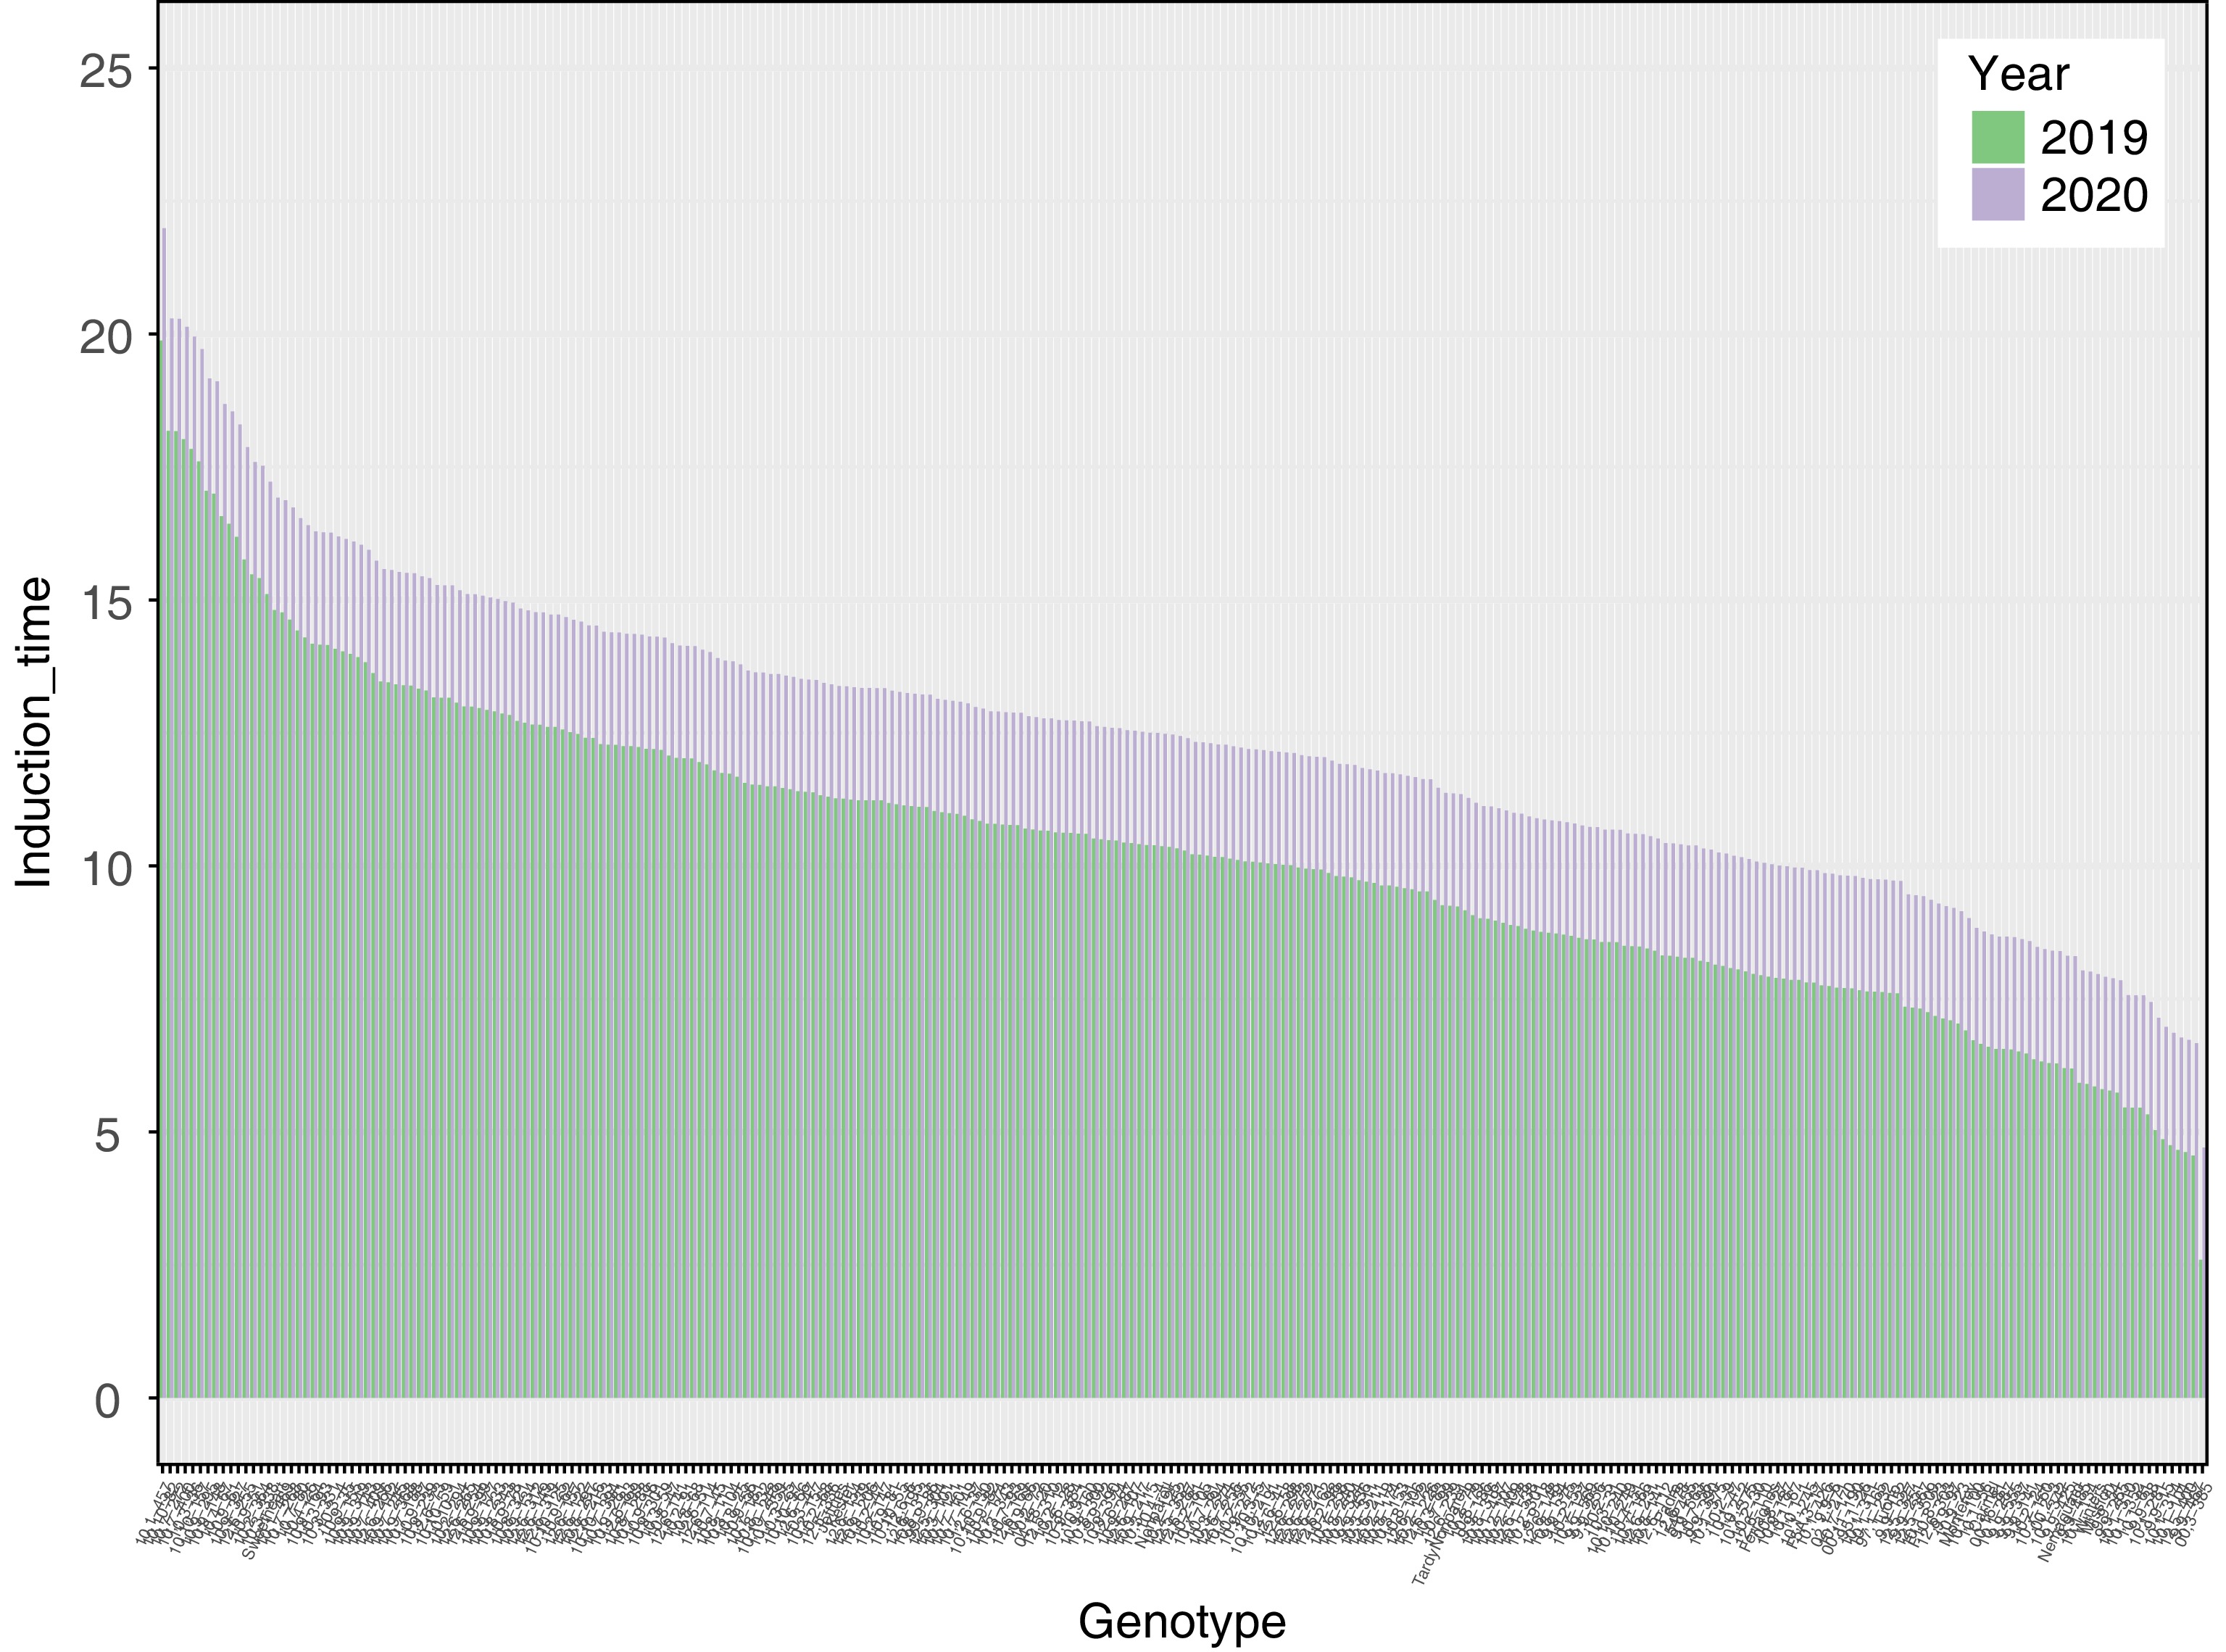
Figure 1.
Induction time (stability index) for two years of harvest. Induction time was calculated with a rancimat machine for 2019 and 2020 on roasted almond kernels.
-
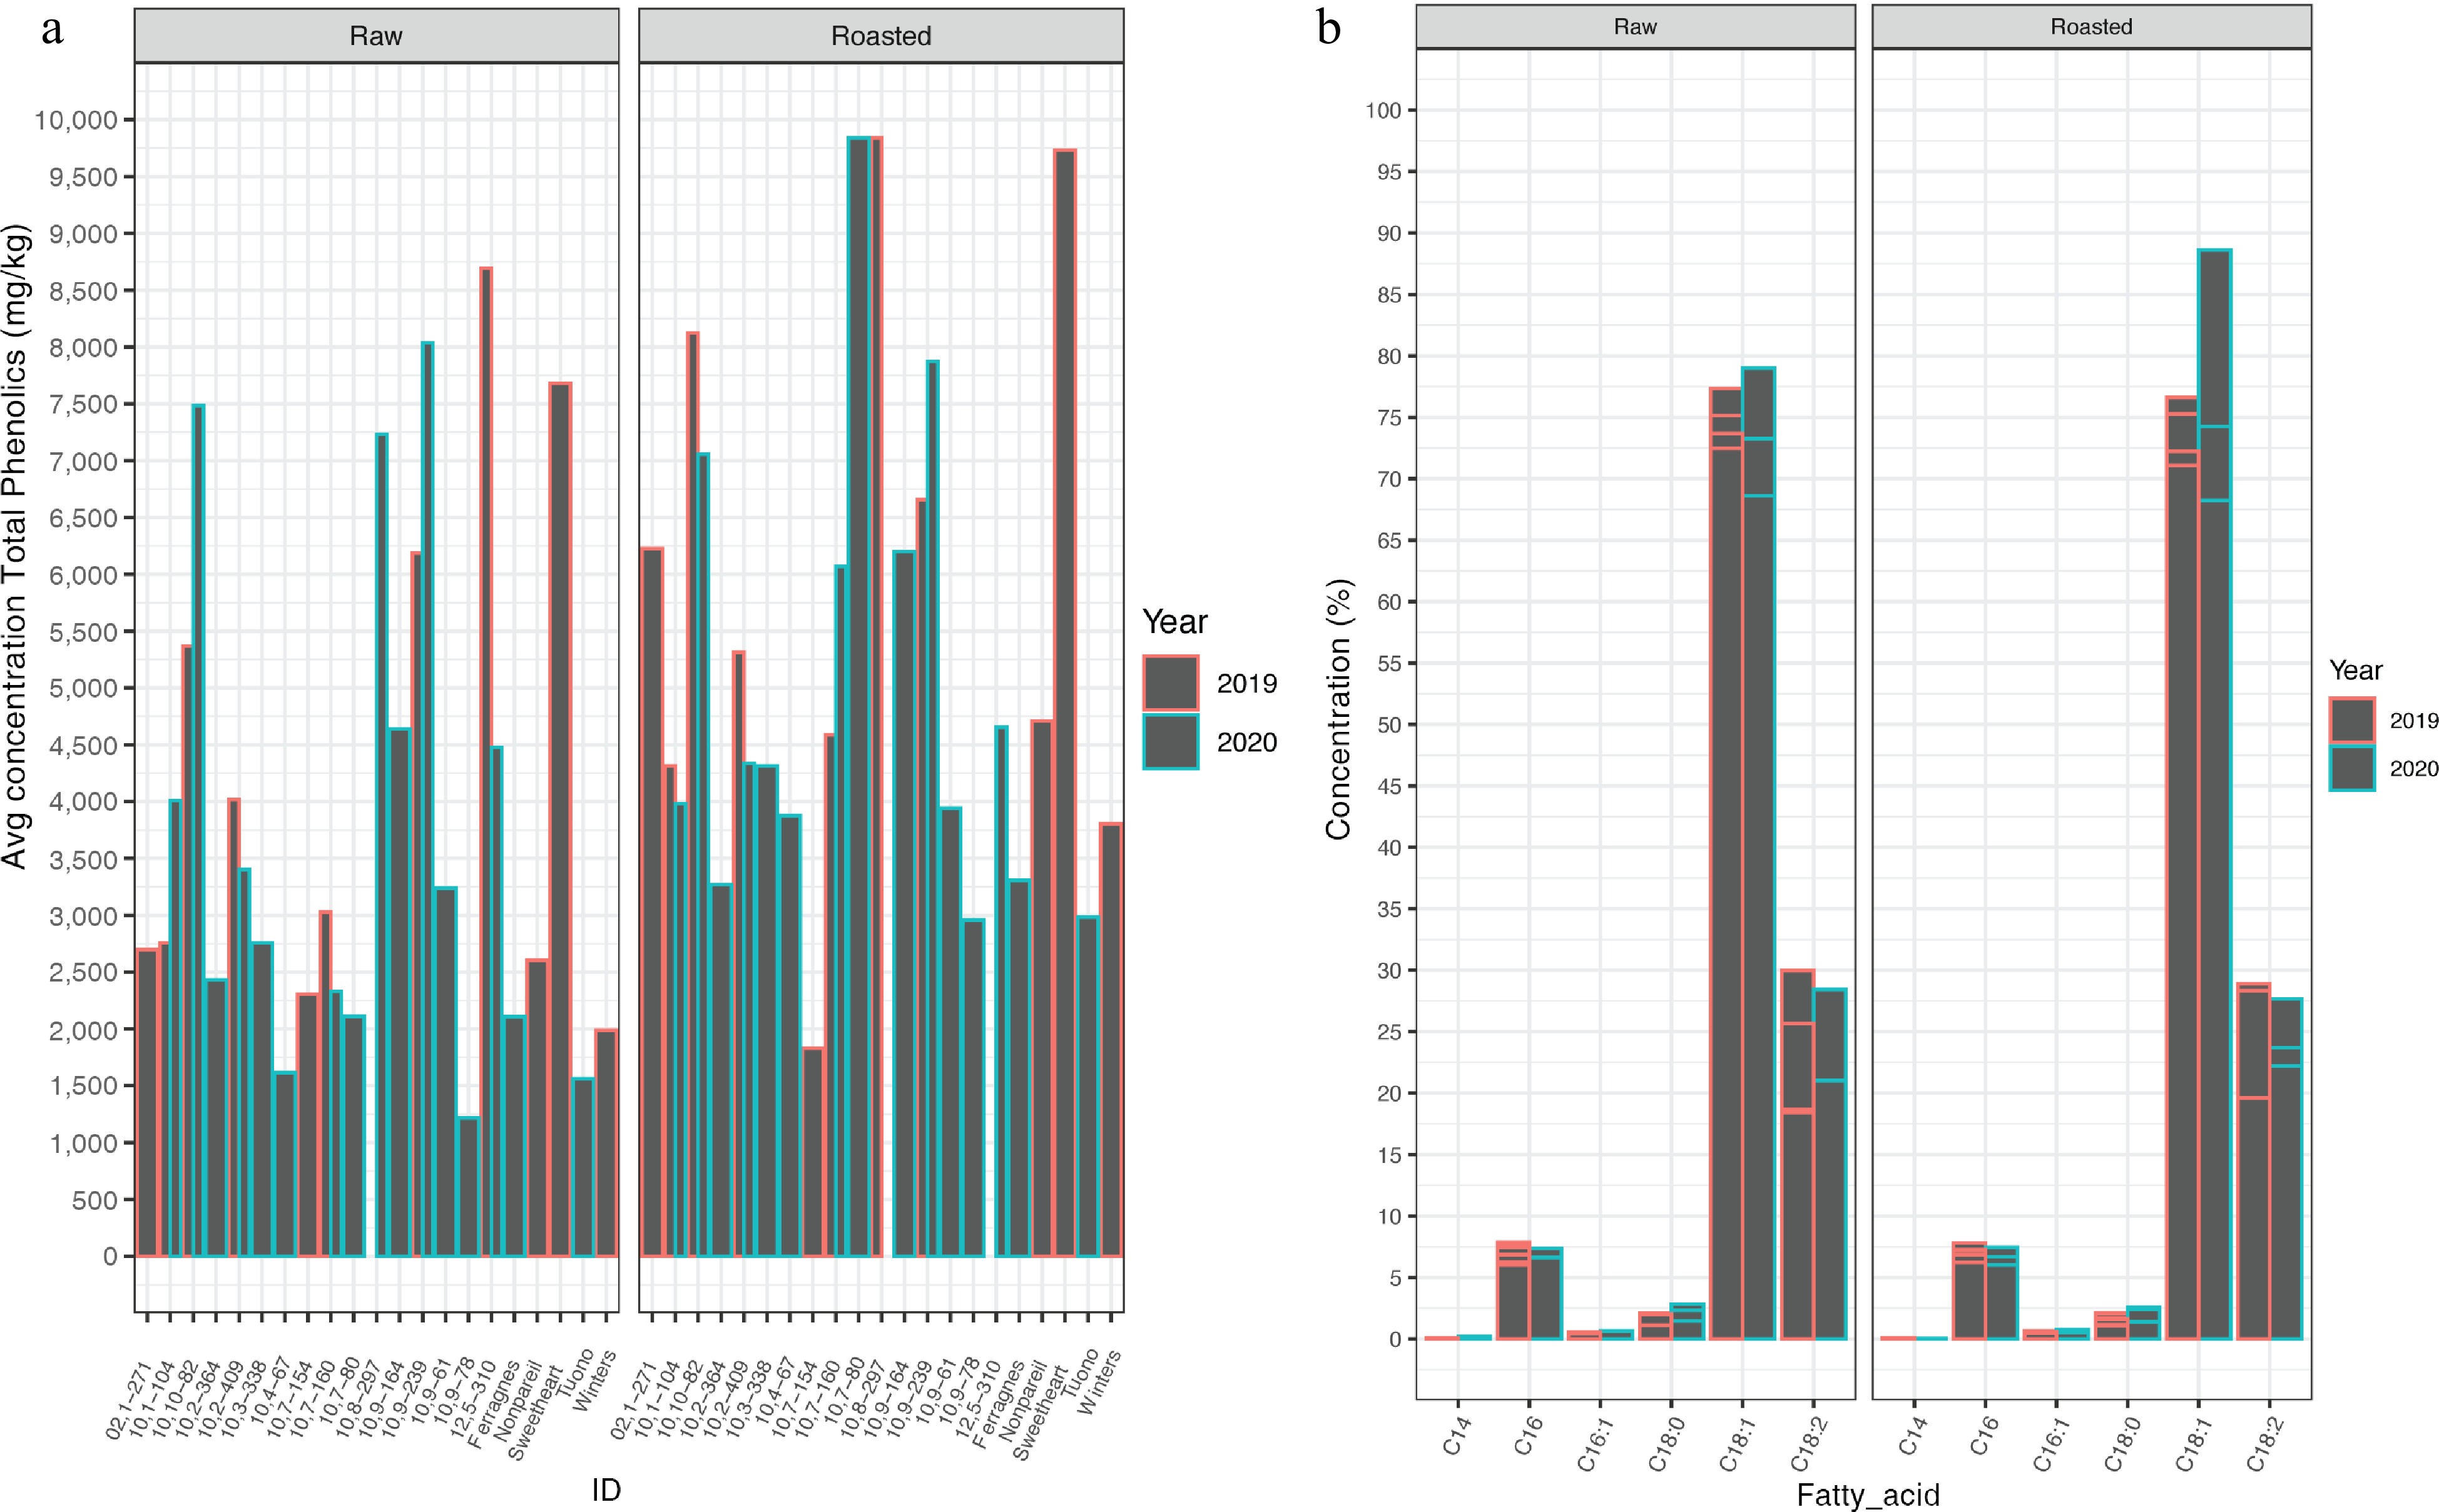
Figure 2.
Phenolics and fatty-acid profiles. (a) Mean phenolics (mg/kg) found in each 21 cultivar/selection for raw and roasted kernels in 2019 and 2020. (b) Percent concentration of total fatty acids found in 21 cultivar/selections for raw and roasted kernels in 2019 and 2020. C14:0 myristic acid, C16 palmitic acid, C16:1 palmitoleic, C18:0 stearic acid, C18:1 oleic acid, C18:2 linolenic acid. Error bars shown for each individual within a fatty acid grouping.
-
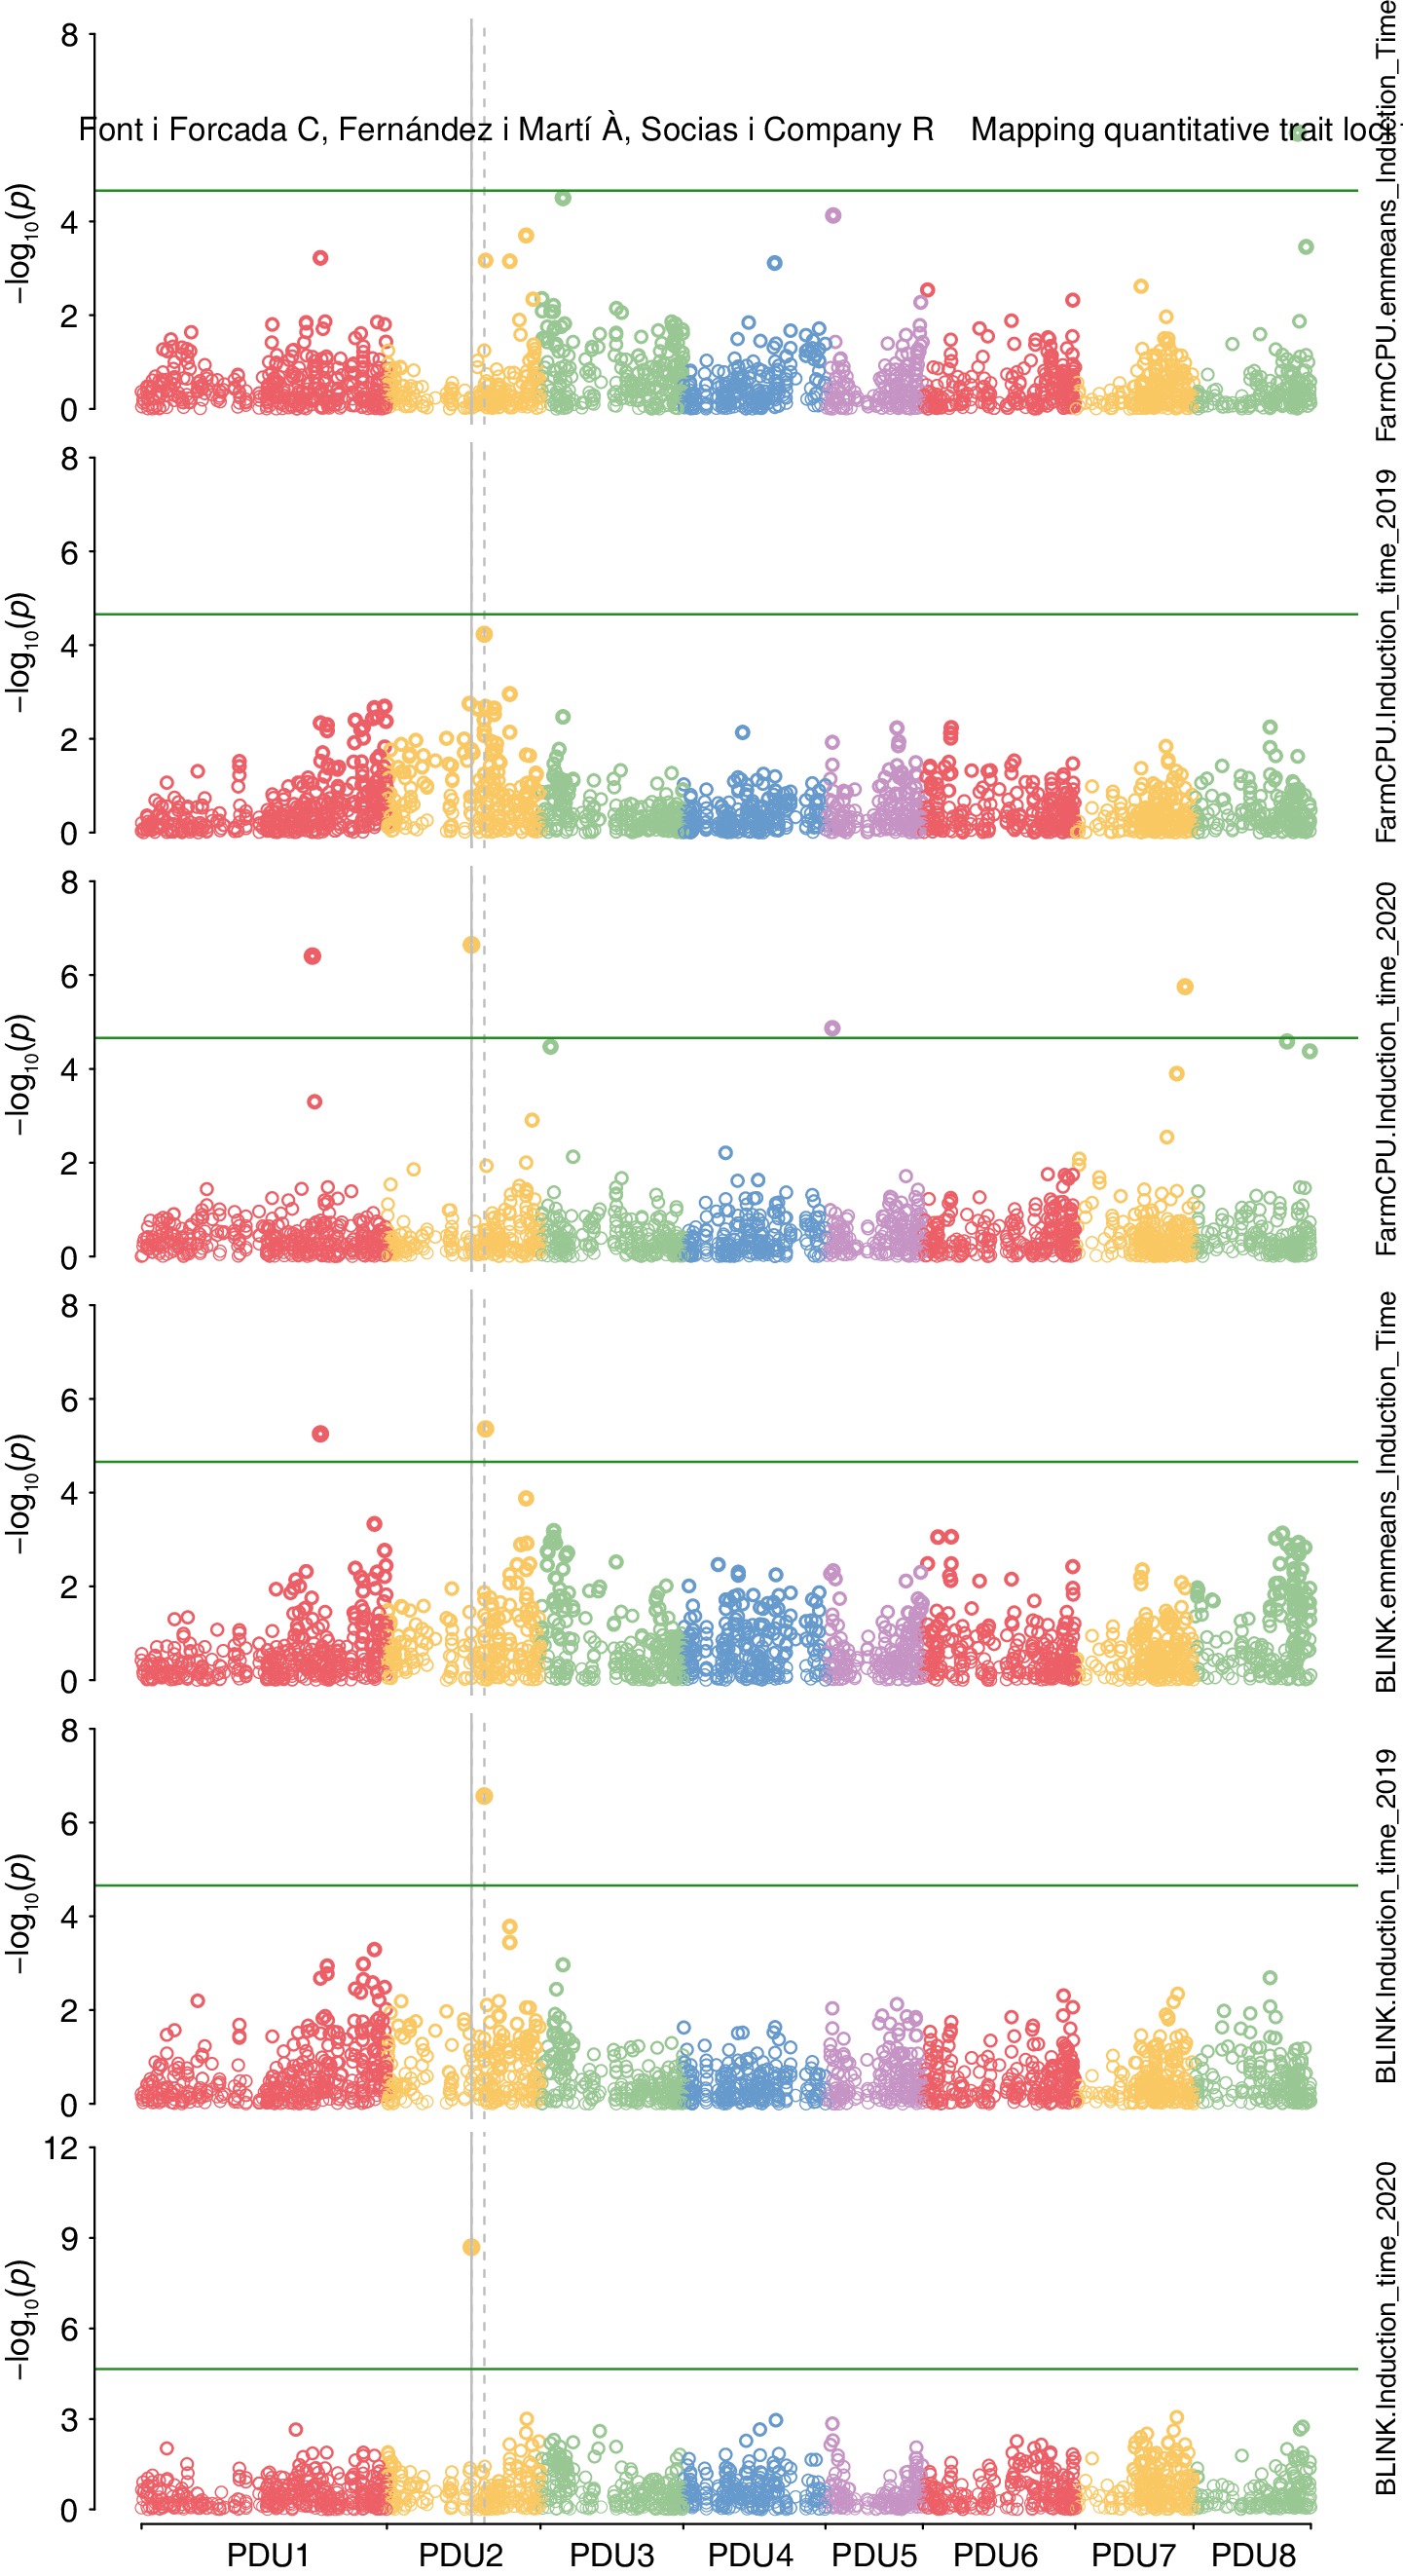
Figure 3.
Genome-wide association for induction time performed. Model Blink was used with an input of adjusted mean value of induction time for two years and single year analysis. Model FarmCPU was used with an input of adjusted mean value of induction time for two years and single year analysis.
-
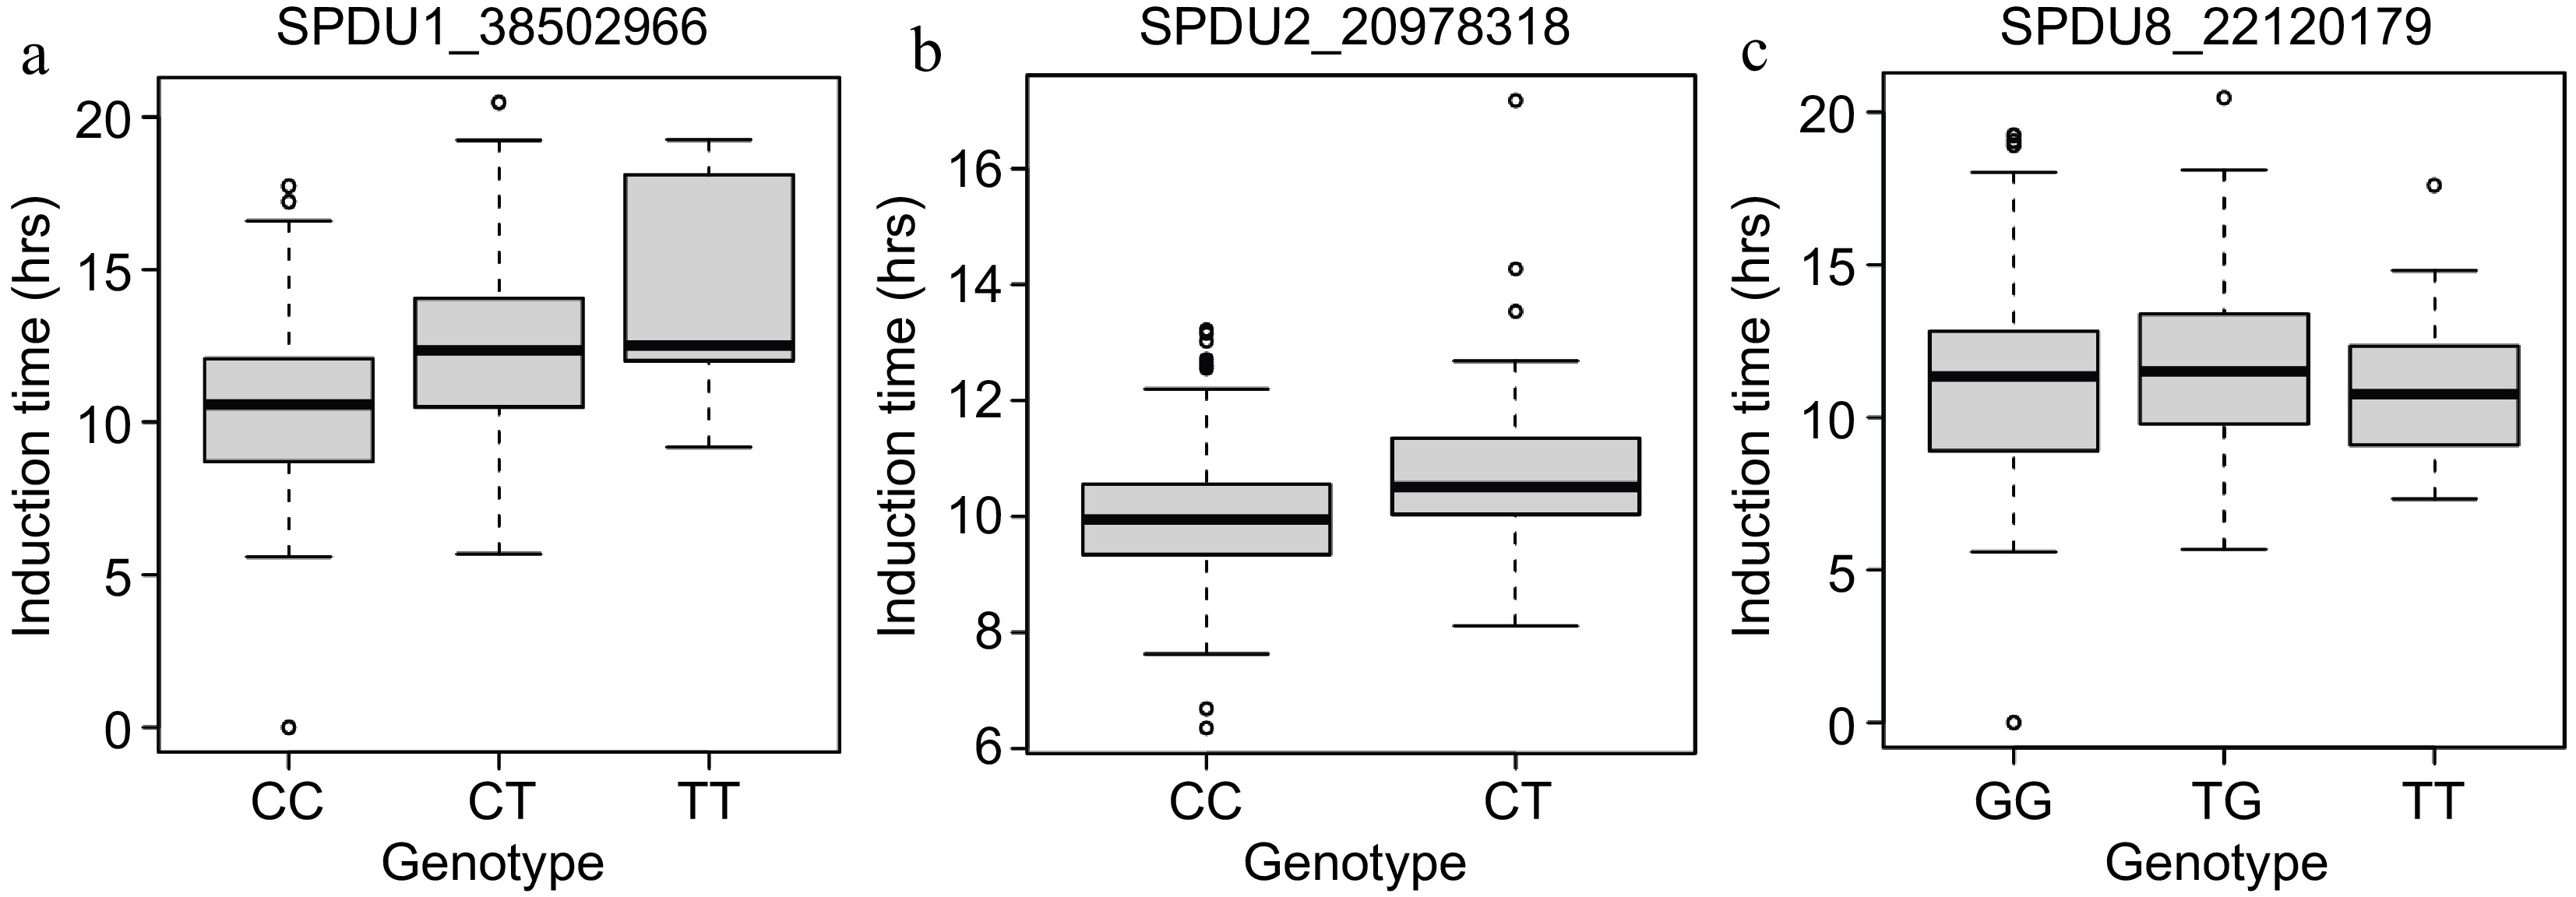
Figure 4.
Genotype plots for marker-trait associations. (a) SPDU1_38502966. (b) SPDU2_20978318. (c) SPDU8_22120179.
-
Year Physical state Statistic Phenolics (mg/kg) Fat content (%) Alpha-tocopherol (mg/kg) Induction time (h) 2019 Raw Low 2,757.26a 47.04h 210.94a High 8,692.92b 57.16i 717.35l Mean 6,080.73 51.87 430.24 SD 2,792.99 3.86 172.76 n 8 8 12 Roasted Low 3,805.05c 51.53e 166.18g 5.15a High 10,100.10b 58.72j 547.03l 14.81h Mean 7,333.63 55.61 397.38 10.39 SD 2,384.46 3.31 105.92 2.62 n 8 8 12 260 2020 Raw Low 1,217.34d 48.81a 246.77k High 8,038.48e 79.54k 418.24l Mean 3,666.11 54.9 336.84 SD 2,168.95 6.21 56.59 n 16 16 9 Roasted Low 2,984.06f 52.77f 230.13k 7.61f High 10,973.69g 68.16d 380.89l 14.88e Mean 5,352.89 59.22 284.68 12.33 SD 2,438.25 4.21 49.45 3.41 n 16 16 9 240 The letters indicate the genotype listed here at the bottom of the table. a: 10,1-104, b: 12,5-310, c: 'Winters', d: 10,9-78, e: 10,9-239, f: 'Tuono', g: 10,8-297, h: 'Sweetheart', i: 10,10-82, j: 10,7-160, k: 10,2-409, l: 'Nonpareil'. Table 1.
Summary of low and high values for chemical composition. Phenolics, fat content, α-tocopherol and induction time were measured on raw and roasted almonds for two years, 2019 and 2020. The letters indicate the genotype at the bottom of the table.
-
SNP Chromosome Position p-value maf Effect R2 Genotypes Method SPDU1_38502966 PDU1 38,502,966 5.58 × 10−06 0.225 0.842 0.052 C:C; C:T; T:T BLINK 2019/2020 SPDU1_36802517 PDU1 36,802,517 3.93 × 10−07 0.130 1.880 0.026 FarmCPU 2020 SPDU2_20978318 PDU2 20,978,318 4.37 × 10−06 0.059 2.107 0.066 C:C; C:T BLINK 2019/2020 SPDU2_17974418 PDU2 17,974,418 2.26 × 10−07 0.050 −2.665 0.063 FarmCPU2020 SPDU2_20691448 PDU2 20,691,448 2.72 × 10−07 0.260 −2.067 0.073 BLINK 2019 SPDU5_1476952 PDU5 1,476,952 1.36 × 10−05 0.127 1.490 0.041 FarmCPU 2020 SPDU7_23358253 PDU7 23,358,253 1.77 × 10−06 0.075 −3.07 0.014 FarmCPU 2020 SPDU8_24707583 PDU8 24,707,583 4.22 × 10−05 0.224 1.58 0.019 FarmCPU 2020 SPDU8_22120179 PDU8 22,120,179 1.29 × 10−06 0.304 −1.206 0.031 GG; T:G; T:T FarmCPU 2019/2020 maf = minor allele frequency, R2 = phenotypic variance explained, Effect is the allelic effect on a phenotype, Method is the year or combination (emmeans) of the years and the model used. Table 2.
Marker-trait associations for induction time with rancimat.
-
SNP ID SNP
genotypeShelf-life/lipid stability classification Low High SDU1_38502966 C:C 47 17 T:C 7 16 T:T 4 5 SDU2_20978318 C:C 49 37 T:C 7 5 SDU8_22120179 G:G 16 18 G:T 31 19 T:T 12 4 The number of genotypes shown in each classification. Low is defined as any value below 9.88 (the mean), while high is any value above 9.88. Table 3.
Classification of almond trees according to their SNP genotypes obtained with KASP markers and lipid stability classification.
Figures
(4)
Tables
(3)