-
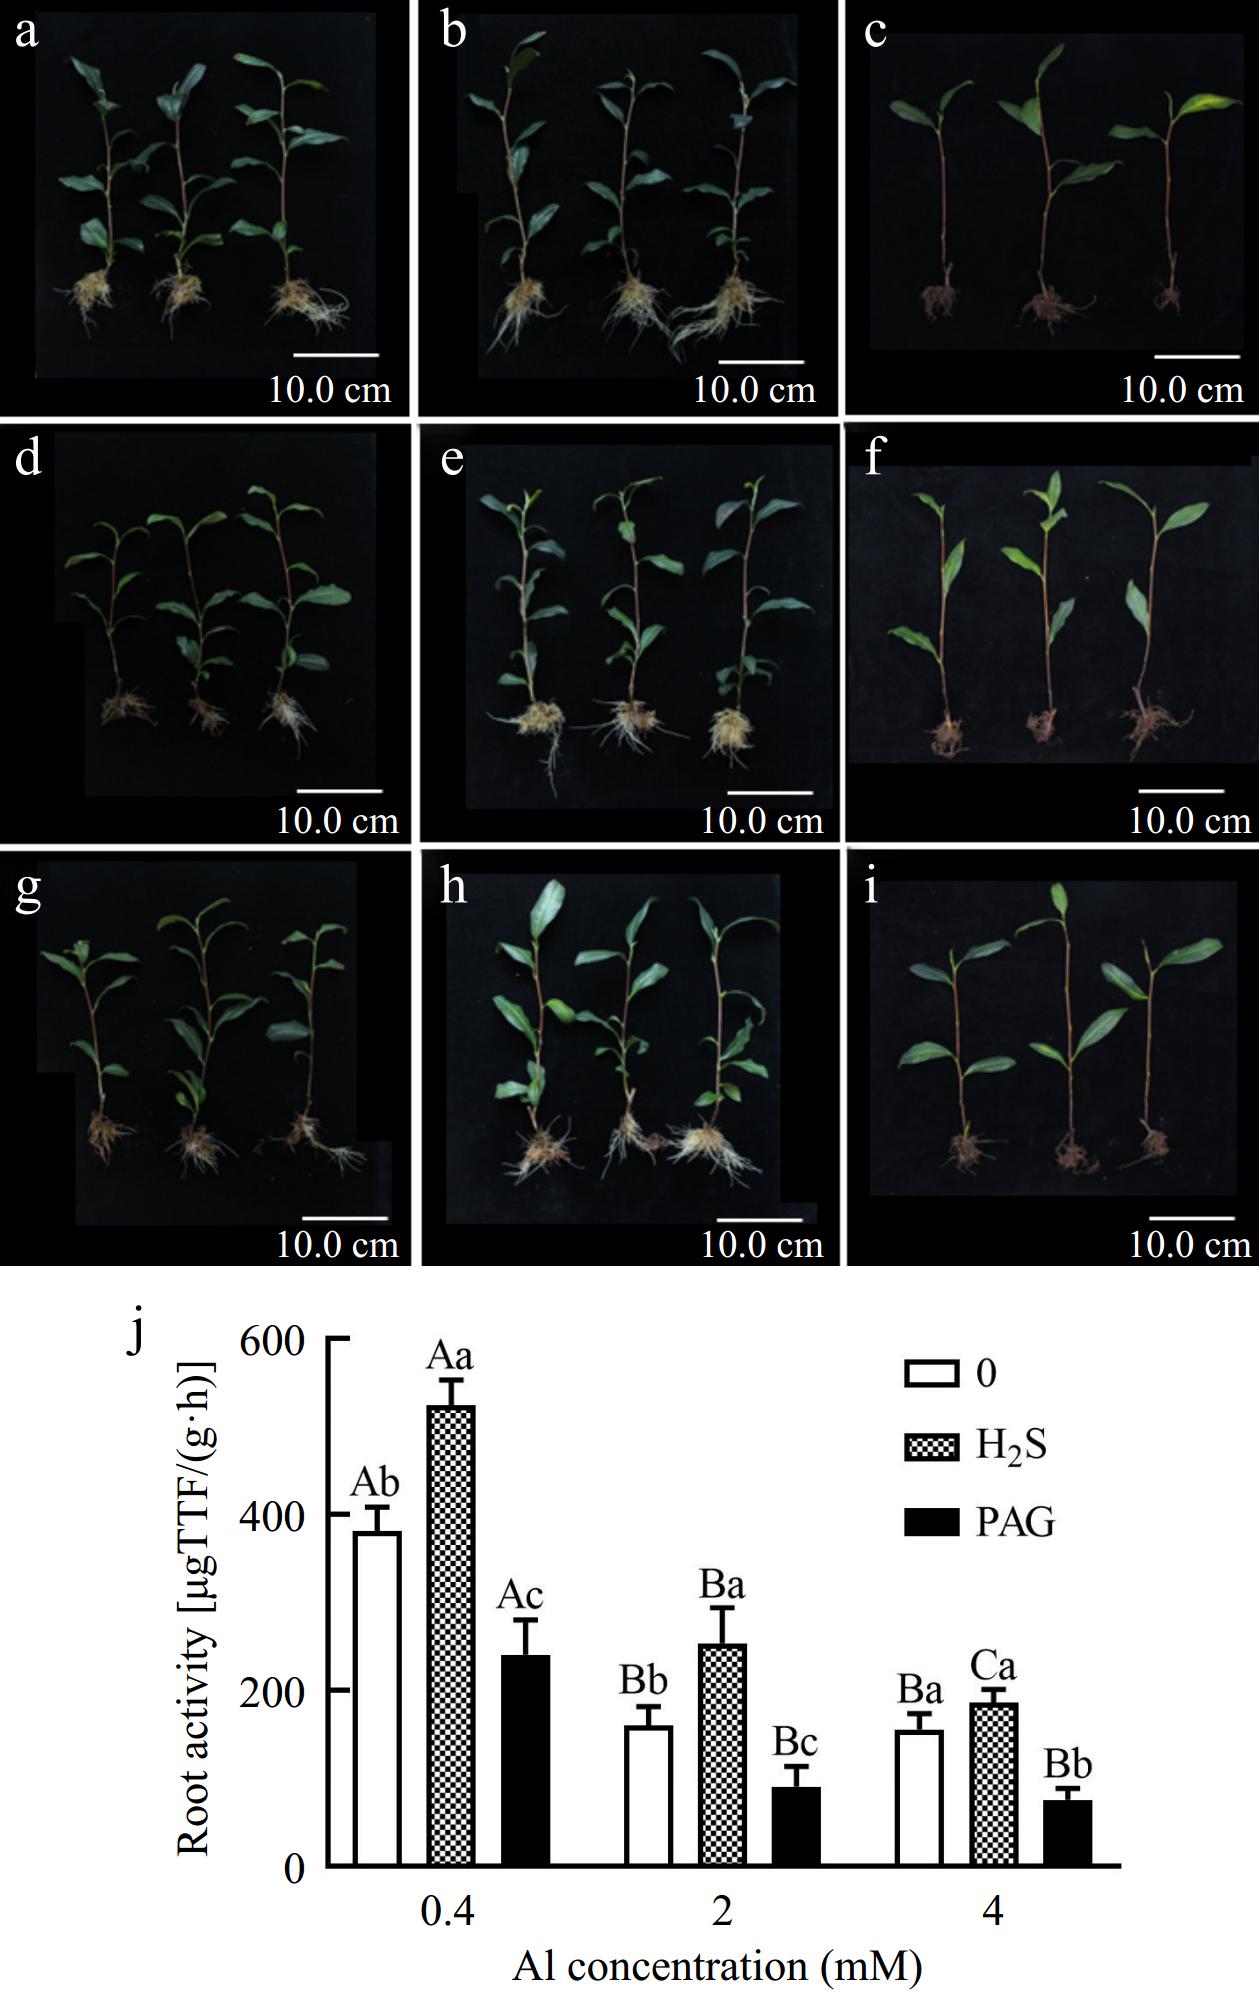
Figure 1.
Effect of different treatments on symptoms, (a) 0.4Al, (b) H2S + 0.4Al, (c) PAG + 0.4Al, (d) 2Al, (e) H2S + 2Al, (f) PAG + 2Al, (g) 4Al, (h) H2S + 4Al, (i) PAG + 4Al, and (j) root activity in C. sinensis. Different lowercase letters in (j) represent significant differences among different H2S conditions under the same Al concentration treatment, and different uppercase letters represent significant differences among different Al concentration treatments under the same H2S condition (p < 0.05), as determined by the Duncan test.
-
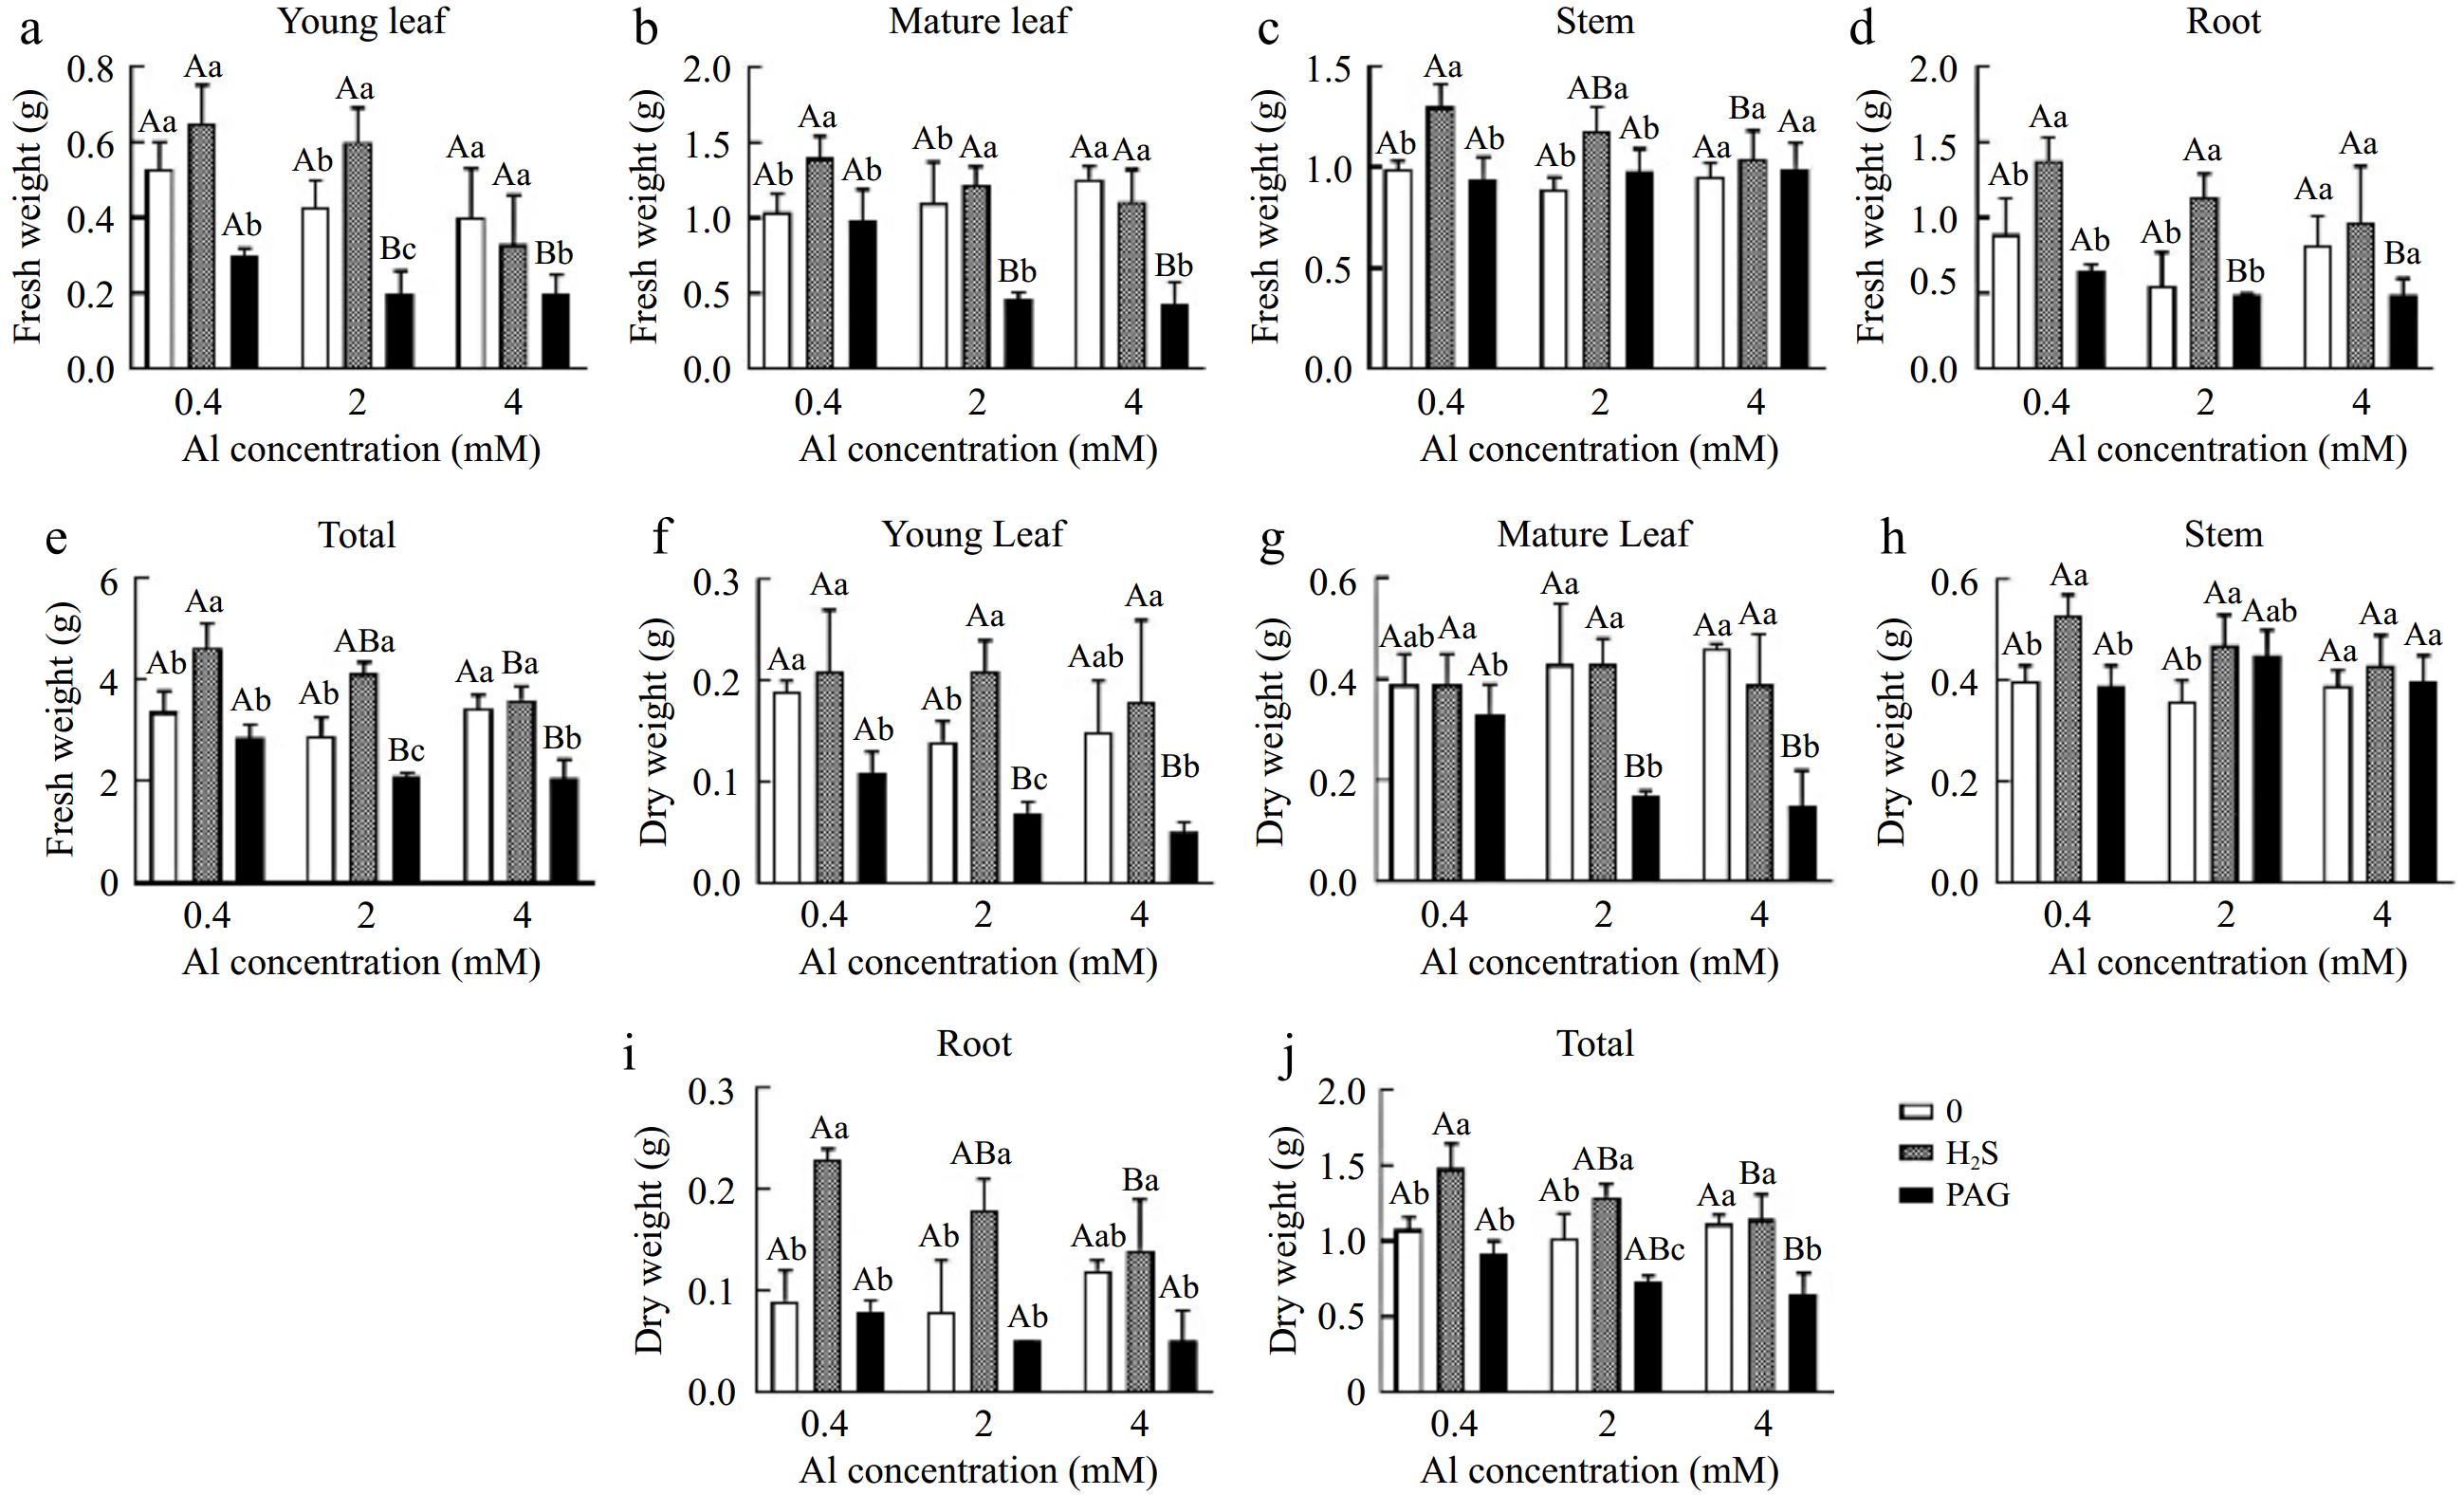
Figure 2.
Fresh and dry weight in (a, f) young leaves, (b, g) matures leaves, (c, h) stems, (d, i) roots, and (e, j) total content of Al of C. sinensis cultured with different treatments. Different lowercase letters represent significant differences among different H2S conditions under the same Al concentration treatment, and different uppercase letters represent significant differences among different Al concentration treatments under the same H2S condition (p < 0.05), as determined by the Duncan test.
-
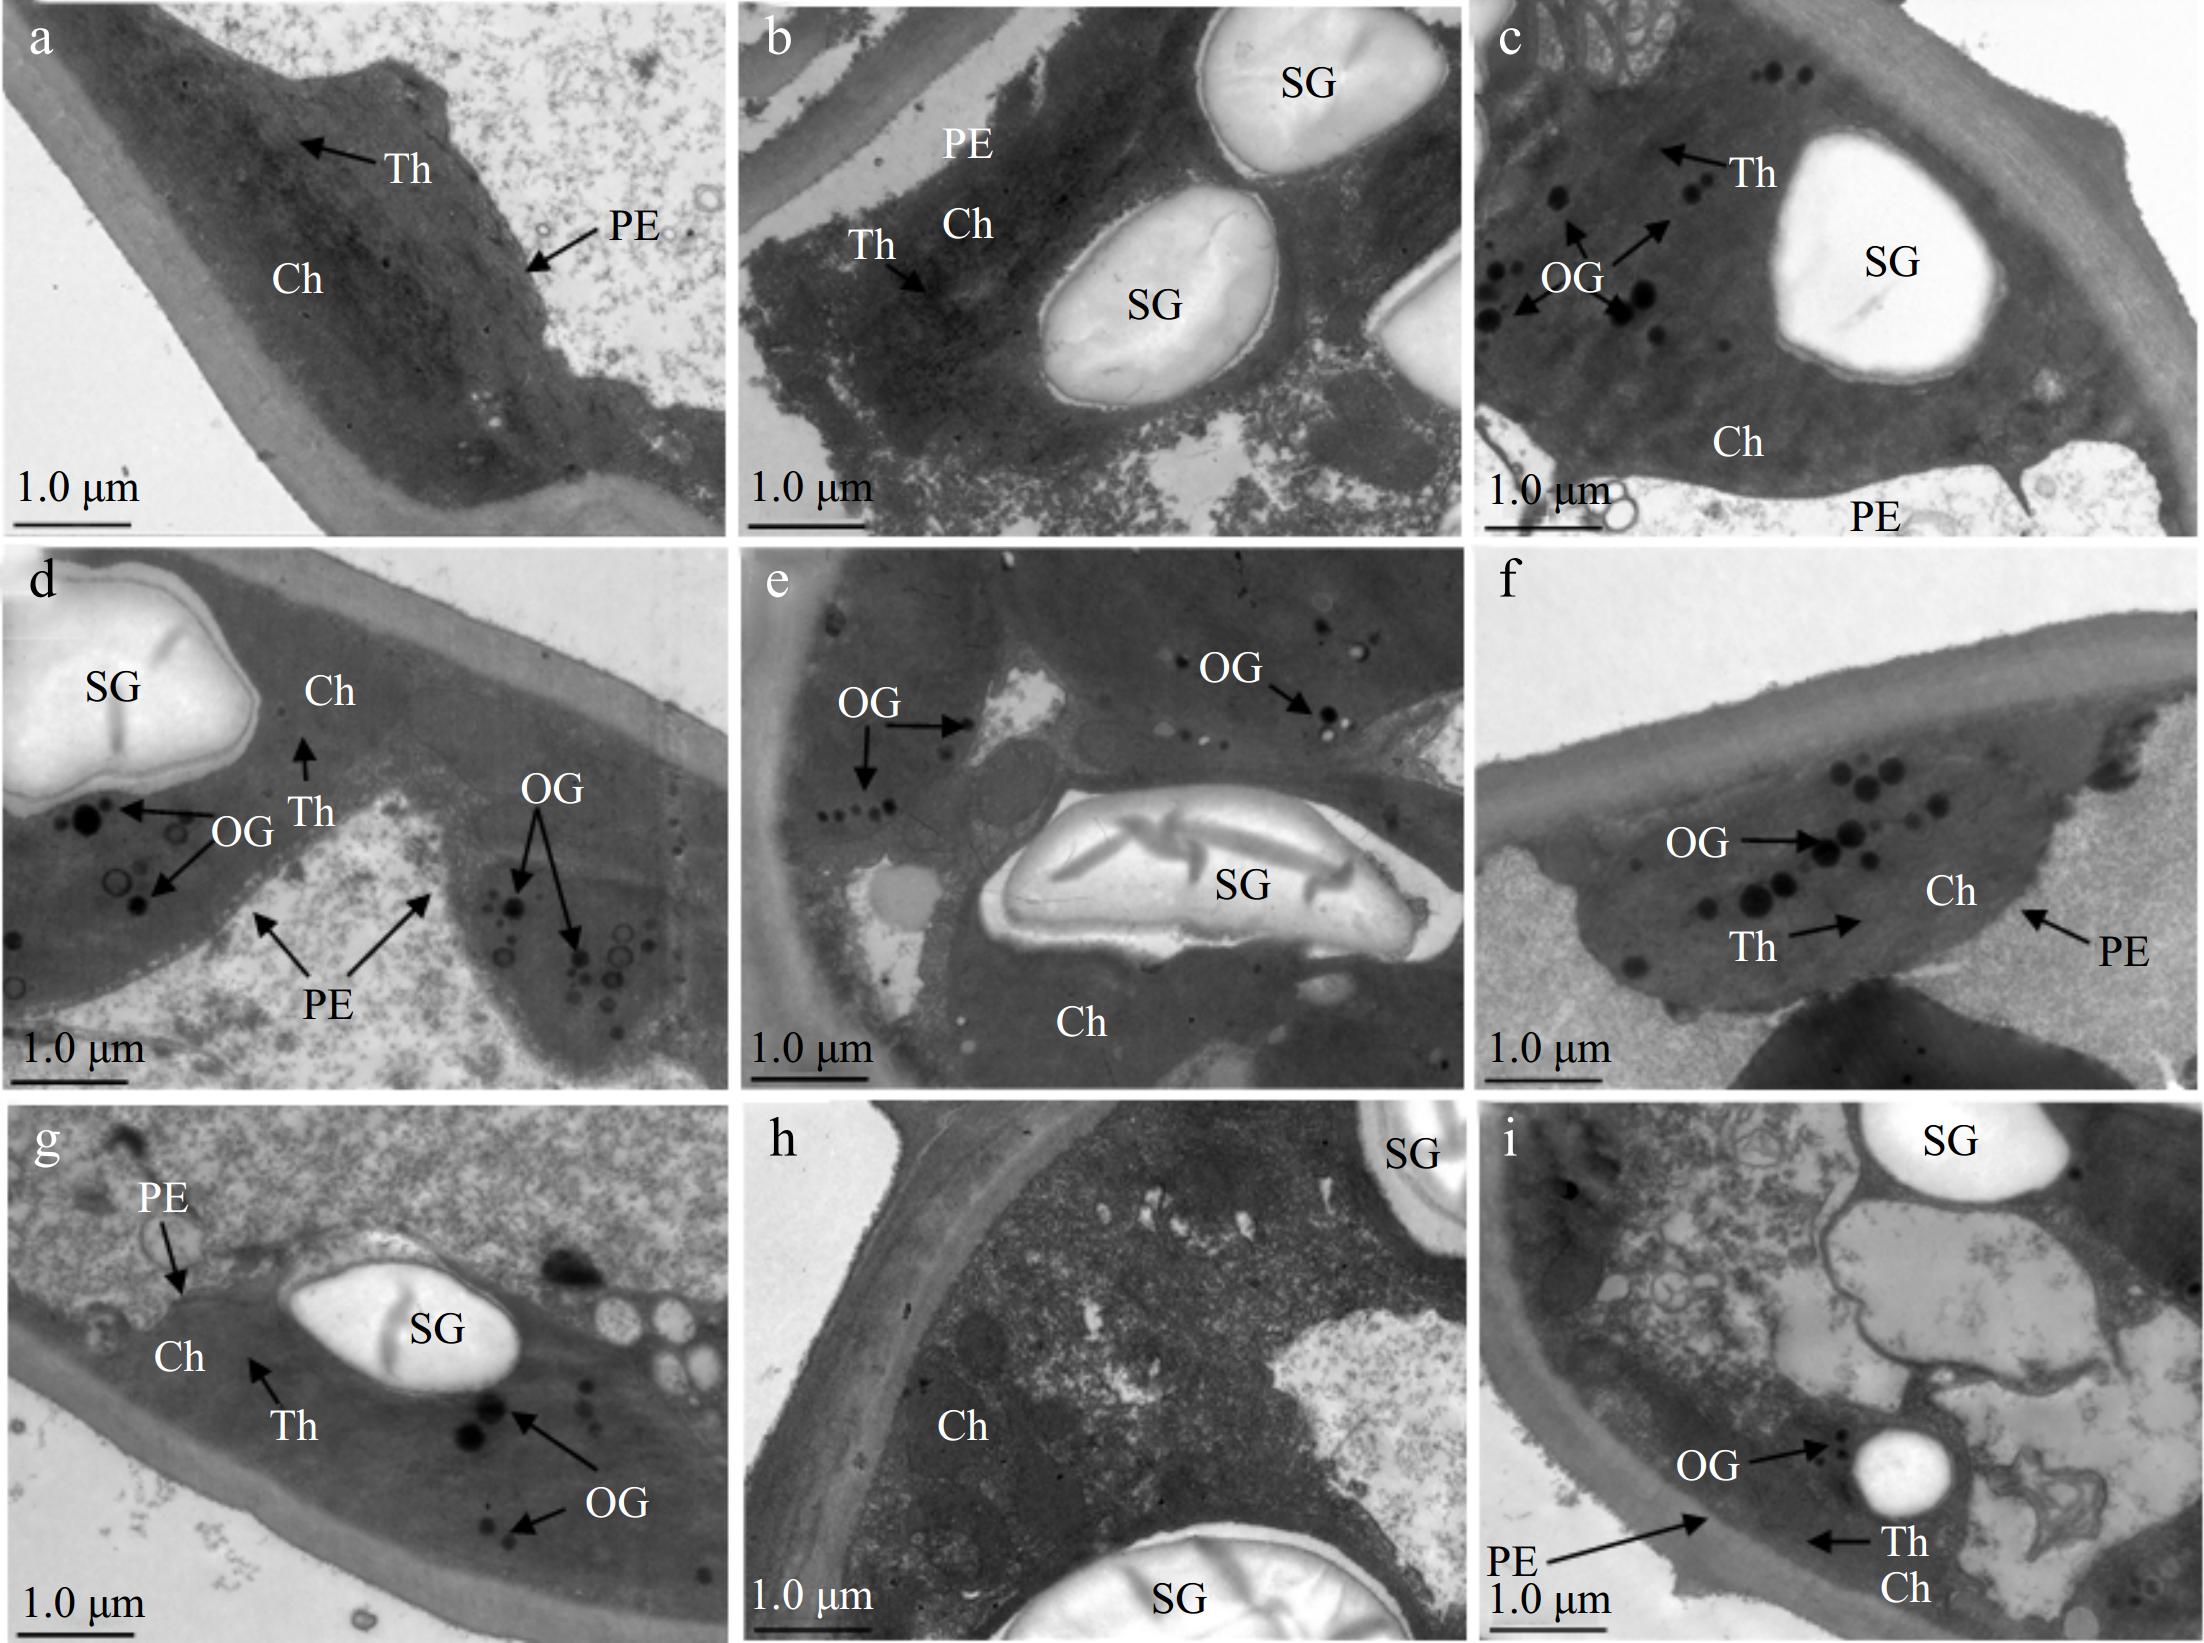
Figure 3.
Different changes in ultrastructure of C. sinensis after different treatments. (a) 0.4Al, (b) H2S + 0.4Al, (c) PAG + 0.4Al, (d) 2Al, (e) H2S + 2Al, (f) PAG + 2Al, (g) 4Al, h: H2S + 4Al, (i) PAG + 4Al. PE: chloroplast membrane, Ch: chloroplast, SG: starch granules, Th: matrix lamellae, OG: osmiophilic granule. Scale bar = 1.0 μm.
-
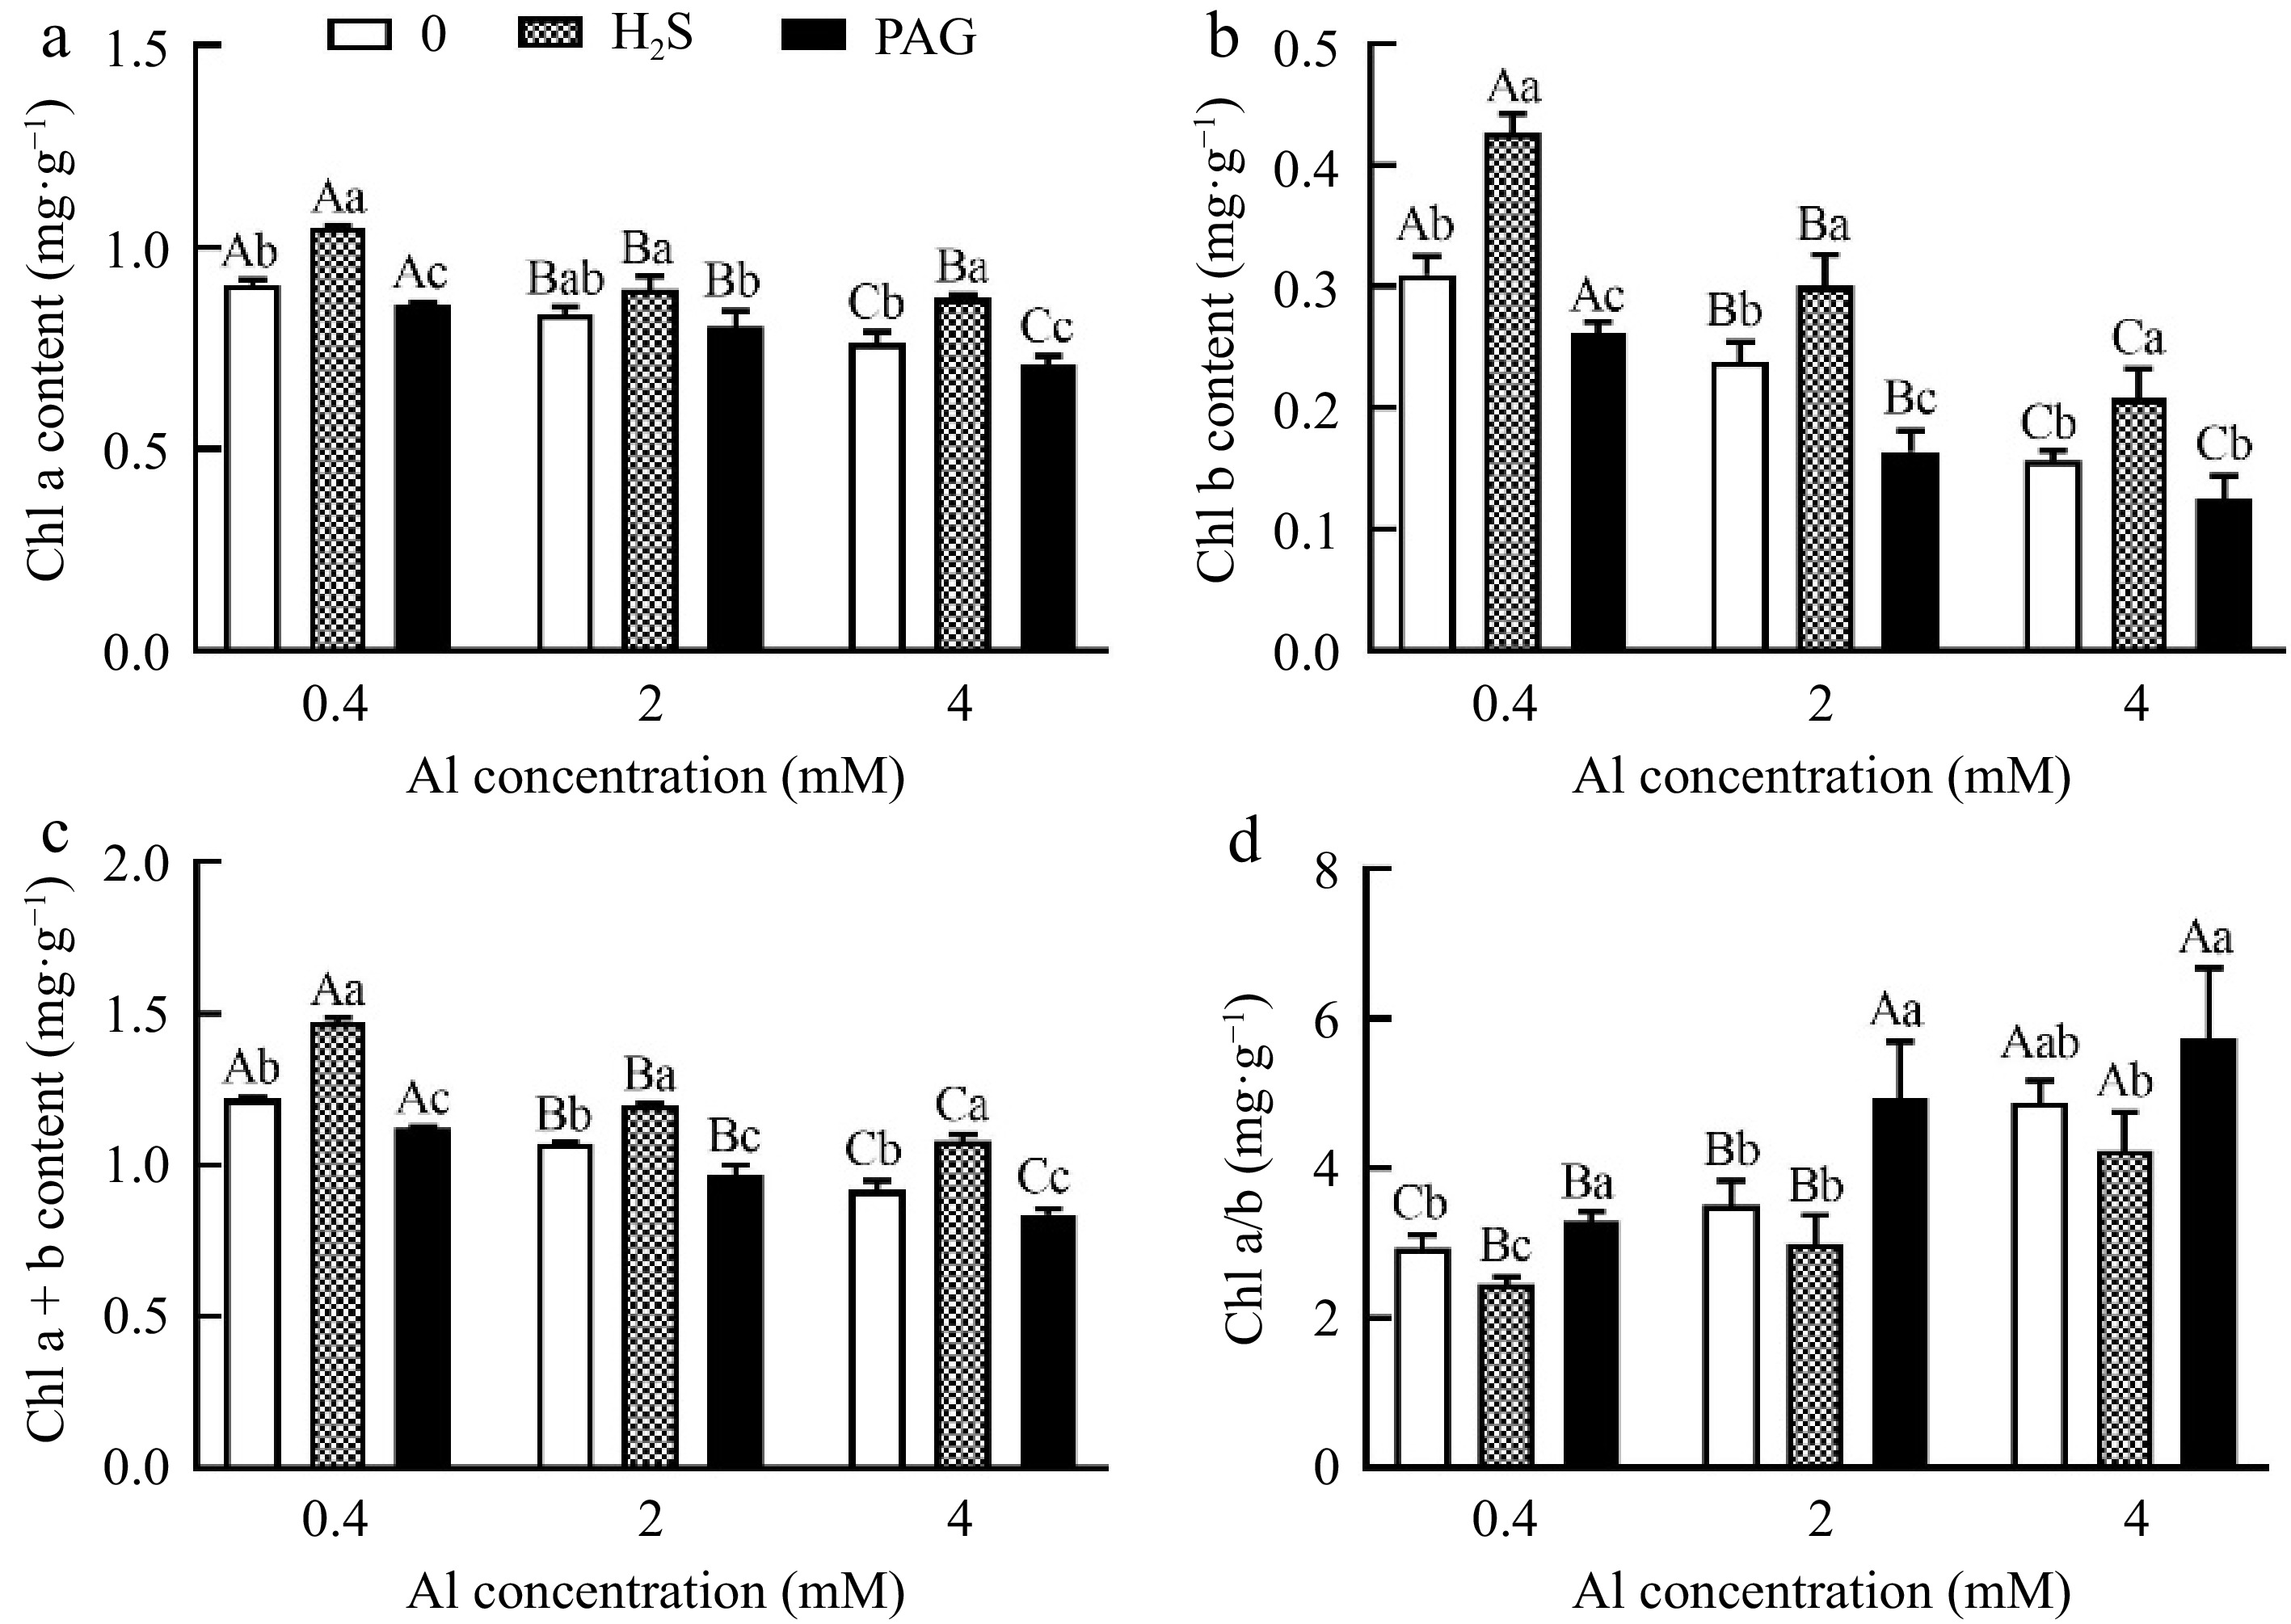
Figure 4.
Changes in chlorophyll content of C. sinensis after different treatments. Different lowercase letters represent significant differences among different H2S conditions under the same Al concentration treatment, and different uppercase letters represent significant differences among different Al concentration treatments under the same H2S condition (p < 0.05), as determined by the Duncan test.
-
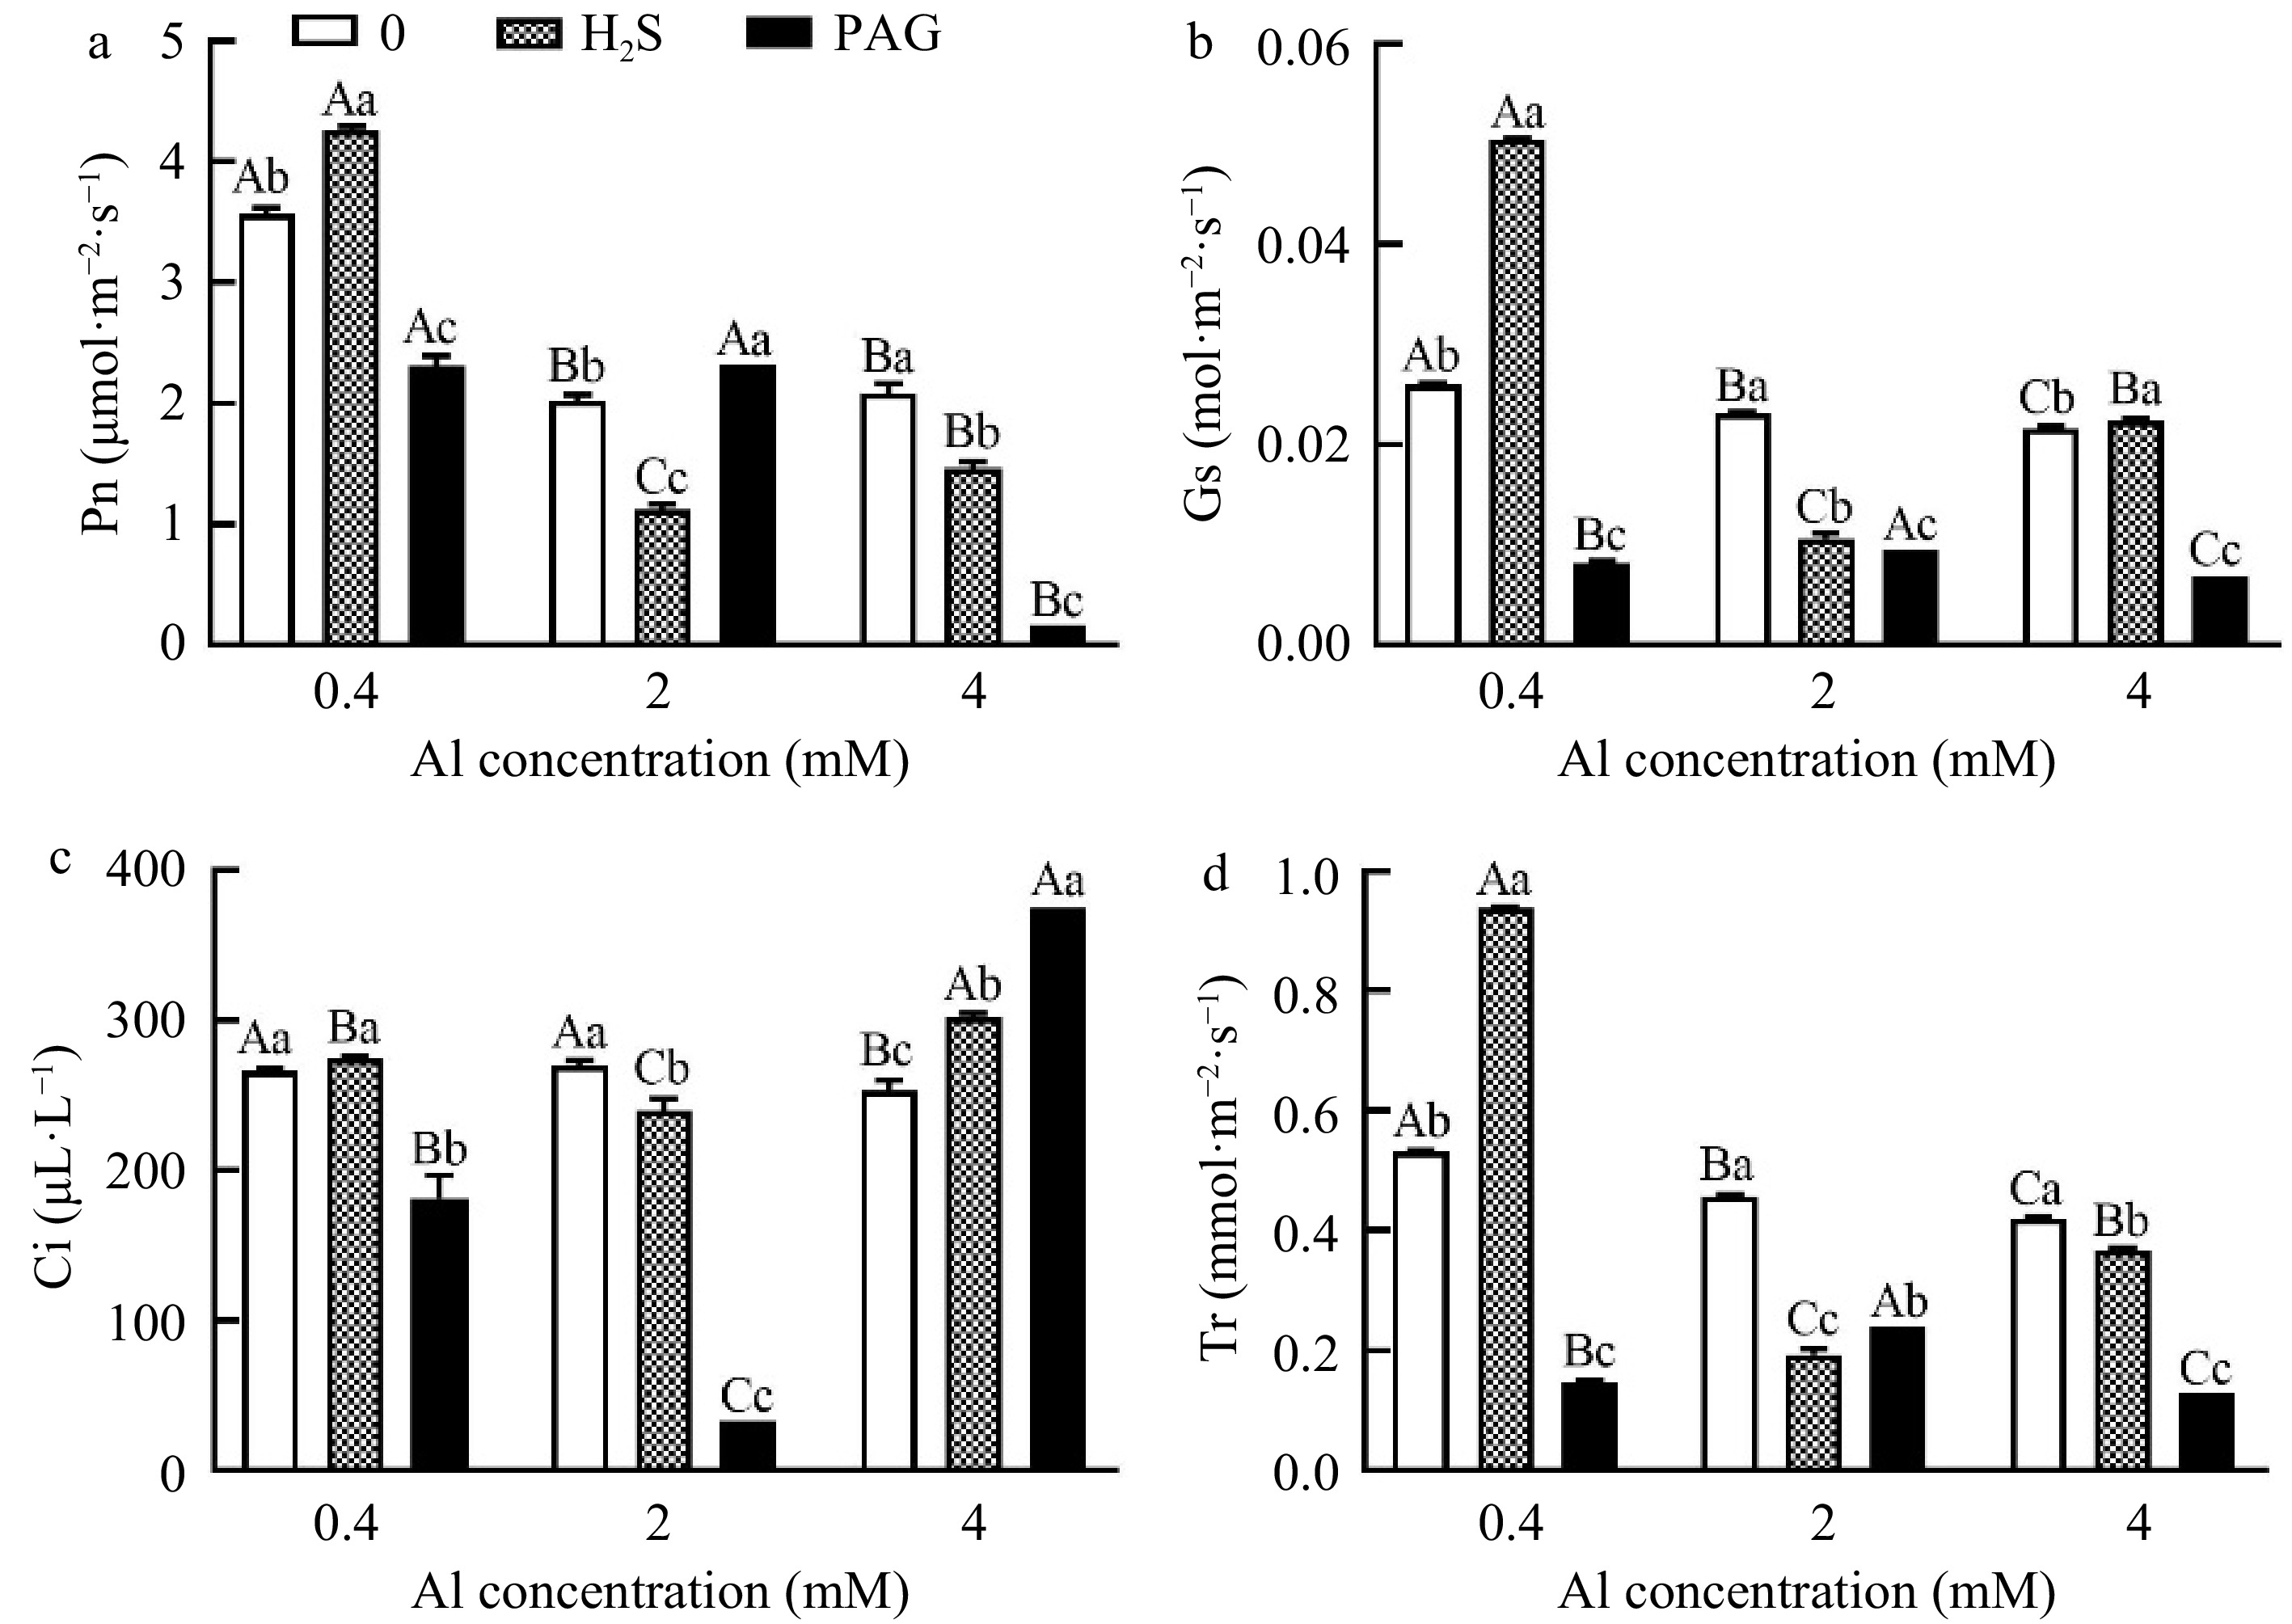
Figure 5.
Changes in photosynthetic parameters of C. sinensis under different treatments. Different lowercase letters represent significant differences among different H2S conditions under the same Al concentration treatment, and different uppercase letters represent significant differences among different Al concentration treatments under the same H2S condition (p < 0.05), as determined by the Duncan test.
-
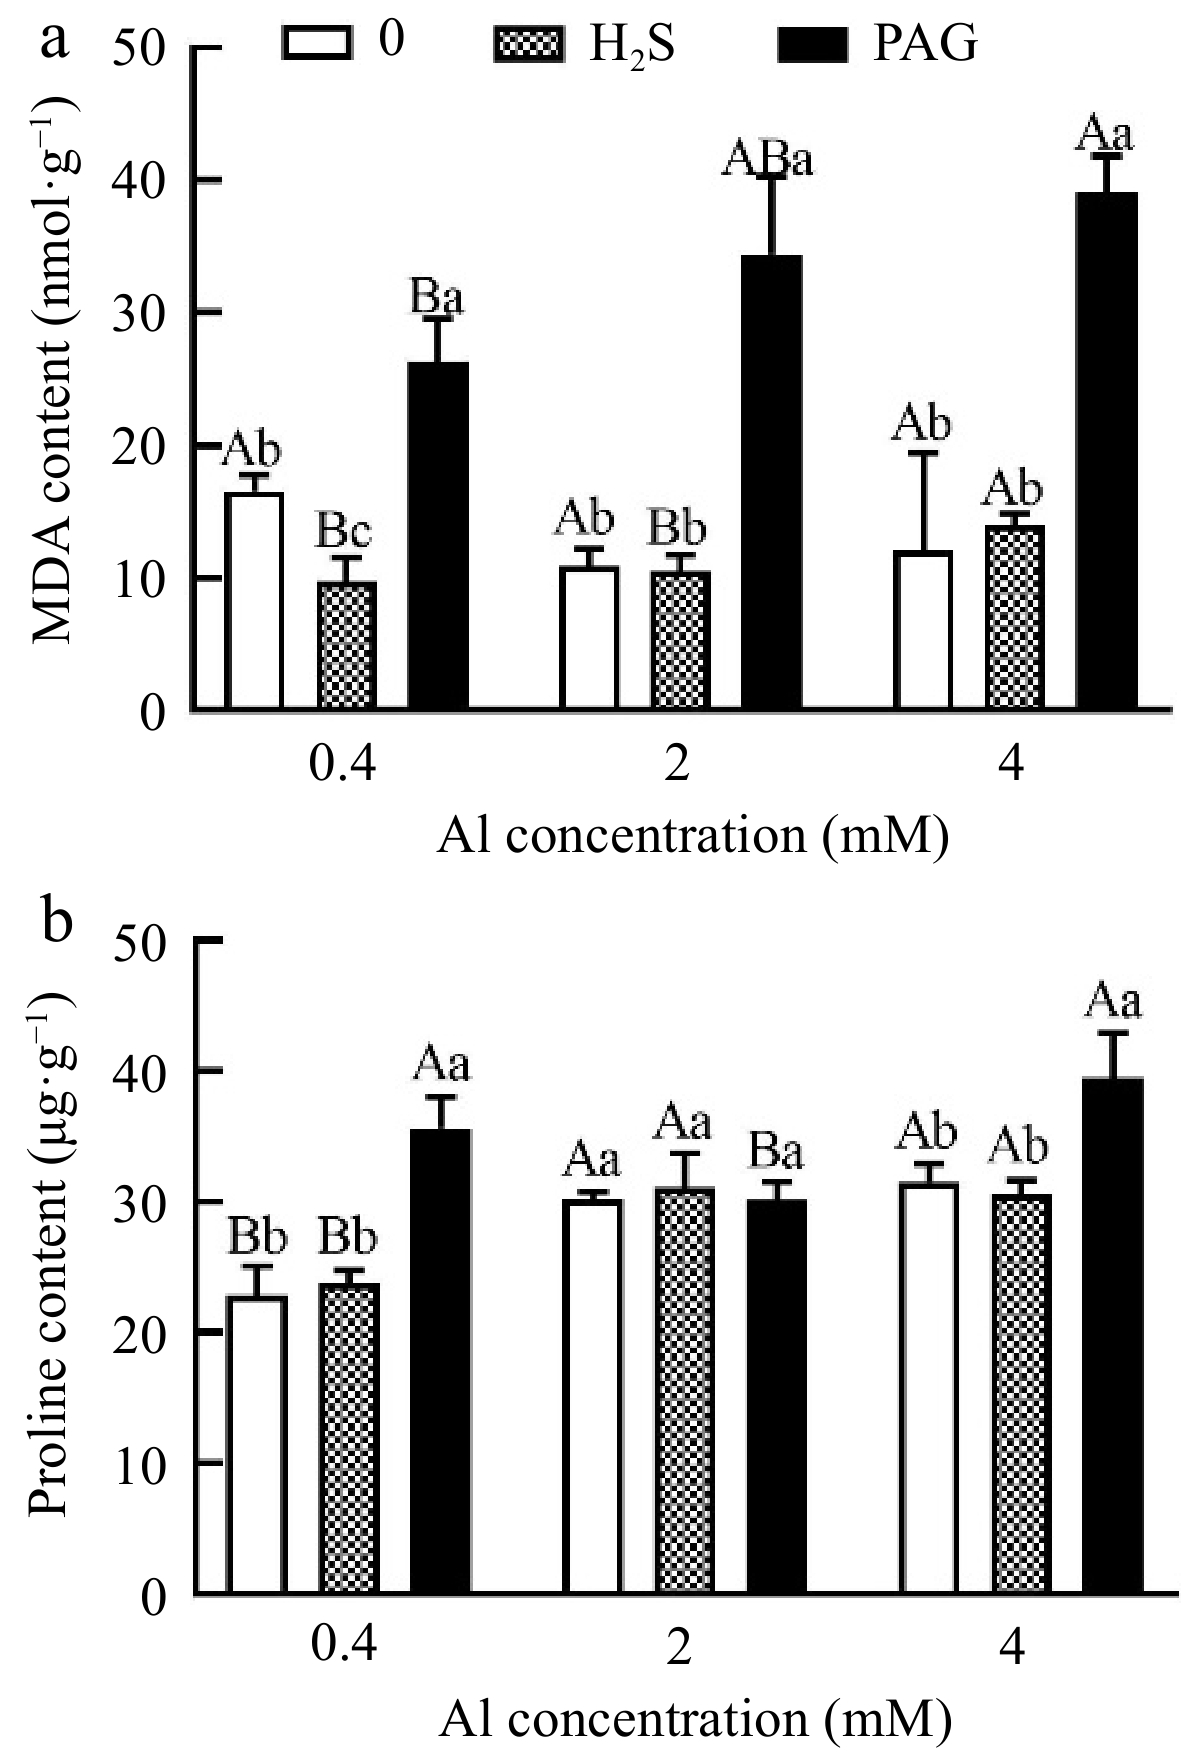
Figure 6.
The effect of different treatments on (a) MDA and (b) proline content in tea leaves. Different lowercase letters represent significant differences among different H2S conditions under the same Al concentration treatment, and different uppercase letters represent significant differences among different Al concentration treatments under the same H2S condition (p < 0.05), as determined by the Duncan test.
-

Figure 7.
C. sinensis on antioxidant enzyme activities in (a), (c), (e) leaves and (b), (d), (f) roots with different treatments. Different lowercase letters represent significant differences among different H2S conditions under the same Al concentration treatment, and different uppercase letters represent significant differences among different Al concentration treatments under the same H2S condition (p < 0.05), as determined by the Duncan test.
-
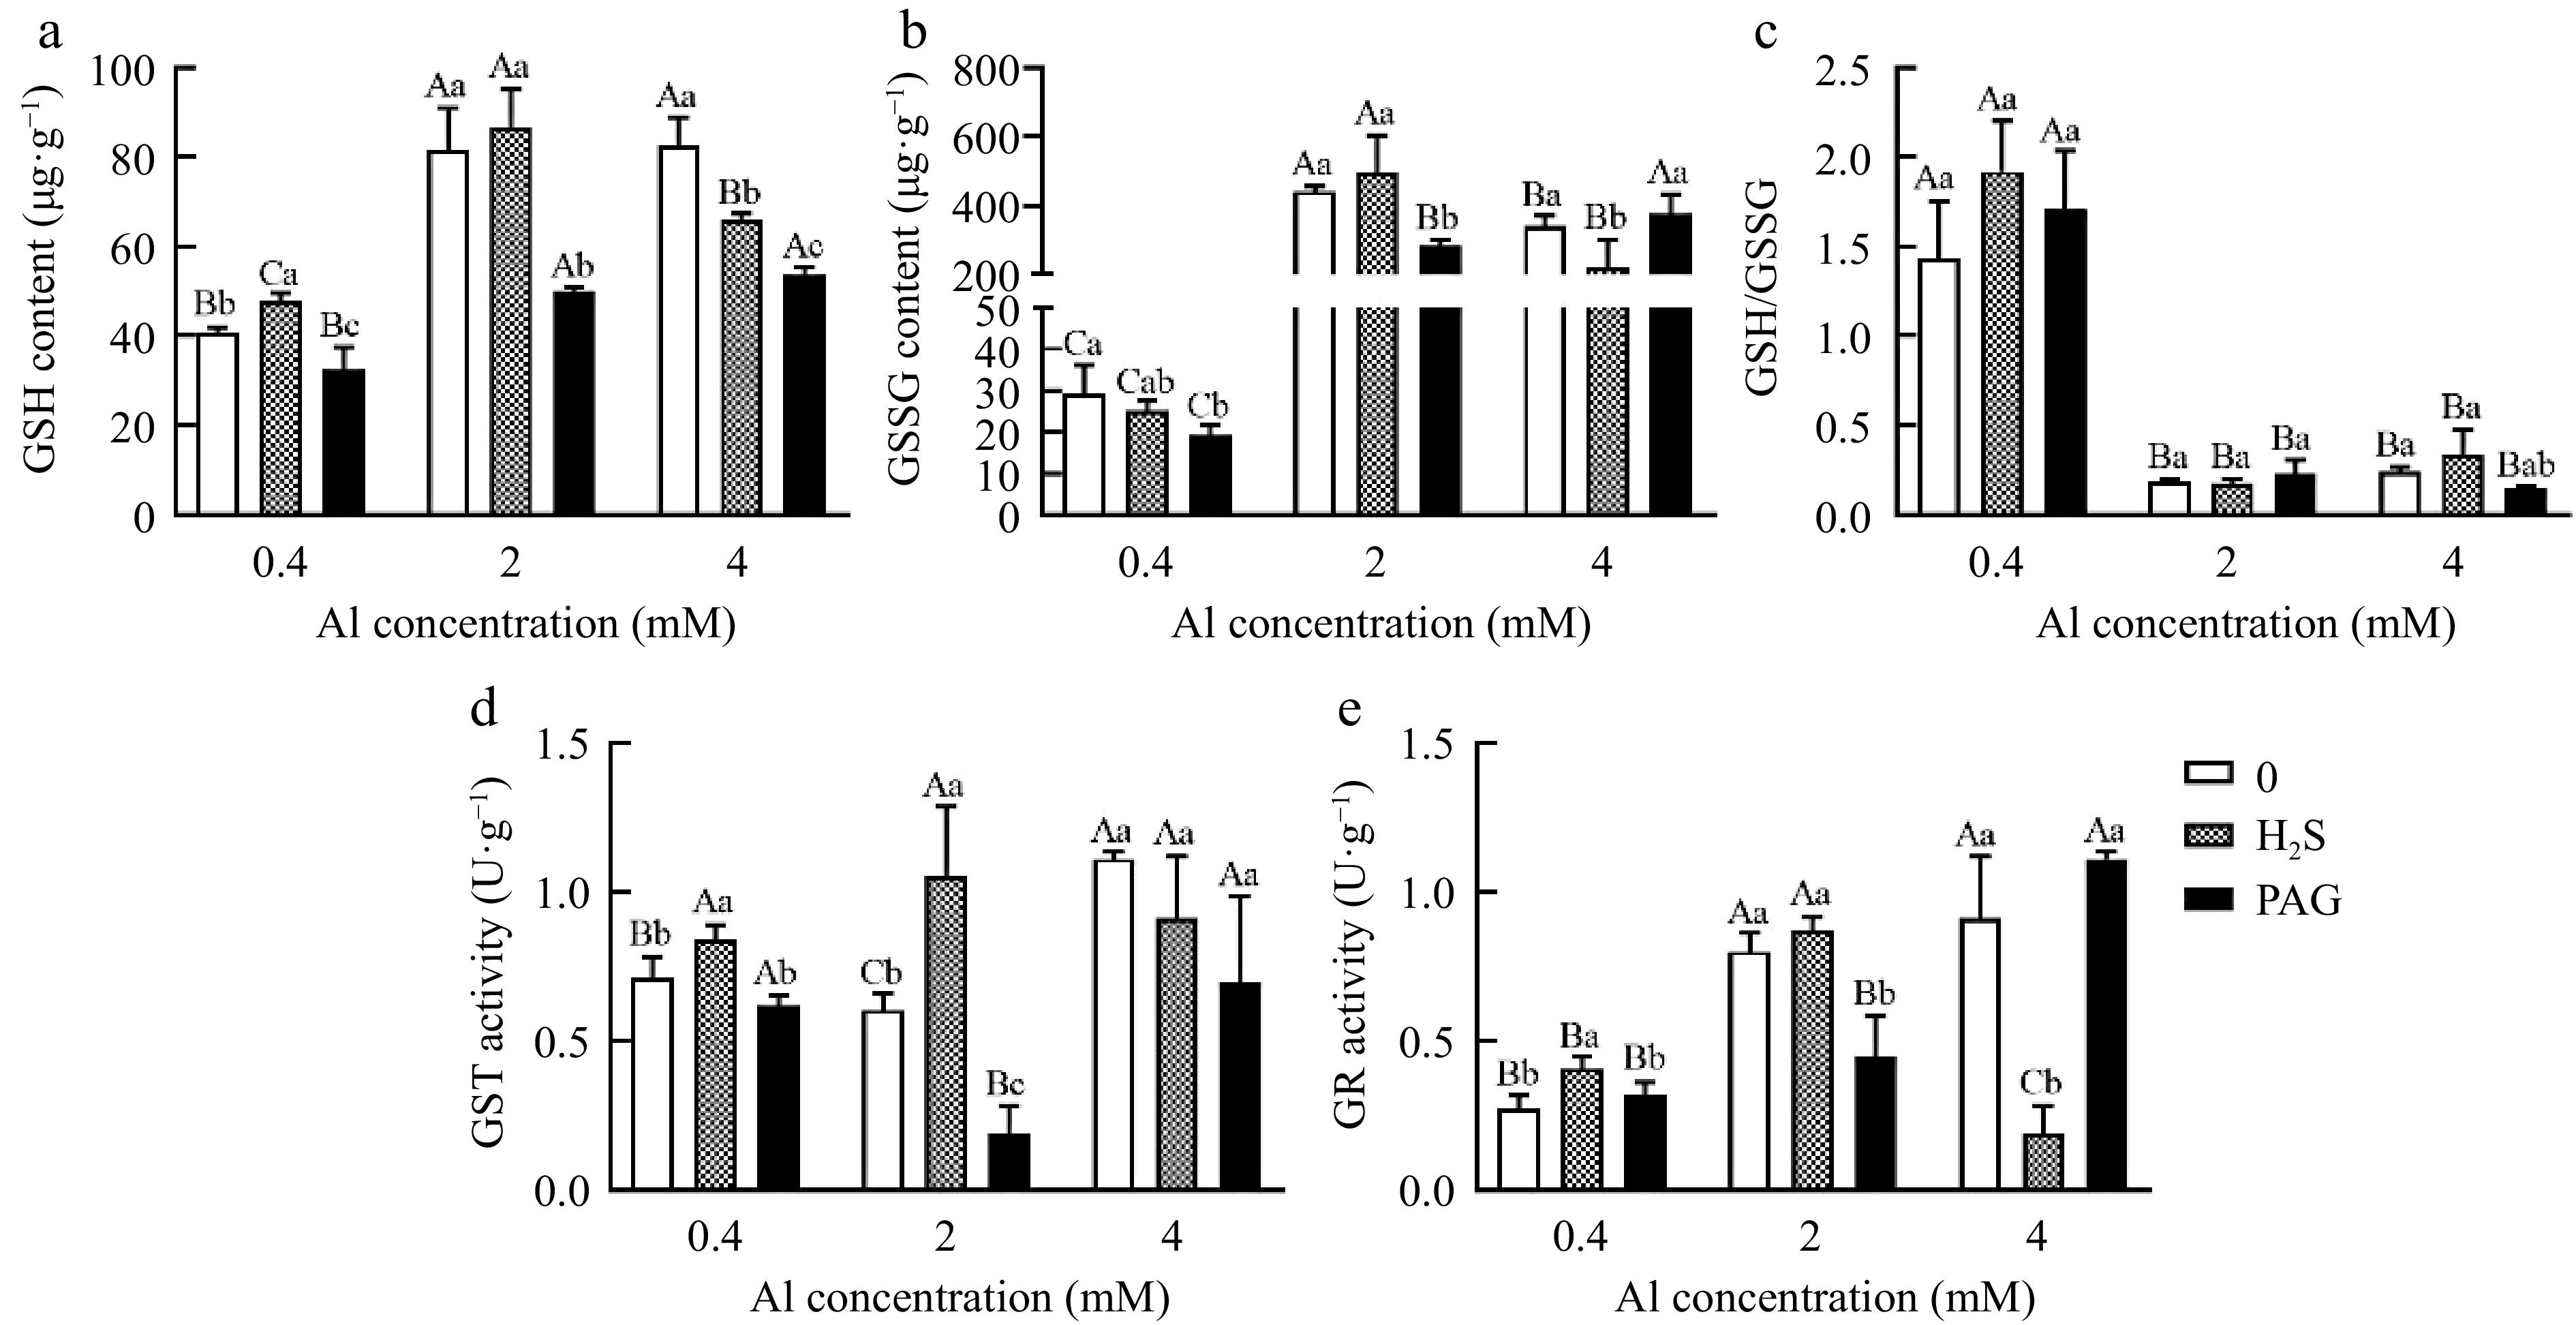
Figure 8.
Effect of different treatments on (a) GSH content, (b) GSSG content, (c) GSH/GSSG, (d) GST activity and (e) GR activity in tea leaves. Different lowercase letters represent significant differences among different H2S conditions under the same Al concentration treatment, and different uppercase letters represent significant differences among different Al concentration treatments under the same H2S condition (p < 0.05), as determined by the Duncan test.
-
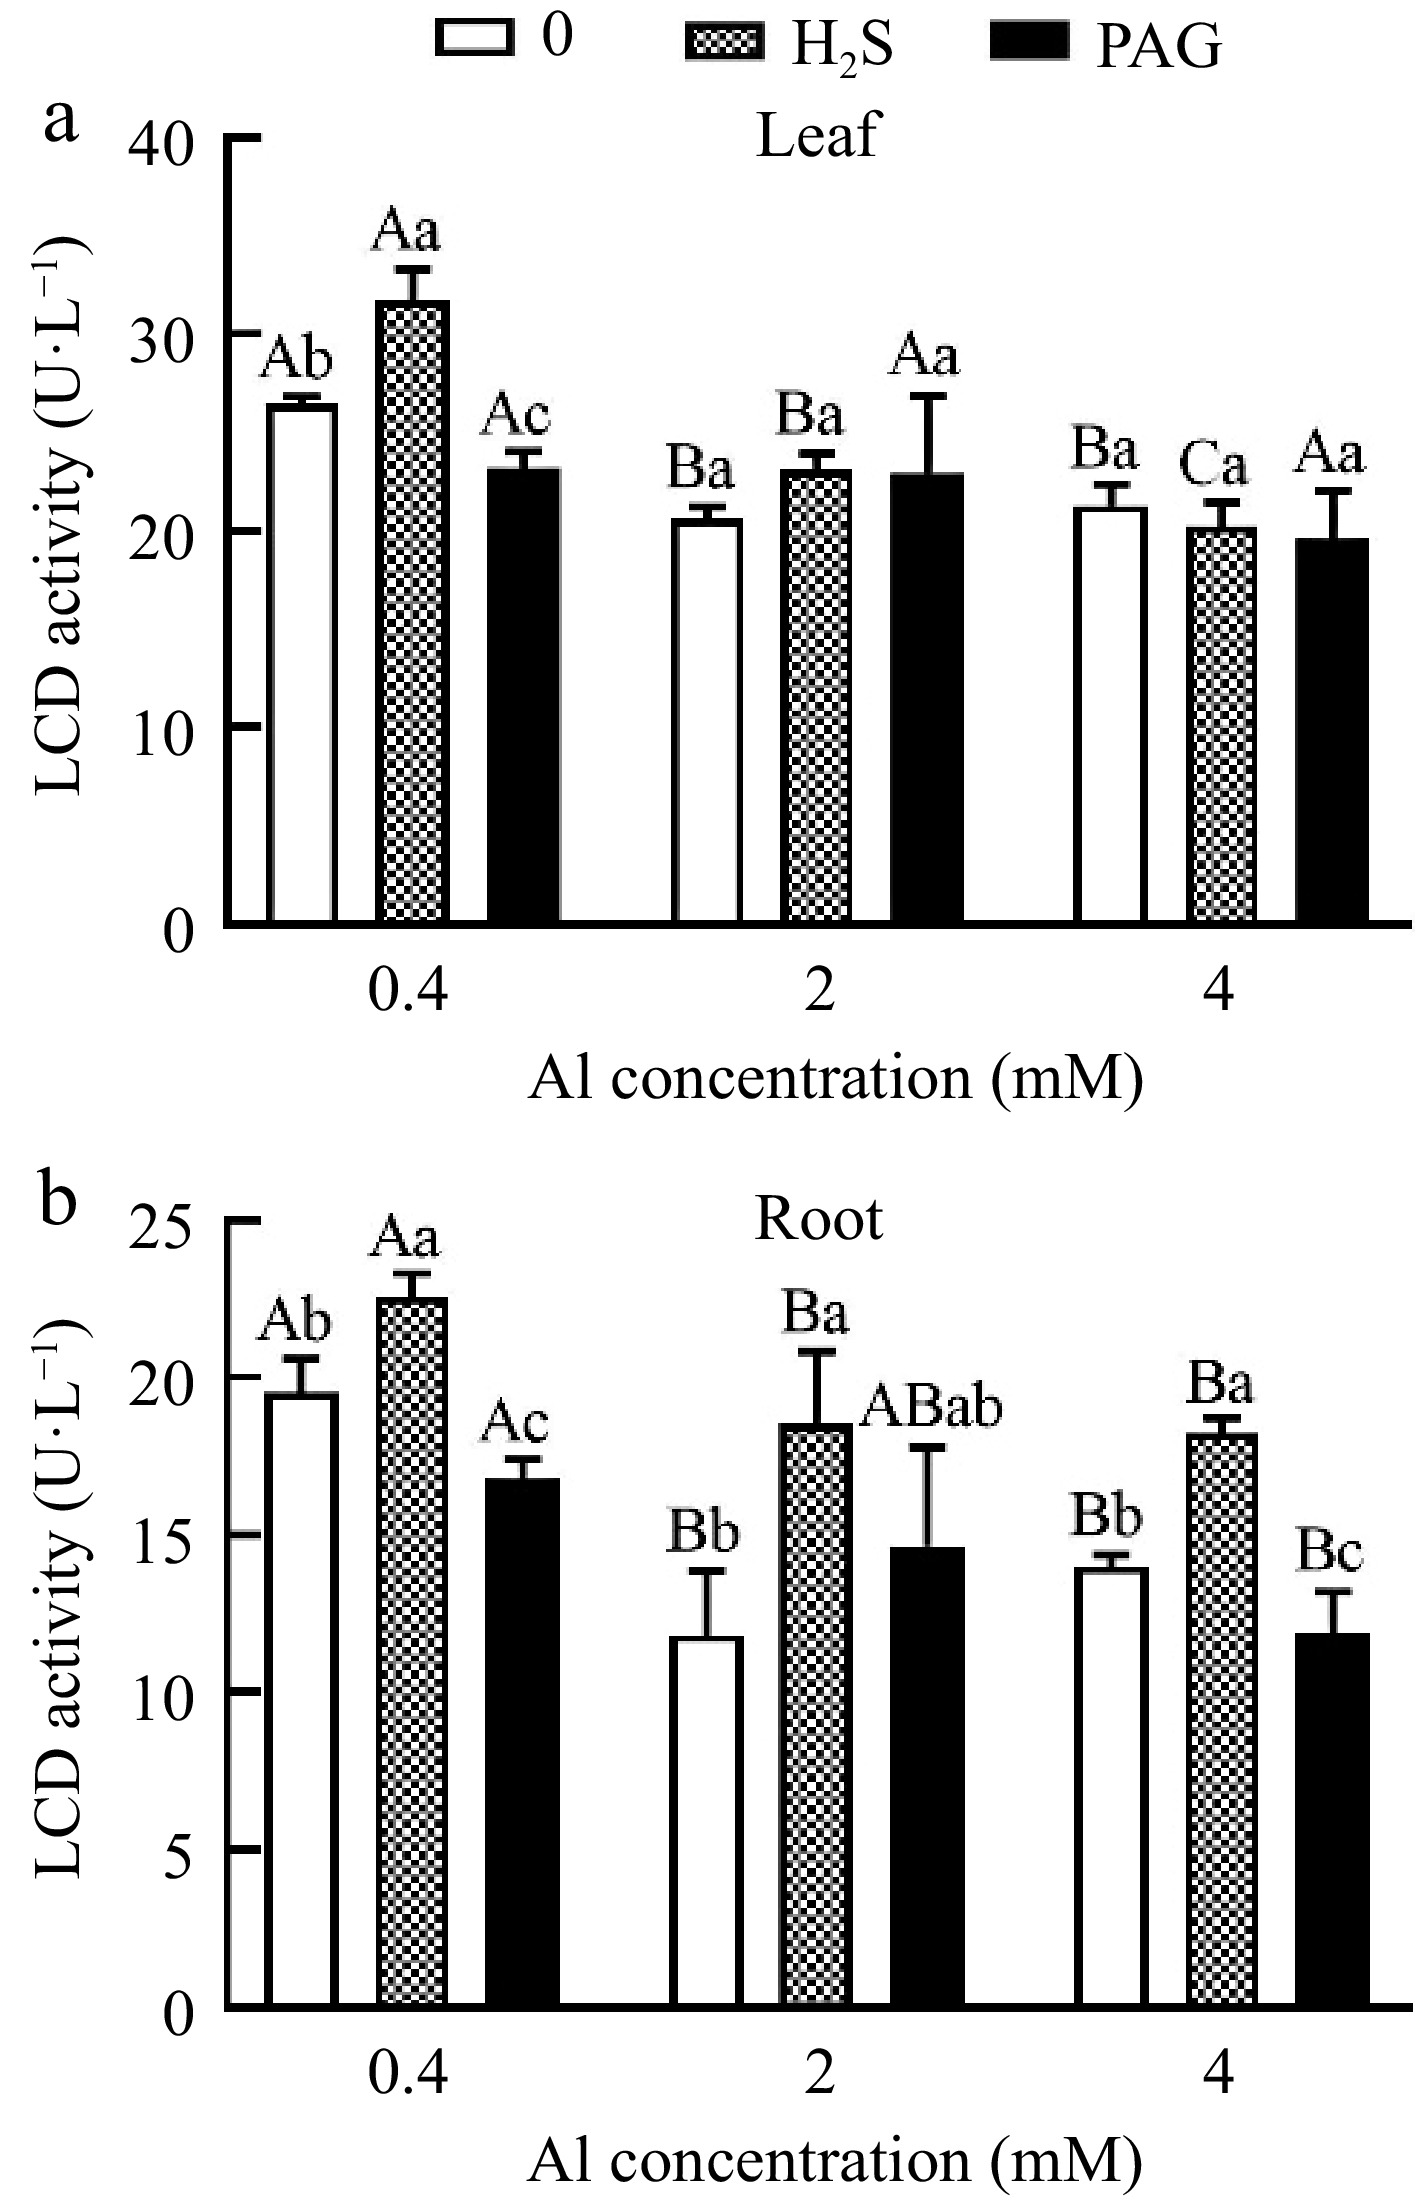
Figure 9.
C. sinensis on LCD activities in (a) leaves and (b) roots with different treatments. Different lowercase letters represent significant differences among different H2S conditions under the same Al concentration treatment, and different uppercase letters represent significant differences among different Al concentration treatments under the same H2S condition (p < 0.05), as determined by the Duncan test.
-
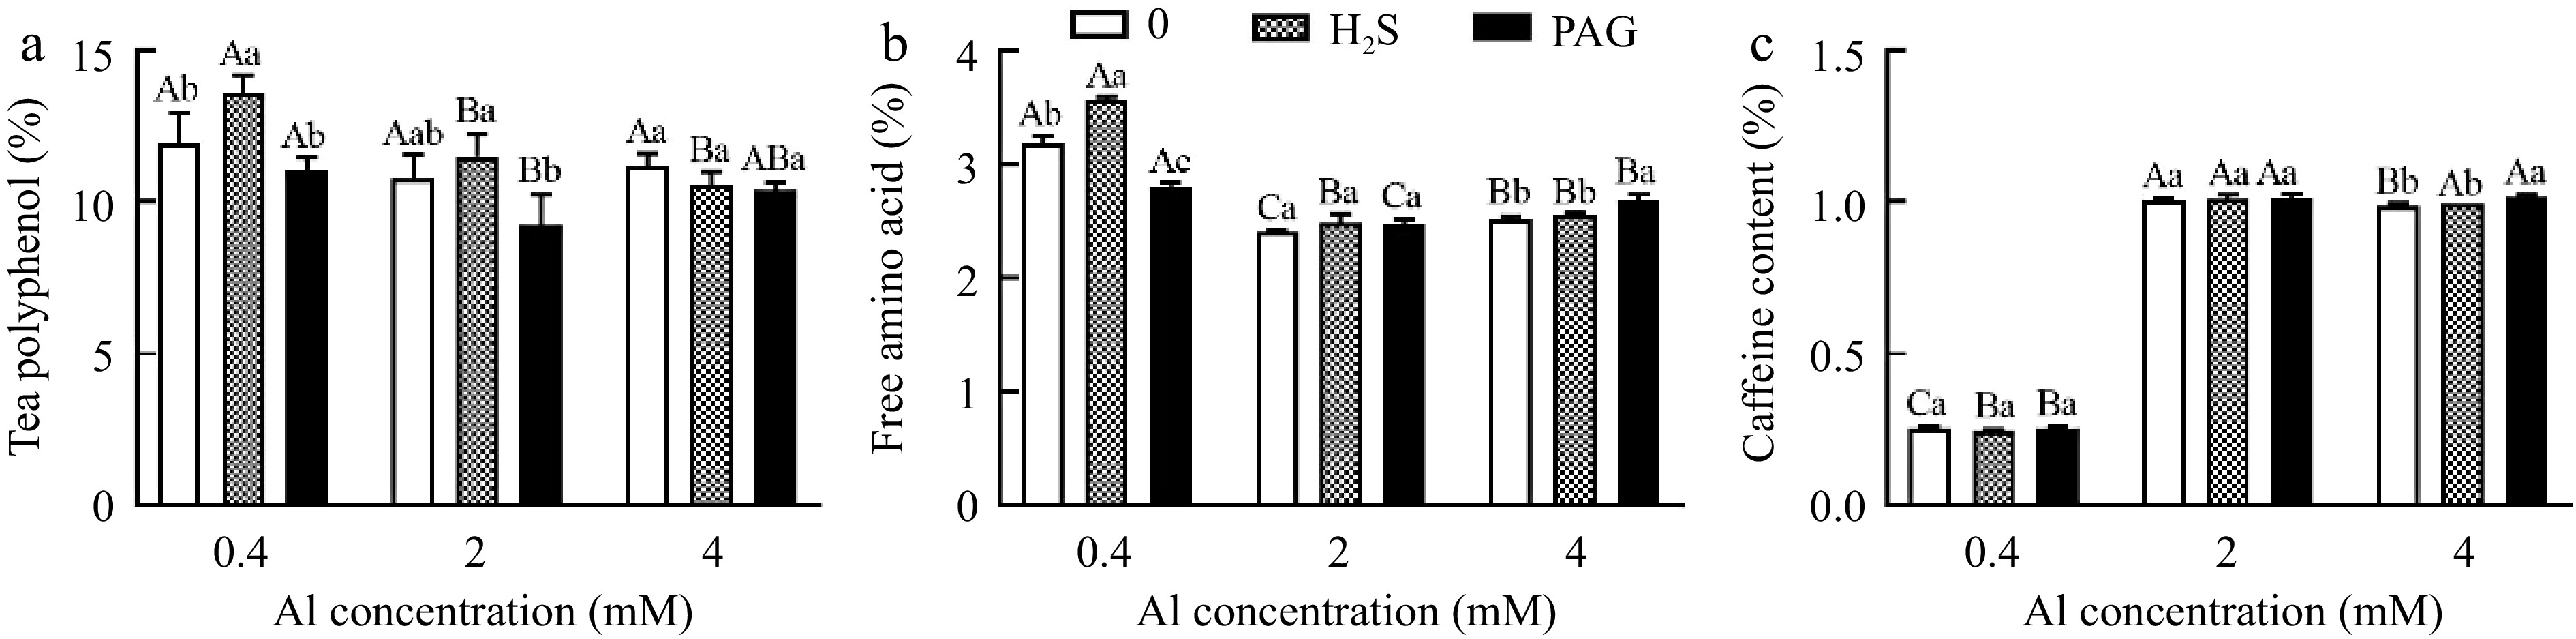
Figure 10.
The performance of (a) tea polyphenol, (b) free amino acid and (c) caffeine content in different treatments. Different lowercase letters represent significant differences among different H2S conditions under the same Al concentration treatment, and different uppercase letters represent significant differences among different Al concentration treatments under the same H2S condition (p < 0.05), as determined by the Duncan test.
-
Treatments Days 1−15 Days 15−30 0.4Al (control) 0.4 mmol·L−1 Al3+ 0.4 mmol·L−1 Al3+ H2S + 0.4Al 100 μmol·L−1 H2S + 0.4 mmol·L−1 Al3+ 0.4 mmol·L−1 Al3+ PAG + 0.4Al 1 mmol·L−1 PAG + 0.4 mmol·L−1 Al3+ 0.4 mmol·L−1 Al3+ 2Al 0.4 mmol·L−1 Al3+ 2 mmol·L−1 Al3+ H2S + 2Al 100 μmol·L−1 H2S + 0.4 mmol·L−1 Al3+ 2 mmol·L−1 Al3+ PAG + 2Al 1 mmol·L−1 PAG + 0.4 mmol·L−1 Al3+ 2 mmol·L−1 Al3+ 4Al 0.4 mmol·L−1 Al3+ 4 mmol·L−1 Al3+ H2S + 4Al 100 μmol·L−1 H2S + 0.4 mmol·L−1 Al3+ 4 mmol·L−1 Al3+ PAG + 4Al 1 mmol·L−1 PAG + 0.4 mmol·L−1 Al3+ 4 mmol·L−1 Al3+ Table 1.
Description of nine experimental treatments.
-
Elements Treatment YL (mg·kg−1) ML (mg·kg−1) S (mg·kg−1) R (mg·kg−1) Total content (mg·kg−1) TF (%) Al 0.4Al 551.30 ± 25.52Ba 1204.96 ± 324.00Aa 427.13 ± 12.20Ba 2566.89 ± 96.52Bc 4750.29 ± 207.35Bc 0.85 ± 0.14Aa 0.4Al + H2S 474.49 ± 57.74Ba 1605.65 ± 30.85Ba 558.06 ± 69.96Ca 5323.33 ± 506.90Cb 7961.52 ± 573.30Bb 0.50 ± 0.04Bb 0.4Al + PAG 291.67 ± 33.05Cb 1125.82 ± 345.62Aa 537.35 ± 118.21Aa 23523.28 ± 1412.99Ba 25478.12 ± 1623.32Ba 0.08 ± 0.01Bc 2Al 700.68 ± 14.51Ab 1232.58 ± 102.65Ab 735.12 ± 40.15Ab 15651.00 ± 387.50Ab 18319.37 ± 478.25Ab 0.17 ± 0.01Bb 2Al + H2S 758.33 ± 51.39Ab 2000.13 ± 209.09Aa 976.59 ± 29.70Aa 8574.85 ± 700.31Bc 12309.90 ± 638.39Ac 0.44 ± 0.05Ba 2Al + PAG 999.06 ± 45.47Ba 1101.78 ± 48.02Ab 669.60 ± 131.31Ab 28361.41 ± 199.73Aa 31131.86 ± 296.48Aa 0.10 ± 0.01ABc 4Al 771.52 ± 123.22Ab 1342.59 ± 60.73Aa 675.39 ± 120.29Aa 14741.91 ± 2122.85Ab 17531.41 ± 2218.98Ab 0.19 ± 0.03Bb 4Al + H2S 819.06 ± 20.35Ab 1475.13 ± 107.29Ba 732.93 ± 62.82Ba 10066.06 ± 835.49Ac 13093.18 ± 954.89Ab 0.30 ± 0.02Aa 4Al + PAG 1285.44 ± 106.37Aa 1086.46 ± 135.20Ab 756.13 ± 104.12Aa 26682.34 ± 3130.59ABc 29810.37 ± 3150.15Aa 0.12 ± 0.02AAc Values are the mean ± SD (n = 3). Different lowercase letters represent significant differences among different H2S conditions under the same Al concentration treatment, and different uppercase letters represent significant differences among different Al concentration treatments under the same H2S condition (p < 0.05), as determined by the Duncan test. Table 2.
Effects on content and translocation factor (TF) of Al in C. sinensis under different treatments.
-
Elements Treatment YL (mg·kg−1) ML (mg·kg−1) S (mg·kg−1) R (mg·kg−1) Total content (mg·kg−1) TF (%) Ca 0.4Al 6168.53 ± 606.30Bb 13894.03 ± 340.79Aab 2746.77 ± 24.59Bb 476.37 ± 41.02Cc 23285.69 ± 1696.58Bb 47.92 ± 0.76Aa 0.4Al + H2S 8064.69 ± 66.16Ca 13027.66 ± 1043.18Bb 2781.84 ± 61.89Cb 1289.49 ± 60.48Bb 25163.67 ± 436.51Cb 18.53 ± 0.58Ab 0.4Al + PAG 9322.85 ± 1413.64Aa 14978.35 ± 230.29Aa 3606.75 ± 523.74Aa 2144.36 ± 58.02Aa 30052.32 ± 1938.42Aa 13.03 ± 1.24Ac 2Al 11223.02 ± 223.36Aa 12447.40 ± 1926.26Ab 3559.11 ± 198.46Aa 1573.00 ± 74.02Ba 28802.53 ± 598.30Ac 17.33 ± 0.62Ba 2Al + H2S 11693.96 ± 749.31Aa 15968.96 ± 553.09Aa 3955.32 ± 217.77Aa 1695.65 ± 273.89Aa 33313.87 ± 1007.07Aa 19.05 ± 3.82Aa 2Al + PAG 10558.09 ± 739.25Aa 15748.44 ± 629.97Ba 3026.63 ± 321.80Ab 1905.82 ± 193.23ABa 31238.99 ± 388.96Ab 15.51 ± 1.78Aa 4Al 10986.74 ± 1426.59Aa 12852.33 ± 968.51Ab 3355.19 ± 272.64Aab 1878.07 ± 191.42Aa 29072.34 ± 1204.10Aa 14.57 ± 1.35Cb 4Al + H2S 10405.55 ± 102.64Ba 14656.58 ± 769.17ABa 3566.27 ± 65.69Ba 1511.59 ± 84.73ABb 30140.00 ± 1162.14Ba 18.96 ± 0.69Aa 4Al + PAG 10806.80 ± 1205.83Aa 12881.85 ± 15.75Bb 3227.25 ± 1.88Ab 1713.41 ± 164.33Bab 28629.31 ± 1365.33Aa 15.77 ± 0.97Ab Mg 0.4Al 2161.53 ± 297.57Ba 2987.80 ± 291.75Aab 1388.72 ± 43.03Bb 346.52 ± 15.37Bc 6884.56 ± 597.72Bb 18.87 ± 1.45Aa 0.4Al + H2S 2679.11 ± 76.29Ca 2869.31 ± 12.76Ab 1326.99 ± 29.76Bb 1384.29 ± 37.80Aa 8259.70 ± 93.16Ca 4.97 ± 0.21Bc 0.4Al + PAG 2551.51 ± 378.60Ba 3266.05 ± 76.24Aa 2152.37 ± 144.18Aa 497.68 ± 22.78Ab 8467.61 ± 526.12ABa 16.04 ± 1.39Ab 2Al 3203.55 ± 83.10Aa 2612.19 ± 216.71Ab 1578.27 ± 51.43Ab 924.90 ± 98.81Ab 8318.92 ± 253.97Ac 8.06 ± 0.95Bb 2Al + H2S 3307.60 ± 162.06Aa 3142.00 ± 338.93Aa 1660.00 ± 103.48Ab 1322.66 ± 58.80Aa 9432.27 ± 159.11Aa 6.14 ± 0.43Ab 2Al + PAG 3089.27 ± 163.42Aa 3290.93 ± 108.91Aa 1908.25 ± 31.93Ba 498.33 ± 39.52Ac 8786.78 ± 71.55Ab 16.70 ± 1.37Aa 4Al 3610.66 ± 446.66Aa 2809.35 ± 171.88Aa 1442.35 ± 119.96ABb 954.41 ± 122.46Ab 8816.77 ± 562.41Aa 8.30 ± 0.78Bb 4Al + H2S 3059.80 ± 57.45Bb 2752.72 ± 222.97Aa 1561.74 ± 53.55Ab 1284.43 ± 54.96Aa 8658.69 ± 280.14Ba 5.74 ± 0.13Ab 4Al + PAG 2707.61 ± 5.02ABb 2584.47 ± 406.13Ba 2072.19 ± 16.34ABa 387.73 ± 33.22Bc 7752.01 ± 387.21Bb 19.12 ± 2.39Aa Zn 0.4Al 8.70 ± 1.12Ca 12.22 ± 1.13Ba 18.92 ± 1.49Bb 23.29 ± 1.72Bc 63.12 ± 2.34Bc 1.72 ± 0.14Aa 0.4Al + H2S 11.58 ± 3.00Ca 14.66 ± 2.74Aa 20.42 ± 2.36Bb 82.47 ± 4.76Ca 129.13 ± 5.16Ba 0.57 ± 0.04Bc 0.4Al + PAG 9.33 ± 1.22Ca 12.43 ± 0.50Ba 25.11 ± 0.62Ba 59.10 ± 2.76Aa 105.96 ± 1.00Cb 0.80 ± 0.07Cb 2Al 13.68 ± 1.25Bab 14.98 ± 1.59ABa 27.60 ± 2.46Aa 74.61 ± 5.32Aa 130.86 ± 3.45Ab 0.76 ± 0.11Bb 2Al + H2S 15.49 ± 0.95Ba 16.72 ± 1.98Aa 26.31 ± 3.59ABa 123.25 ± 4.99Aa 181.77 ± 5.41Aa 0.48 ± 0.02Cc 2Al + PAG 11.80 ± 0.93Bb 20.59 ± 4.06Aa 30.27 ± 1.78Aa 55.57 ± 2.46Aa 118.24 ± 3.15Bc 1.13 ± 0.07Aa 4Al 17.09 ± 2.08Ab 18.44 ± 4.07Aa 29.14 ± 2.30Aa 82.54 ± 7.89Aa 147.20 ± 14.19Ab 0.78 ± 0.09Ba 4Al + H2S 21.37 ± 0.92Aa 17.90 ± 0.30Aa 31.47 ± 5.39Aa 101.06 ± 5.07Aa 171.80 ± 9.69Aa 0.70 ± 0.02Aa 4Al + PAG 14.61 ± 1.07Ab 13.16 ± 0.38Bb 33.98 ± 3.70Aa 67.89 ± 9.40Aa 129.63 ± 7.39Ab 0.93 ± 0.19ABa Mn 0.4Al 434.54 ± 49.93Bb 545.22 ± 57.44Ab 166.17 ± 11.21Ab 134.39 ± 12.51Cc 1280.32 ± 34.67Cc 8.60 ± 1.20Aa 0.4Al + H2S 331.68 ± 11.06Cb 877.57 ± 9.52Aa 344.66 ± 11.87Ba 754.57 ± 31.78Ab 2308.49 ± 11.48Bb 2.06 ± 0.12Bb 0.4Al + PAG 834.44 ± 114.52Aa 550.37 ± 95.76Ab 133.36 ± 16.66Ac 4346.17 ± 226.23ABa 5864.34 ± 188.71Aa 0.35 ± 0.03Bc 2Al 580.86 ± 12.29Ac 493.94 ± 29.55Ac 140.13 ± 9.00Bb 331.60 ± 27.71Bc 1546.53 ± 53.41Bc 3.68 ± 0.26Ba 2Al + H2S 725.34 ± 47.40Ab 812.18 ± 82.33Aa 441.12 ± 40.94Aa 700.79 ± 23.40Bb 2679.43 ± 33.48Ab 2.83 ± 0.08Ab 2Al + PAG 928.92 ± 45.21Aa 624.51 ± 22.29Ab 98.97 ± 8.63Ab 3967.98 ± 23.31Ba 5620.38 ± 56.40Aa 0.42 ± 0.01Ac 4Al 460.62 ± 66.33Bb 555.60 ± 64.32Ac 177.93 ± 12.21Ab 556.44 ± 62.27Ab 1750.59 ± 105.01Ab 2.16 ± 0.17Cb 4Al + H2S 628.13 ± 14.12Ba 689.53 ± 39.43Ba 276.52 ± 2.49Ca 555.42 ± 21.57Cb 2149.60 ± 47.85Cb 2.87 ± 0.16Aa 4Al + PAG 435.88 ± 72.96Bb 601.91 ± 11.98Aab 107.04 ± 23.12Ac 4802.02 ± 610.68Aa 5946.86 ± 651.79Aa 0.24 ± 0.02Cc Fe 0.4Al 83.08 ± 8.24Bc 228.98 ± 29.41Ab 116.78 ± 11.68Ab 212.67 ± 18.38Cc 641.51 ± 8.04Bc 2.03 ± 0.29Aa 0.4Al + H2S 142.21 ± 15.79Aa 399.33 ± 0.52Aa 292.37 ± 11.60Aa 401.46 ± 66.03Ab 1235.37 ± 78.04Ab 2.11 ± 0.34Aa 0.4Al + PAG 111.92 ± 8.22Bb 230.35 ± 33.40ABb 110.94 ± 14.25Ab 956.68 ± 72.57Aa 1409.89 ± 74.53Ba 0.48 ± 0.04Ab 2Al 147.45 ± 5.50Ab 207.06 ± 16.44Aa 122.89 ± 29.28Aa 702.60 ± 109.64Ab 1180.00 ± 150.22Ab 0.69 ± 0.07Ba 2Al + H2S 130.75 ± 8.31Ab 257.56 ± 31.45Ba 136.29 ± 7.22Ca 521.81 ± 202.62Ab 1046.41 ± 198.89Ab 1.13 ± 0.50Ba 2Al + PAG 216.42 ± 11.66Aa 266.43 ± 43.53Aa 110.46 ± 8.78Aa 1110.40 ± 18.95Aa 1703.70 ± 19.91Aa 0.53 ± 0.04Aa 4Al 134.64 ± 13.60Ab 208.35 ± 12.59Ab 105.13 ± 5.55Ab 534.53 ± 88.15Bb 982.65 ± 96.52Ab 0.85 ± 0.16Bb 4Al + H2S 145.29 ± 2.86Ab 270.95 ± 21.28Ba 201.43 ± 16.05Ba 368.04 ± 37.29Ab 985.70 ± 44.68Ab 1.69 ± 0.16ABa 4Al + PAG 230.61 ± 38.35Aa 163.31 ± 45.36Bb 103.44 ± 3.47Ab 944.38 ± 142.73Aa 1441.74 ± 137.29Ba 0.54 ± 0.14Ac Values are the mean ± SD (n = 3). Different lowercase letters represent significant differences among different H2S conditions under the same Al concentration treatment, and different uppercase letters represent significant differences among different Al concentration treatments under the same H2S condition (p < 0.05), as determined by the Duncan test. Table 3.
Effects on content and translocation factor (TF) of Ca, Mg, Zn, Mn, Fe in C. sinensis under different treatments.
-
Treatment GC
(%)EGC
(%)C
(%)EC
(%)EGCG
(%)ECG
(%)GCG
(%)Total catechins (%) 0.4Al 0.81 ± 0.03Aa 2.92 ± 0.41Aa 0.24 ± 0.00Ab 3.68 ± 0.42Ab 0.93 ± 0.09Ab 0.38 ± 0.01Aa 0.62 ± 0.06Ab 9.81 ± 1.00Aa 0.4Al + H2S 0.80 ± 0.01Aa 2.91 ± 0.06Aa 0.248 ± 0.00Aa 4.30 ± 0.17Aa 1.11 ± 0.04Aa 0.39 ± 0.00Aa 0.73 ± 0.01Aa 10.74 ± 0.16Aa 0.4Al + PAG 0.82 ± 0.01Aa 2.44 ± 0.22Aa 0.25 ± 0.00Aa 3.95 ± 0.13Aab 0.94 ± 0.05Ab 0.37 ± 0.01Ab 0.59 ± 0.04Ab 9.61 ± 0.23Aa 2Al 0.76 ± 0.01Ba 2.30 ± 0.35Aa 0.24 ± 0.00Aa 3.44 ± 0.29Aa 0.92 ± 0.05Aa 0.37 ± 0.01Aa 0.60 ± 0.04Aa 9.41 ± 1.30Aa 2Al + H2S 0.79 ± 0.02Aa 2.80 ± 0.40Aa 0.24 ± 0.01Ba 3.35 ± 0.64Ba 1.00 ± 0.15ABa 0.37 ± 0.01Ba 0.62 ± 0.07Ba 8.91 ± 0.76ABa 2Al + PAG 0.76 ± 0.04Ba 2.58 ± 0.31Aa 0.24 ± 0.00Ba 3.76 ± 0.62Aa 1.06 ± 0.17Aa 0.38 ± 0.01Aa 0.67 ± 0.09Aa 9.91 ± 1.19Aa 4Al 0.75 ± 0.02Ba 2.31 ± 0.45Aab 0.24 ± 0.01Aa 3.59 ± 0.81Aab 0.96 ± 0.11Ab 0.37 ± 0.01Aa 0.57 ± 0.06Ab 7.82 ± 0.03Aab 4Al + H2S 0.77 ± 0.02Aa 2.11 ± 0.09Bb 0.23 ± 0.00Bb 2.75 ± 0.04Bb 0.82 ± 0.03Bb 0.36 ± 0.00Ca 0.53 ± 0.01Bb 8.95 ± 1.57Bb 4Al + PAG 0.76 ± 0.01Ba 2.80 ± 0.32Aa 0.25 ± 0.00Aa 4.11 ± 0.51Aa 1.16 ± 0.11Aa 0.33 ± 0.00Bb 0.70 ± 0.04Aa 10.26 ± 0.99Aa Data are mean values ± SD (n = 3). Different lowercase letters represent significant differences among different H2S conditions under the same Al concentration treatment, and different uppercase letters represent significant differences among different Al concentration treatments under the same H2S condition (p < 0.05), as determined by the Duncan test. Table 4.
Effect of different treatments on catechins in C. sinensis.
Figures
(10)
Tables
(4)