-

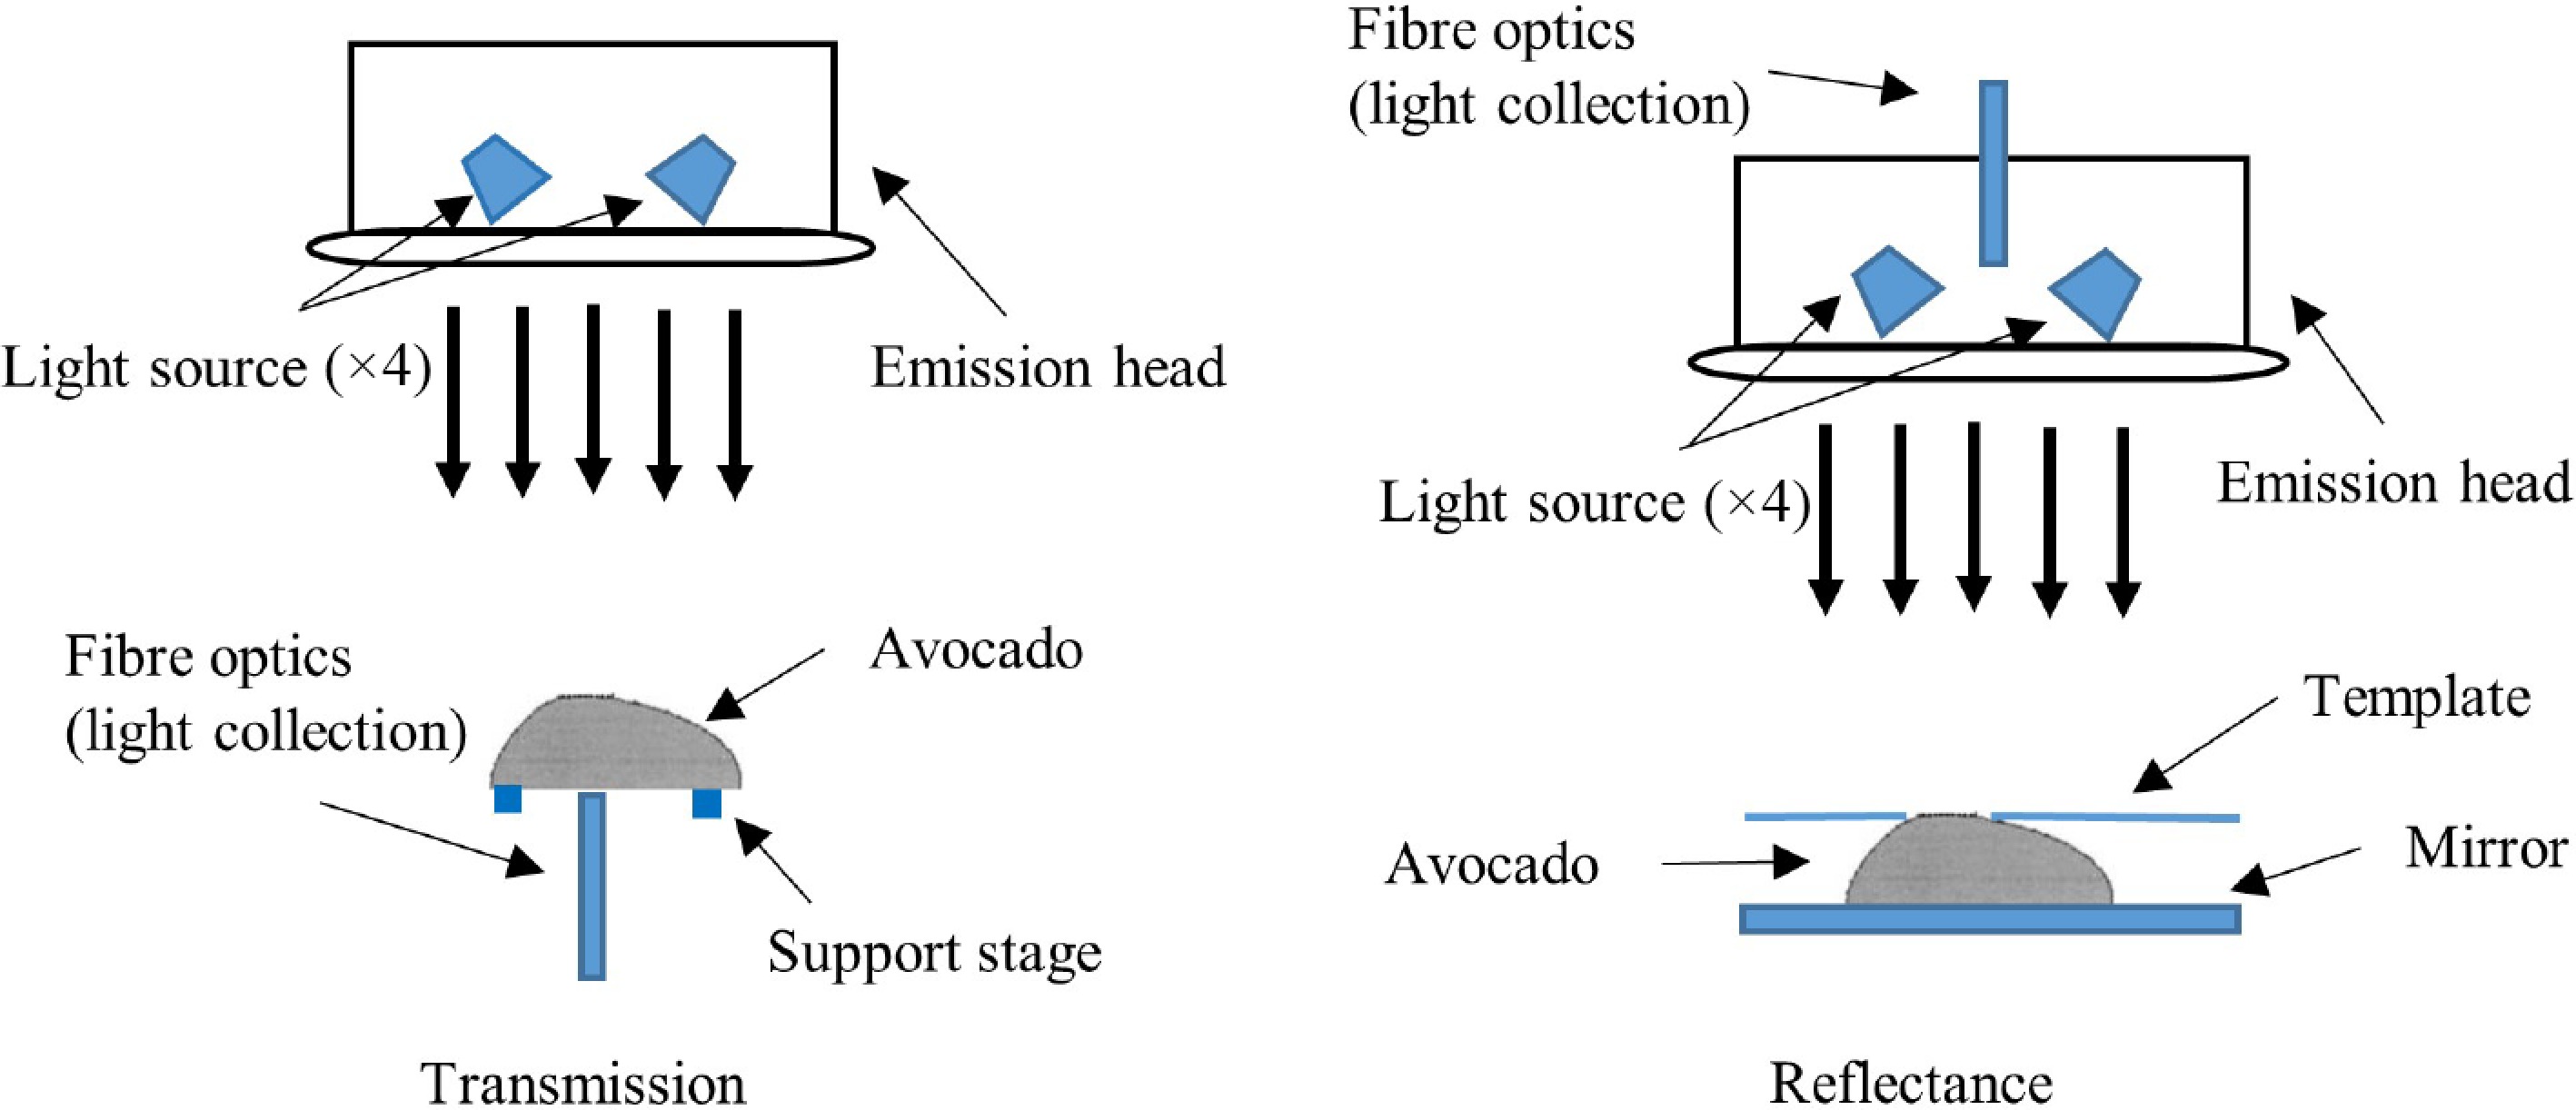
Figure 1.
Schematic of reflectance and transmission measurement configurations.
-

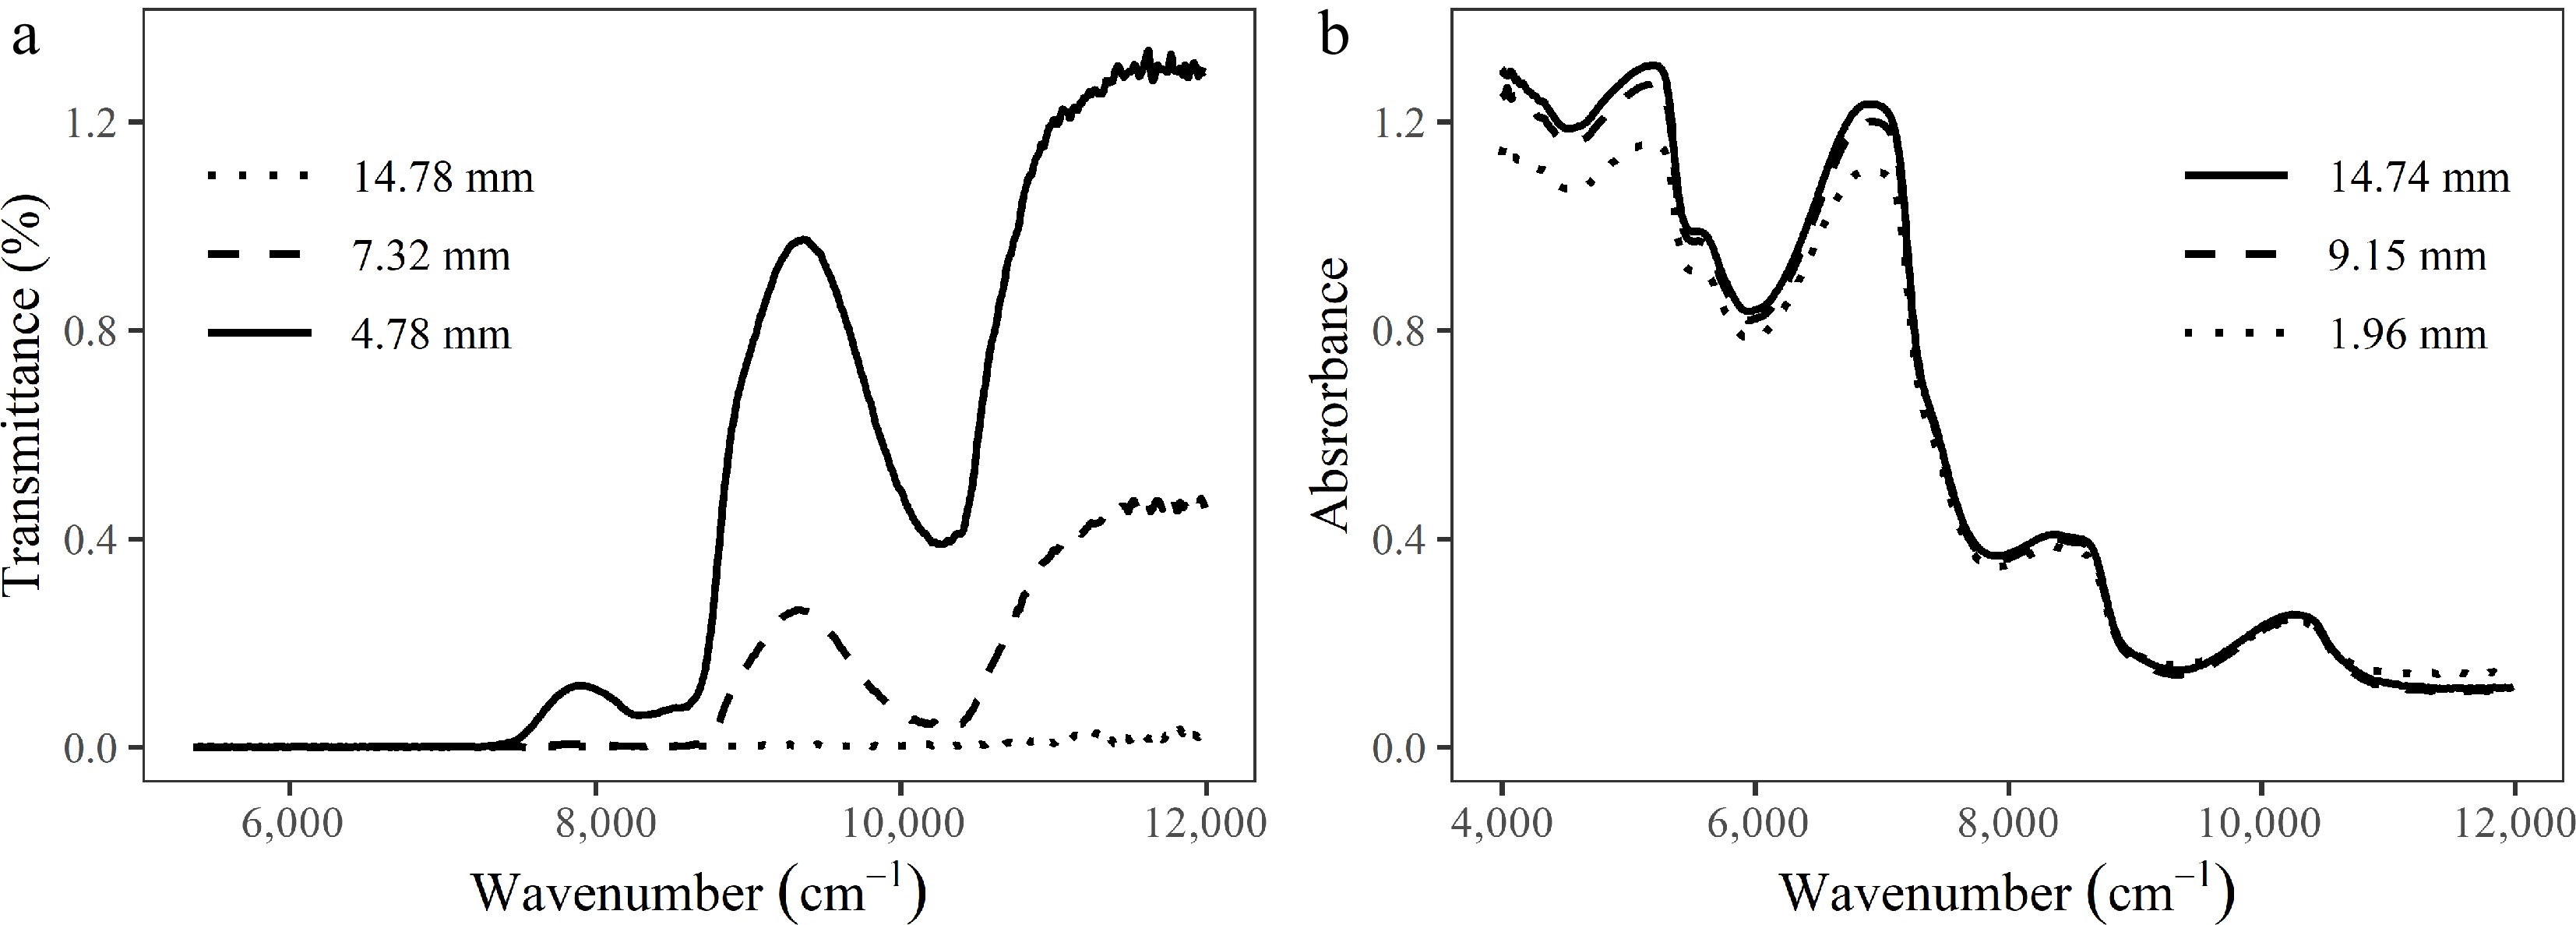
Figure 2.
(a) Typical transmission and (b) reflectance spectra for an avocado at varying thicknesses.
-

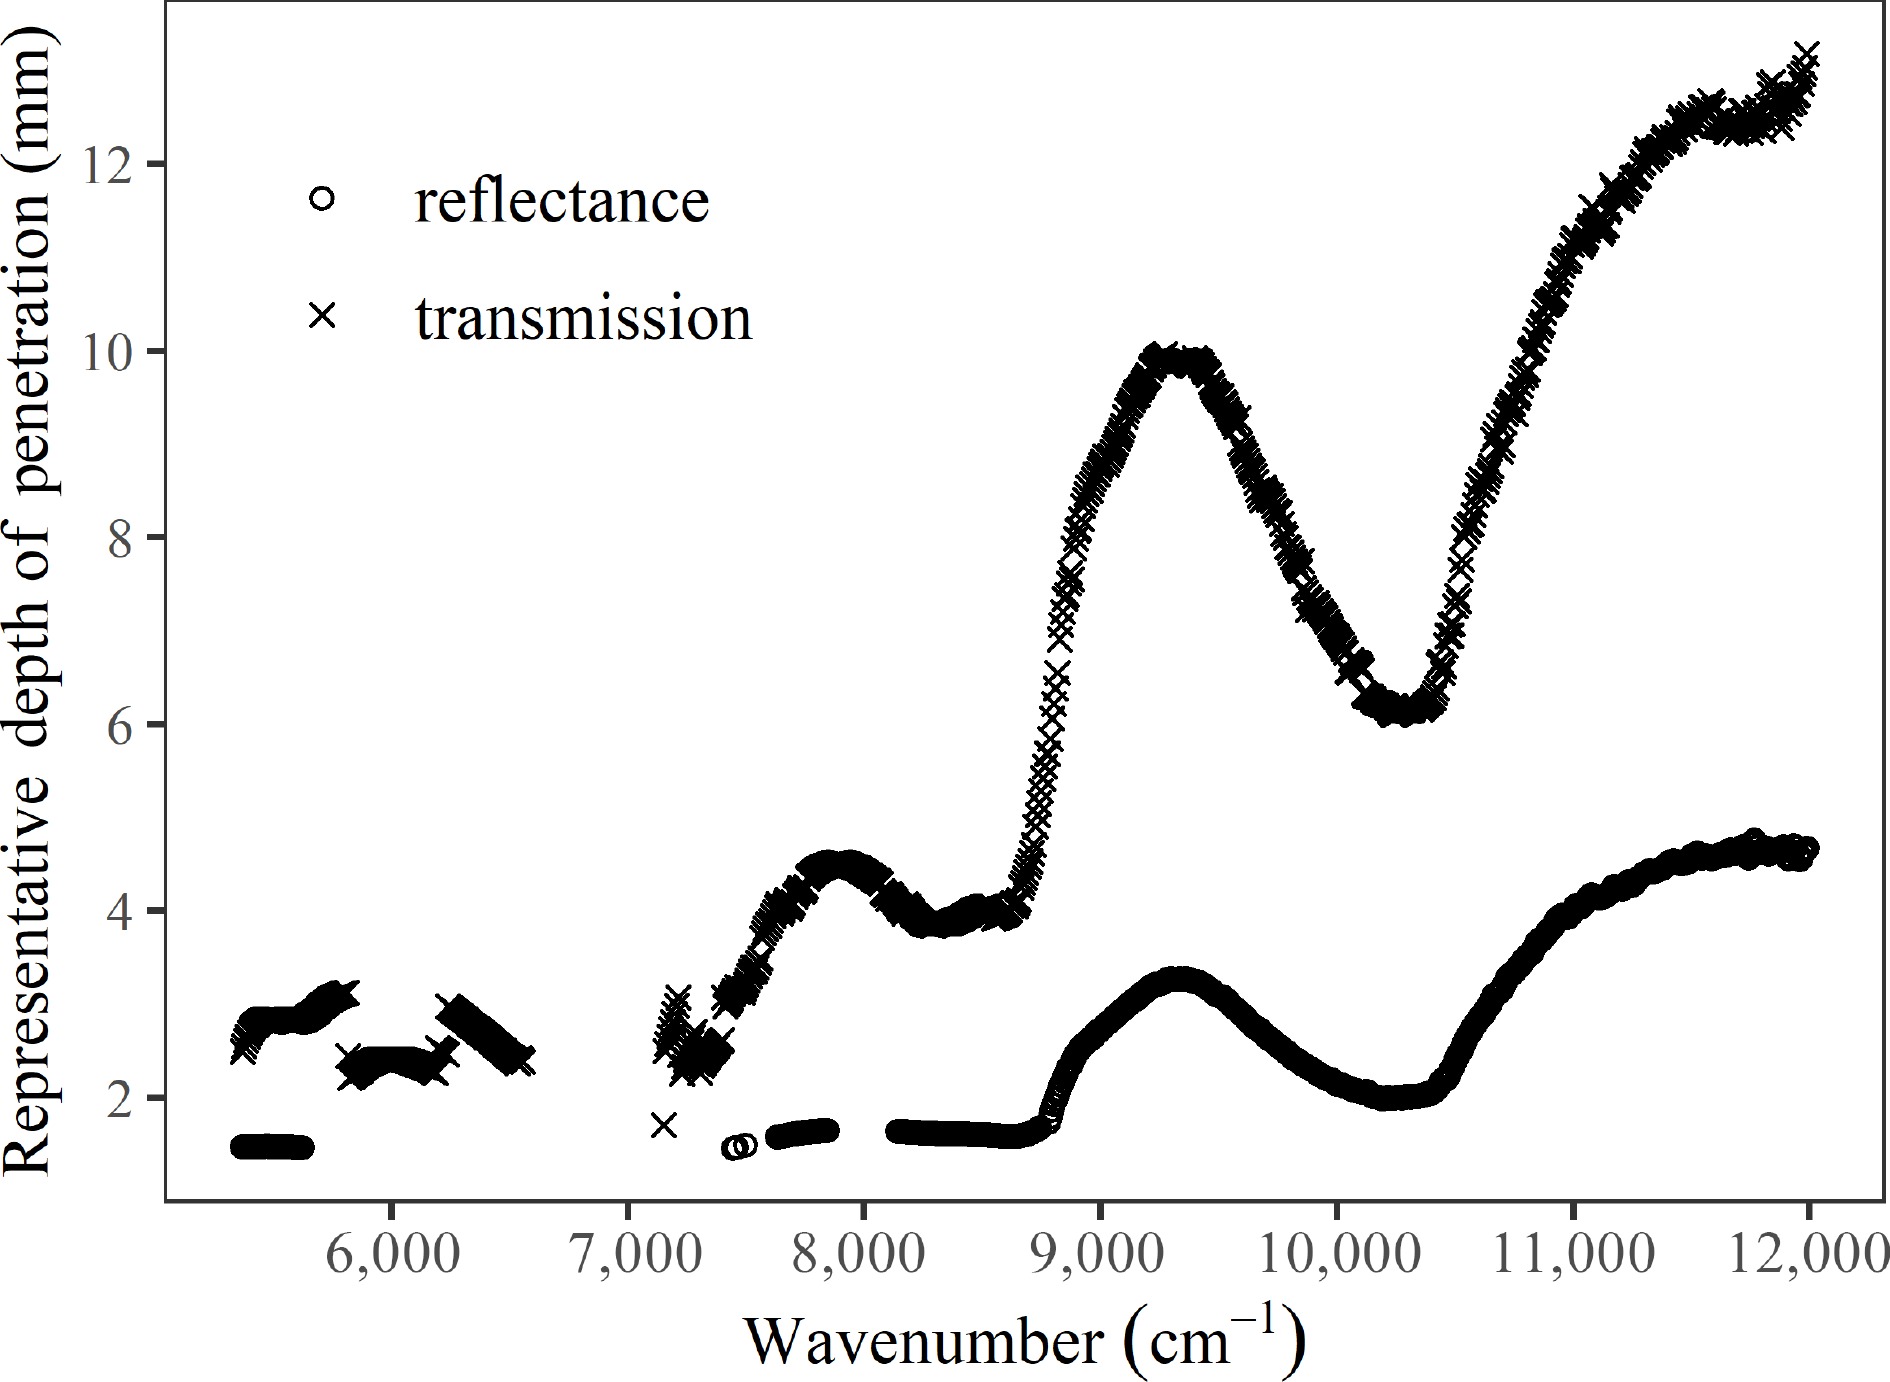
Figure 3.
The representative depth of penetration for each wavelength for both transmission and reflectance modes in avocado fruit.
-

Figure 4.
Variation of g(λ,θ) for various wavelengths, and the associated estimate of the penetration depth (↓) for reflectance mode.
Figures
(4)
Tables
(0)