-
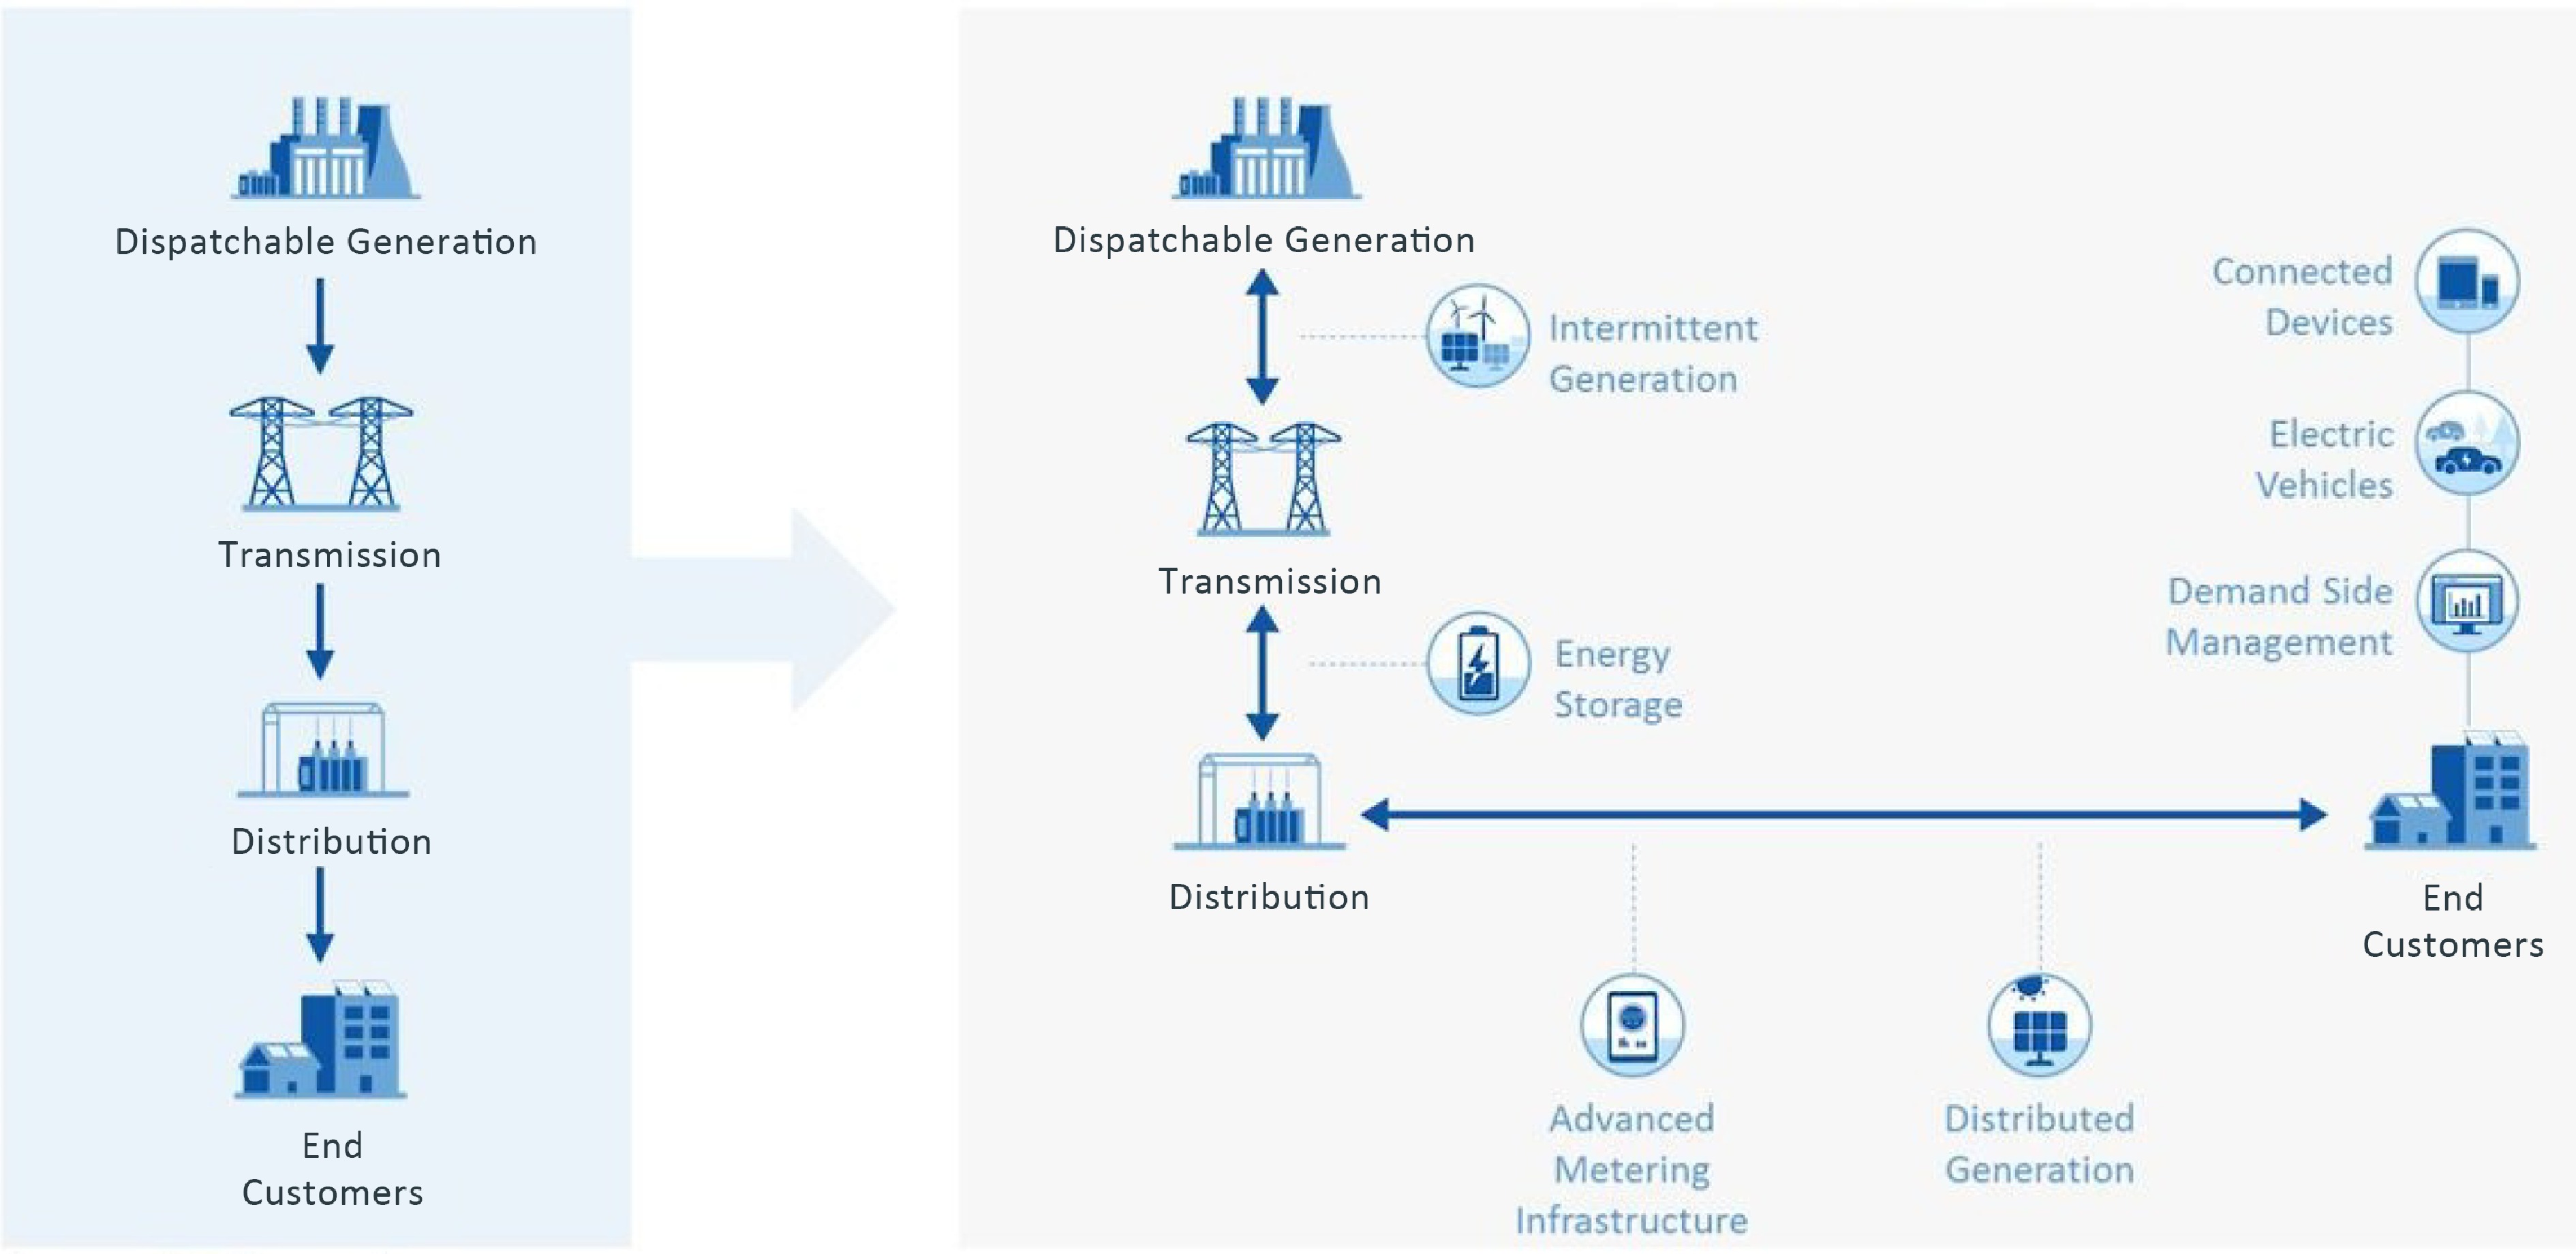
Figure 1.
Contrasting grid models: On the left, the traditional centralized electricity grid; on the right, the evolving decentralized grid showcasing microgrids, nanogrids, and smart grids[80].
-
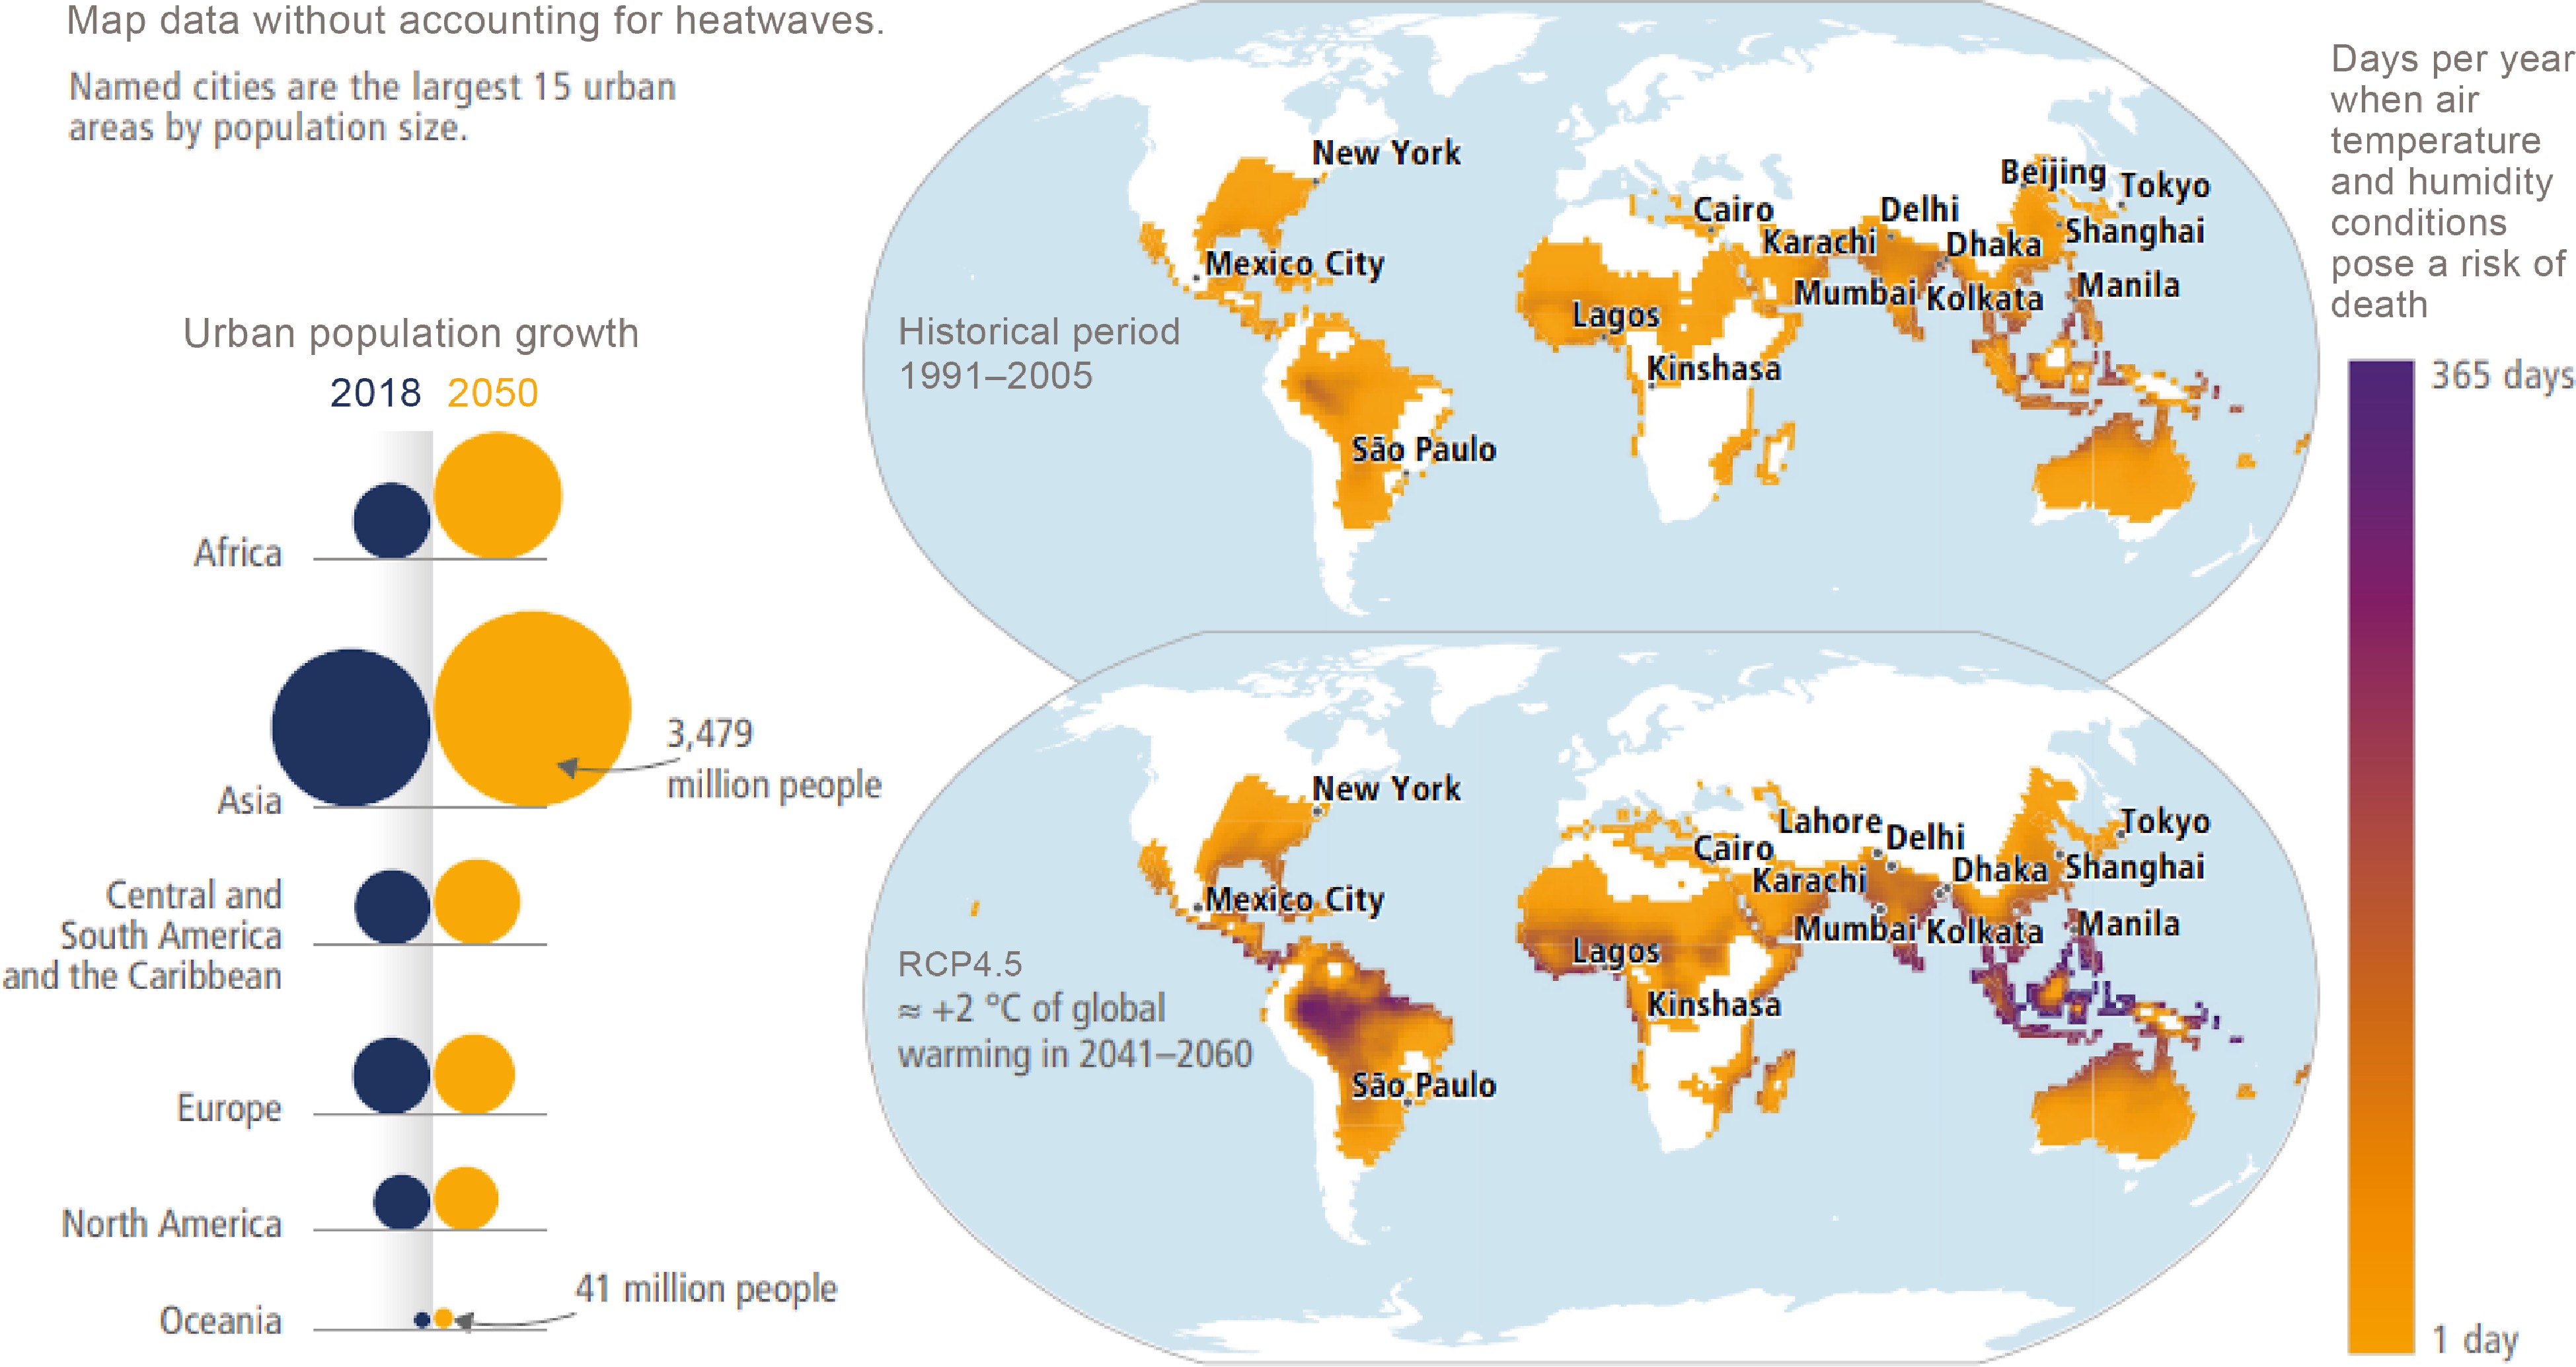
Figure 2.
Population exposed to lethal climatic conditions from extreme temperatures and humidity. The top panel depicts the historical era (1991–2005), while the bottom panel illustrates the RCP4.5 scenario (2041–2060) under 2 °C global warming. RCP (Representative Concentration Pathway) scenarios, utilized in conjunction with CMIP5 (Coupled Model Intercomparison Project Phase 5)[11], offer insights into potential climate impacts on societies[90].
-
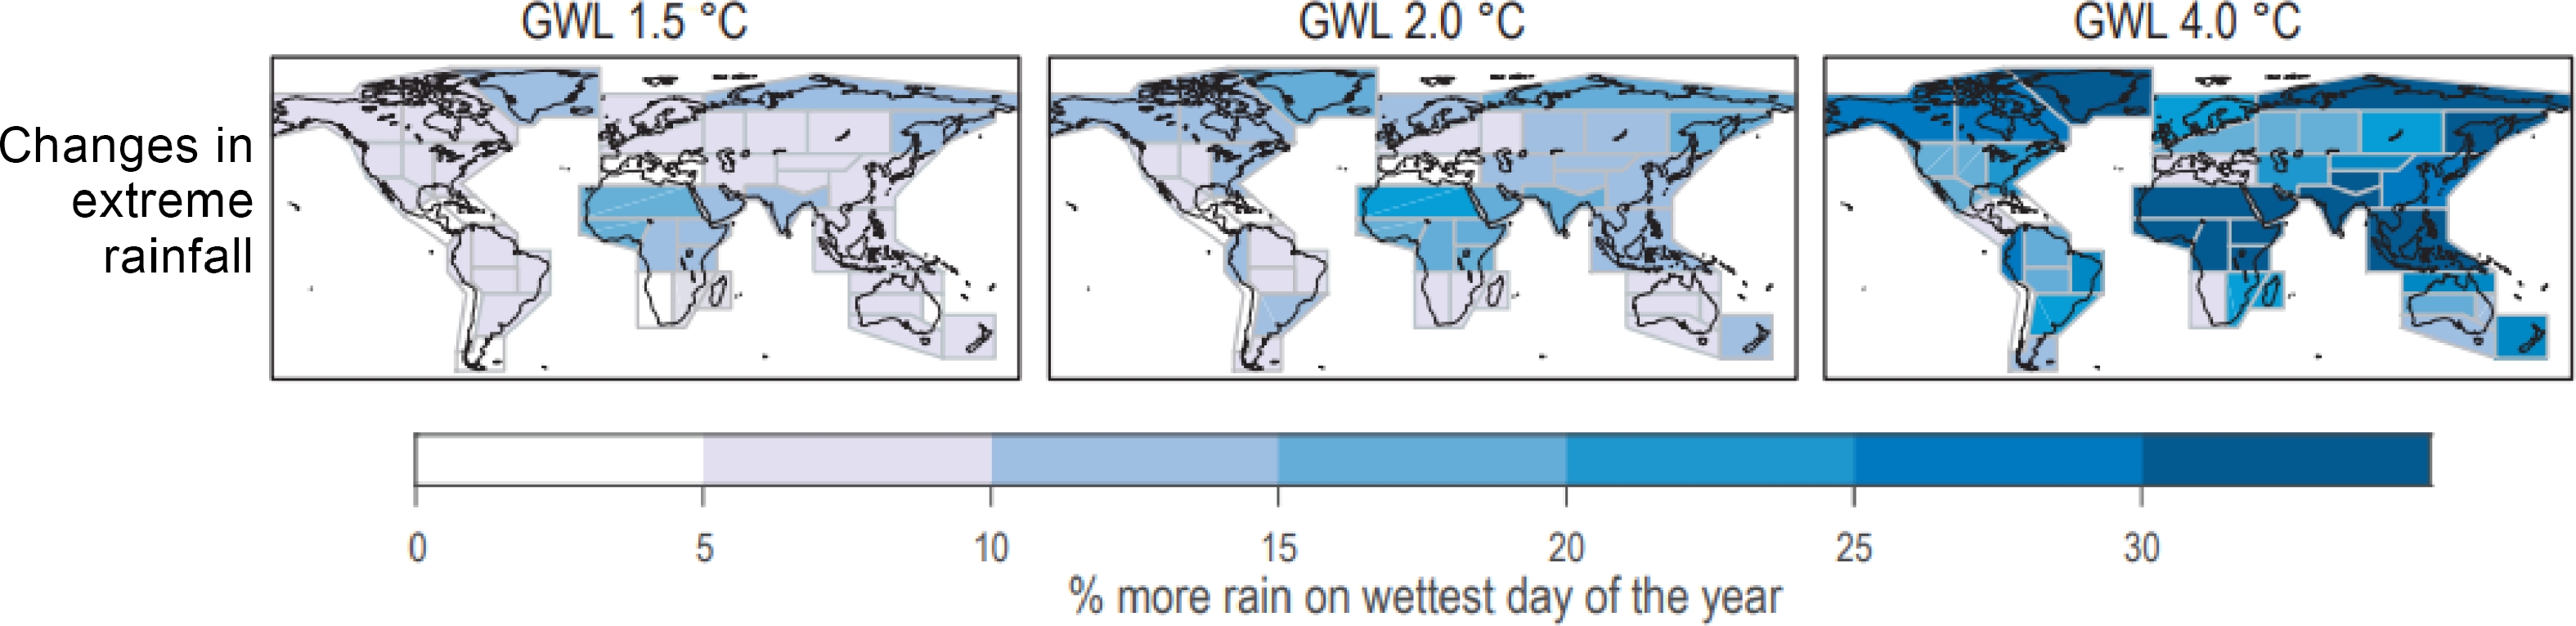
Figure 3.
Maps depicting CMIP6 (Coupled Model Intercomparison Project Phase 6) median projections of extreme rainfall changes across AR6 (6th Assessment Report) land regions at varying global warming levels (GWLs) of 1.5, 2, and 4 °C. It provides insights into potential future precipitation patterns in response to different warming scenarios[91].
-
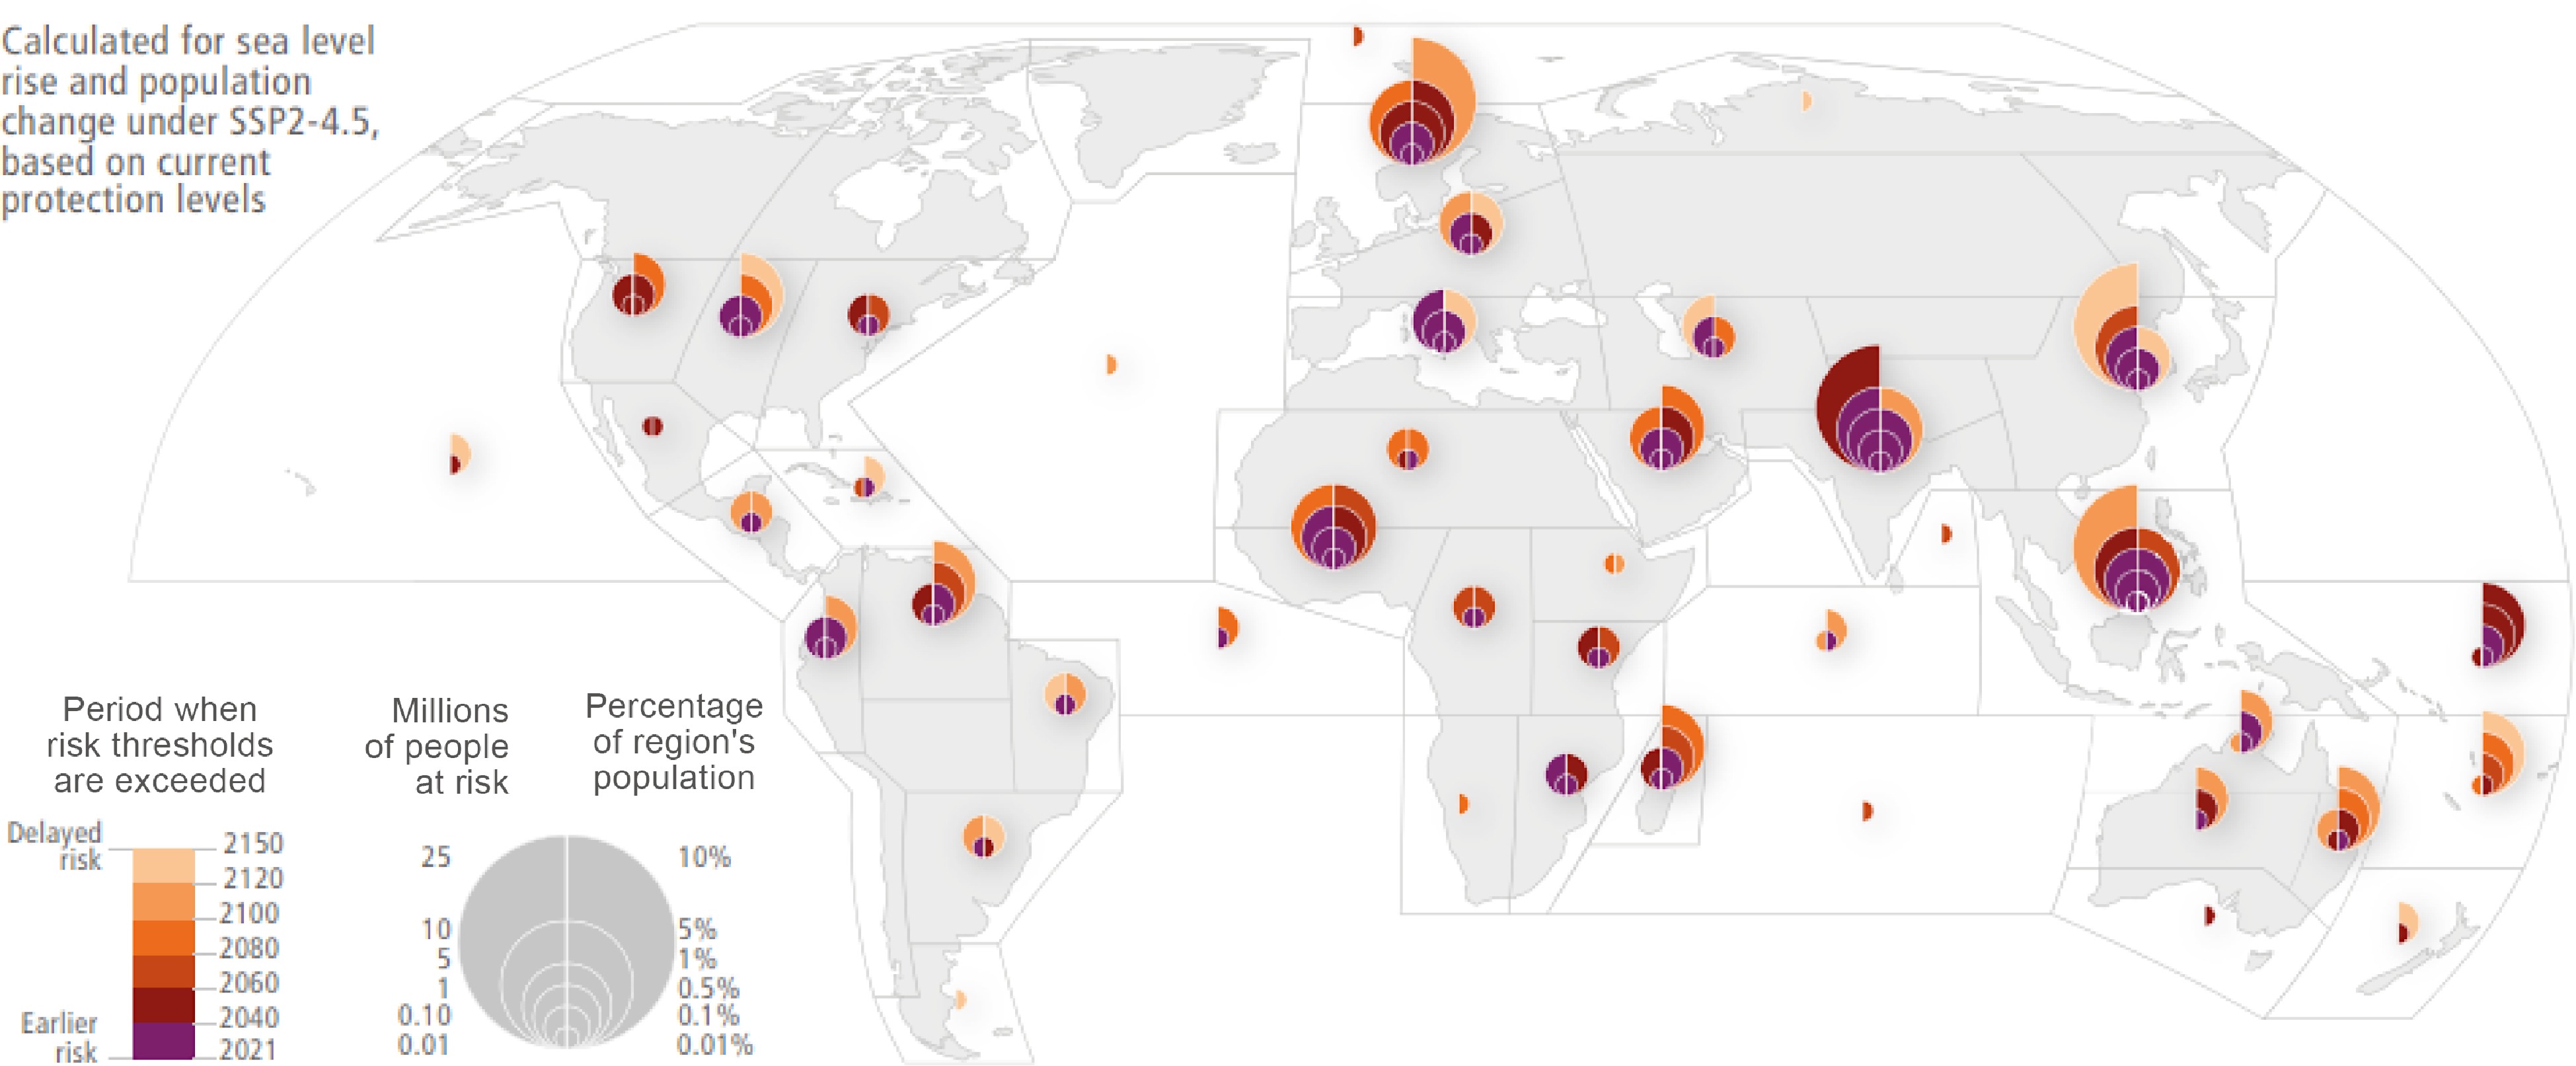
Figure 4.
Mapping future coastal flood risk (i.e., sea level rise): projected population vulnerability to a 100-year event, under the Shared Socioeconomic Pathway 2−4.5, which represents a scenario where the world takes moderate mitigation and adaptation efforts. The 4.5 indicates radiative forcing levels by the year 2100, measured in Watts per square meter. This scenario is used in conjunction with CMIP6 (Coupled Model Intercomparison Project Phase 6) climate models to explore potential climate outcomes and societal responses)[11,90].
-
Criteria C1 C2 C3 C4 C5 C6 C7 C8 C9 C1 1 5 7 7 5 3 5 7 5 C2 $\dfrac{1}{5}$ 1 3 5 3 2 3 5 3 C3 $\dfrac{1}{7}$ $\dfrac{1}{3}$ 1 3 2 1 3 3 2 C4 $\dfrac{1}{7}$ $\dfrac{1}{5}$ $\dfrac{1}{3}$ 1 3 1 3 5 3 C5 $\dfrac{1}{5}$ $\dfrac{1}{3}$ $\dfrac{1}{2}$ $\dfrac{1}{3}$ 1 1 3 3 3 C6 $\dfrac{1}{3}$ $\dfrac{1}{2}$ 1 1 1 1 3 3 2 C7 $\dfrac{1}{5}$ $\dfrac{1}{3}$ $\dfrac{1}{3}$ $\dfrac{1}{3}$ $\dfrac{1}{3}$ $\dfrac{1}{3}$ 1 3 3 C8 $\dfrac{1}{7}$ $\dfrac{1}{5}$ $\dfrac{1}{3}$ $\dfrac{1}{5}$ $\dfrac{1}{3}$ $\dfrac{1}{3}$ $\dfrac{1}{5}$ 1 3 C9 $\dfrac{1}{5}$ $\dfrac{1}{3}$ $\dfrac{1}{2}$ $\dfrac{1}{3}$ $\dfrac{1}{3}$ $\dfrac{1}{2}$ $\dfrac{1}{3}$ $\dfrac{1}{3}$ 1 (C1) Effectiveness, resilience enhancement, and risk reduction; (C2) Scalability, flexibility, and long-term sustainability; (C3) Resource availability, cost-effectiveness, and ease of implementation; (C4) Integration with other existing or planned strategies; (C5) Community engagement and stakeholder acceptance; (C6) environmental impact; (C7) Technological maturity; (C8) Regulatory and policy compliance; (C9) education and training—when assessing strategies for mitigating and adapting to natural hazards in microgrids. We use a rating scale ranging from 1 to 9, where 1 indicates equal importance and 9 represents significantly greater importance. It's important to recognize that this assessment is subjective and may vary based on individual perspectives and preferences. Table 1.
Pairwise comparison matrix for criteria evaluation.
-
Criteria Relative weights (RWs) Effectiveness, resilience enhancement, and risk reduction (C1) 28.1% Scalability, flexibility, and long-term sustainability (C2) 12.7% Resource availability, cost-effectiveness, and ease of implementation (C3) 7.8% Integration with other strategies (C4) 11.7% Community engagement (C5) 10.2% Environmental impact (C6) 6.0% Technological maturity (C7) 13.9% Regulatory and policy compliance (C8) 4.2% Education and training (C9) 5.3% Table 2.
Criterion weights (CWs) delineate the relative importance assigned to each criterion in the evaluation of strategies aimed at mitigating and adapting to natural hazards within microgrids. These weights provide clarity on the respective significance of each criterion in influencing the overall effectiveness of the available options.
-
Alternatives Weighted sum Site selection 1.935 Redundancy 1.776 Hardening infrastructure 1.999 Emergency procedures 1.732 Vegetation management 0.899 Real-time monitoring 1.738 Flexible operations 1.780 Distributed generation 2.102 Battery storage 1.740 Demand response 1.963 Community engagement 1.531 Scenario planning 1.802 Collaboration 1.677 Climate-resilient technologies 1.743 Regular maintenance 1.522 Artificial intelligence 1.978 Table 3.
Combined weighted ratings for each alternative. Higher weighted sums indicate enhanced overall performance.
Figures
(4)
Tables
(3)