-
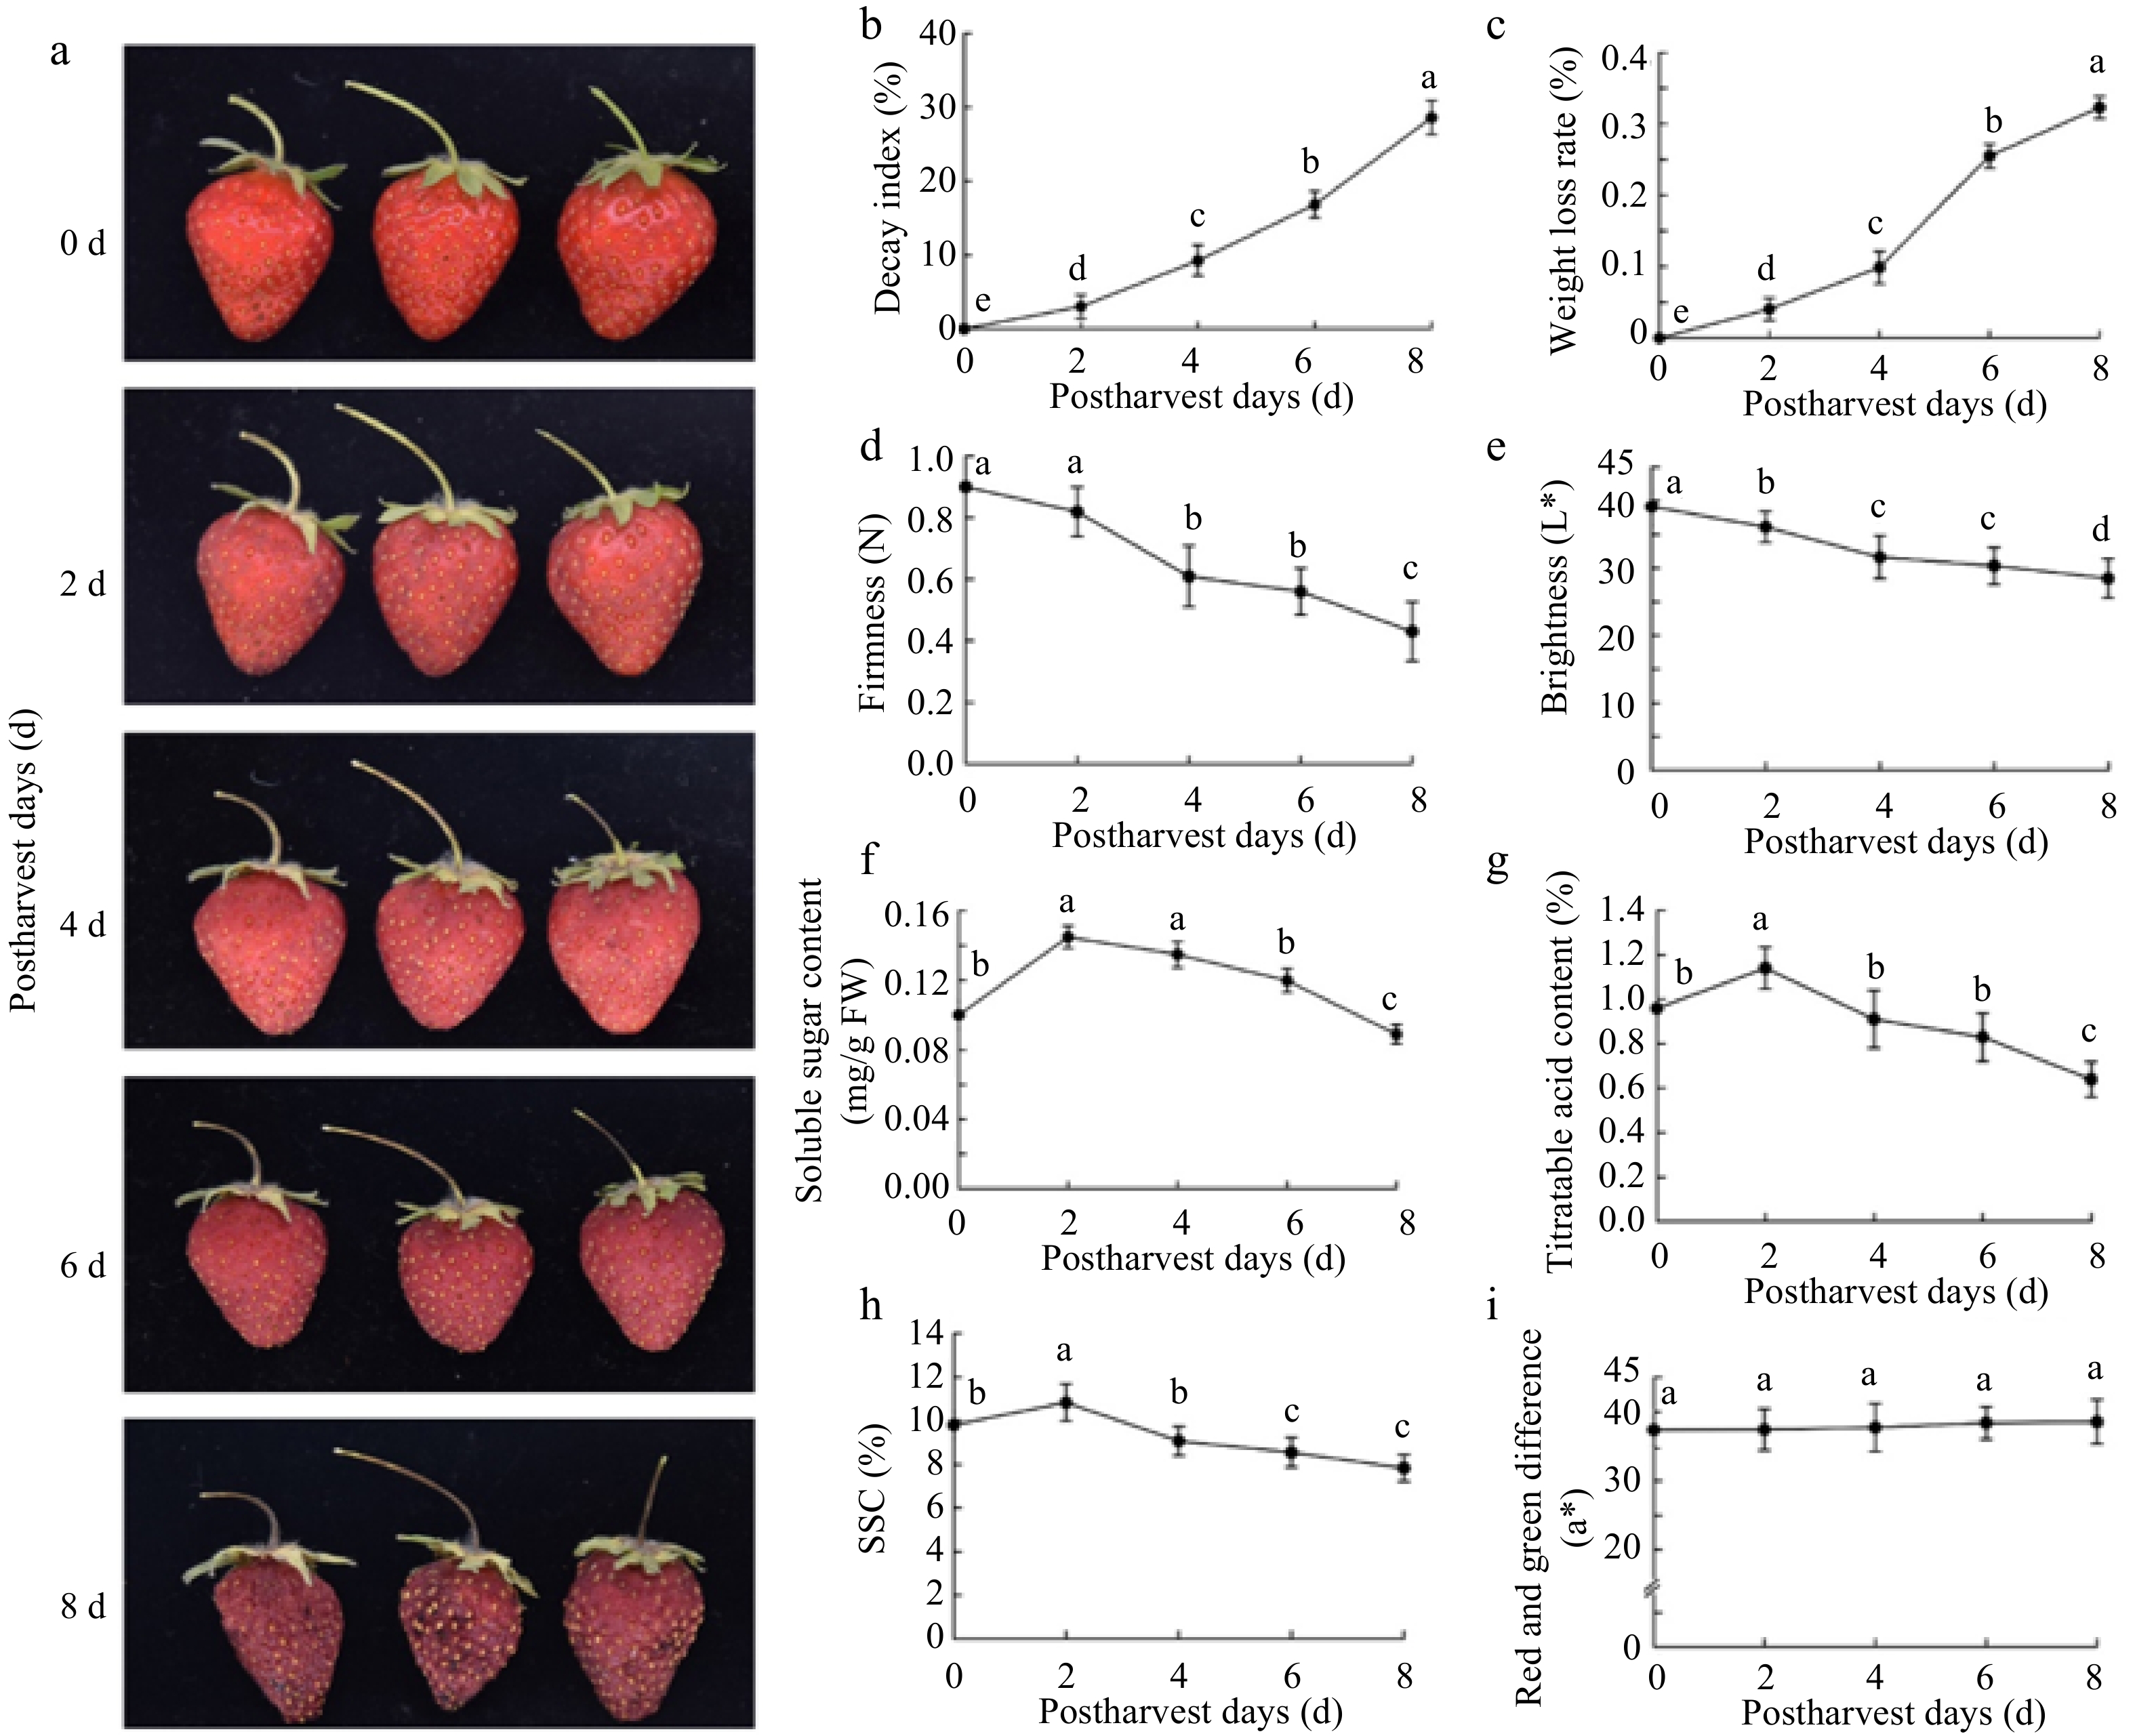
Figure 1.
Morphological and physiological changes of the strawberry fruit at room temperature during 0−8 d storage. The parameters include, (a) external morphological changes, (b) decay index, (c) weight loss rate, (d) hardness, (e) brightness, (f) soluble sugar content, (g) titratable acid content, (h) soluble solid content, and (i) red and green difference. The error bars represent the standard error (n = 3). For each storage day, different letters above lines indicate significant differences according to Duncan's multiple range test, at p < 0.05.
-
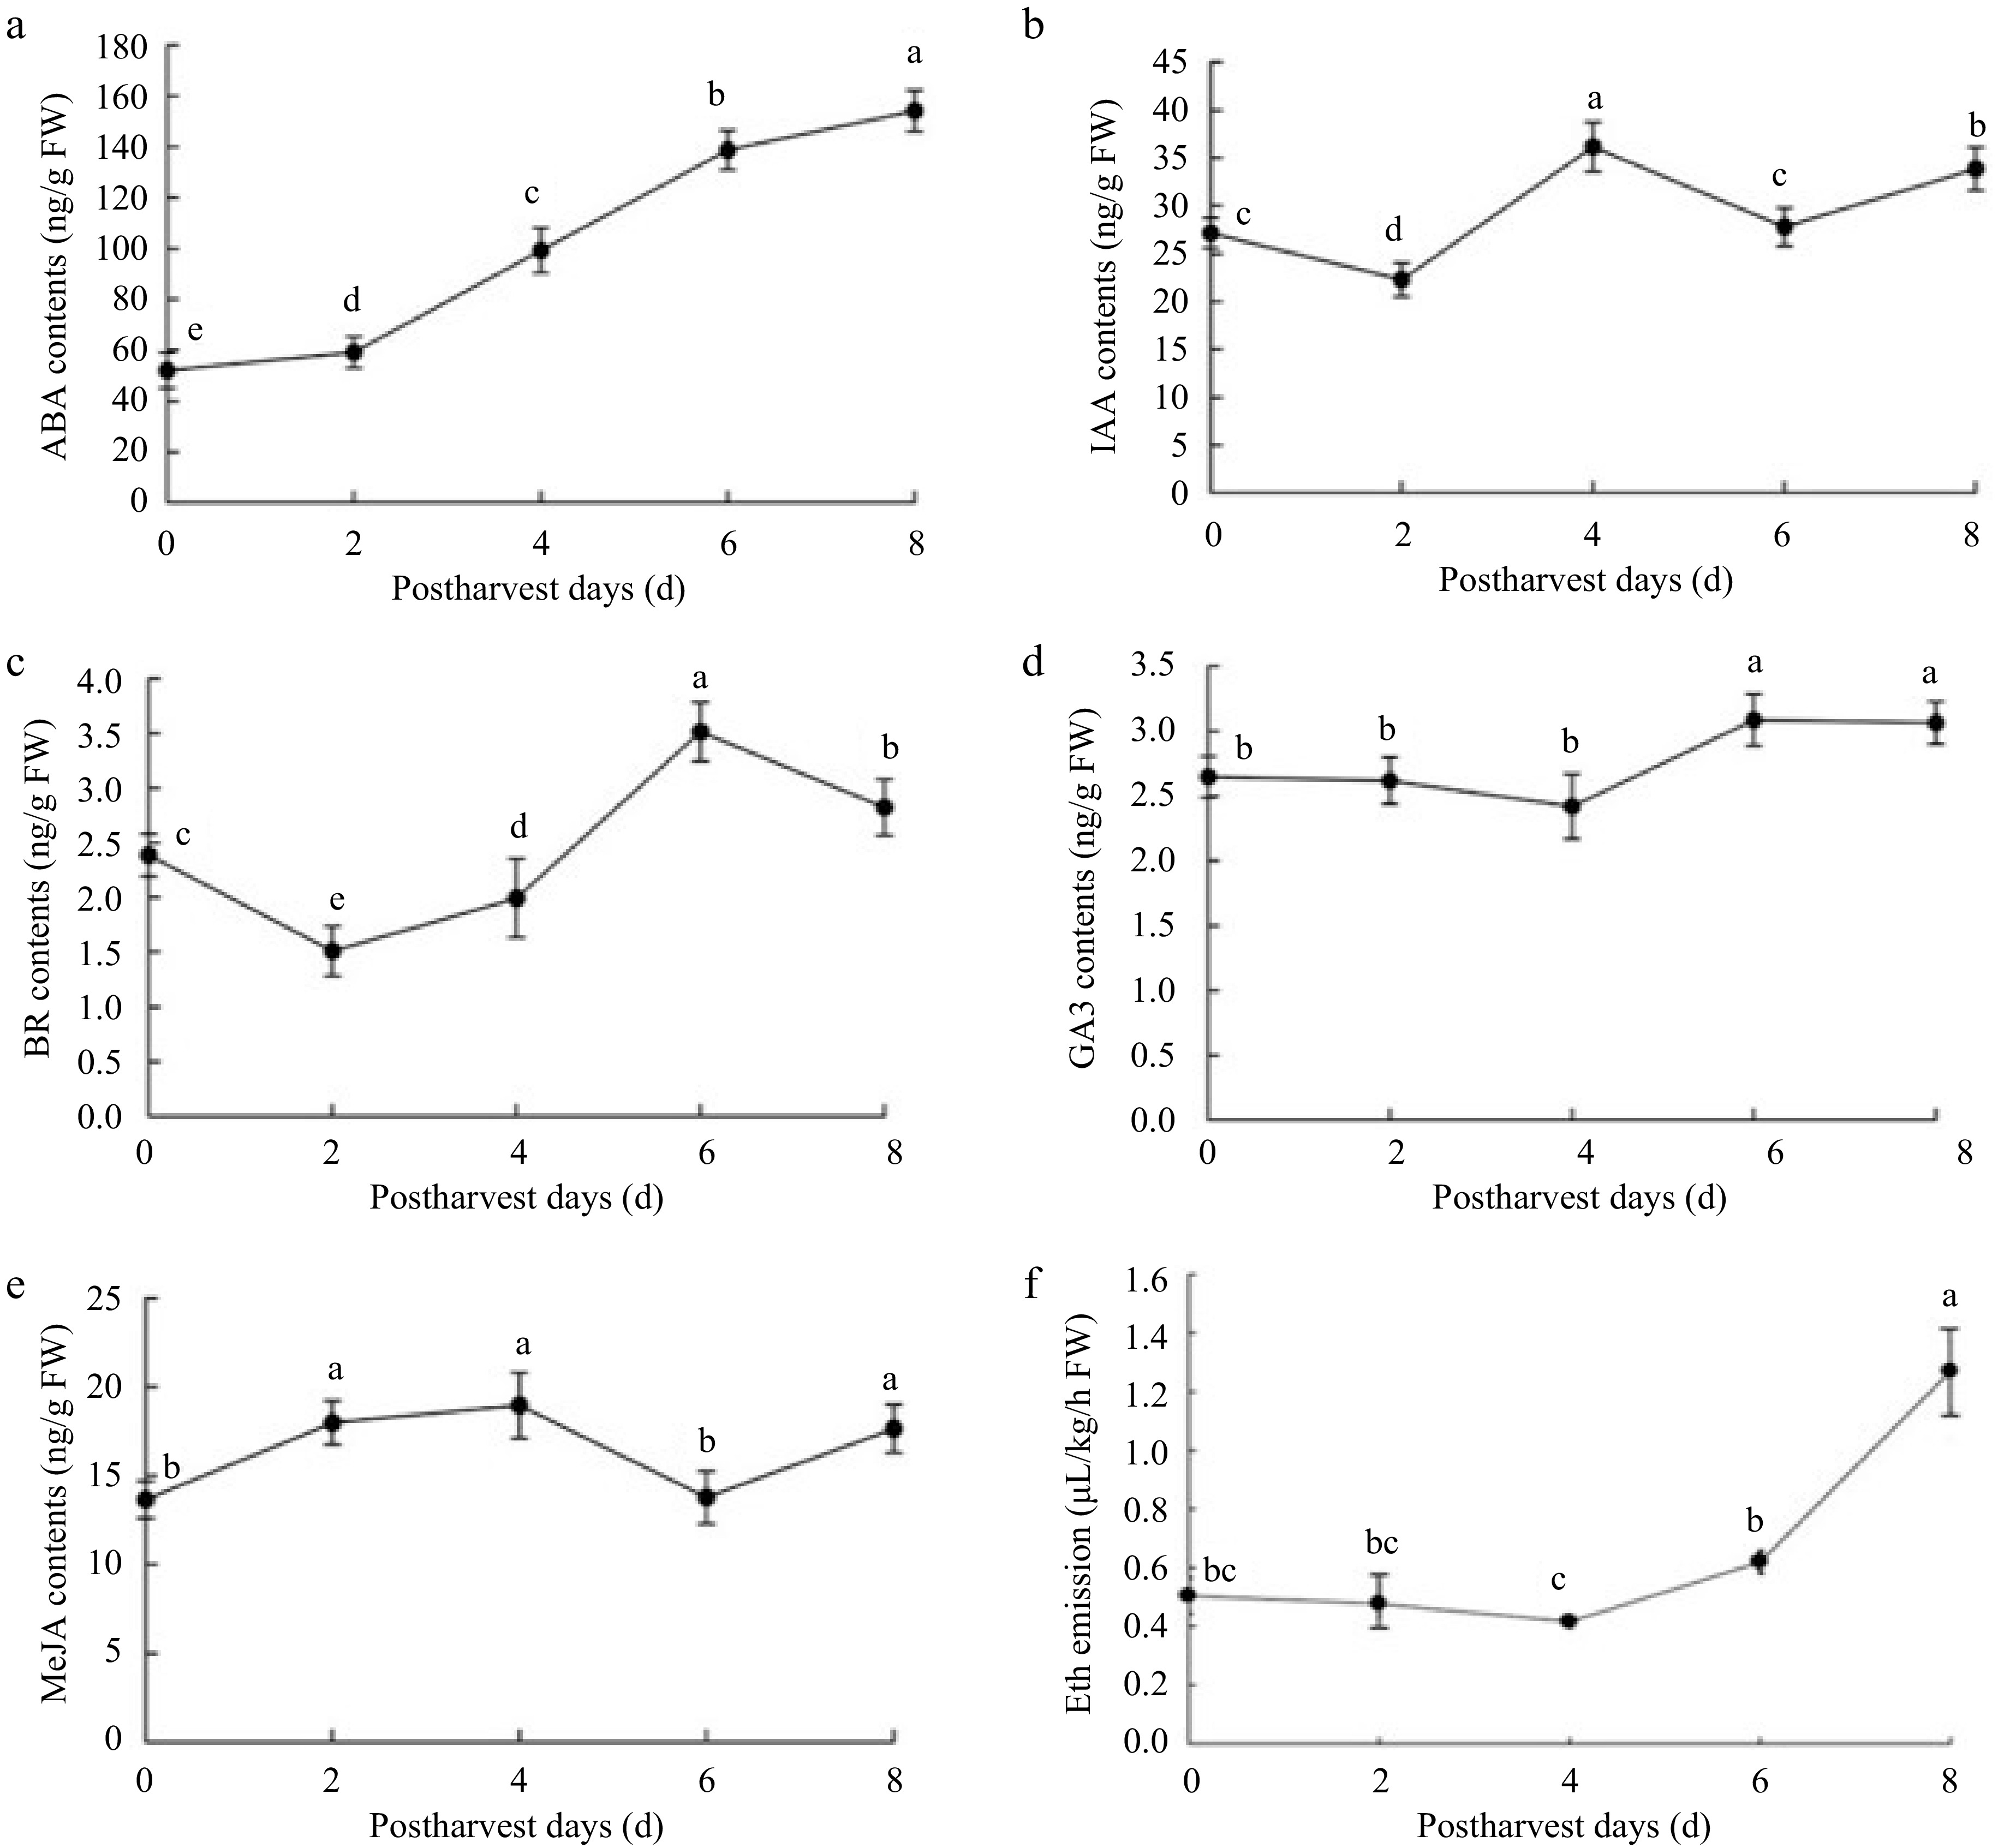
Figure 2.
Hormonal concentration changes in strawberry fruit at room temperature during 0−8 d storage. The parameters included (a) abscisic acid (ABA), (b) indole acetic acid (IAA), (c) brassinolide (BR), (d) gibberellic acid (GA3), (e) MeJA, (f) ethylene (Eth). The error bars represent the standard error (n = 3). For each postharvest day, different letters above lines indicate significant differences according to Duncan's multiple range test, at p < 0.05.
-
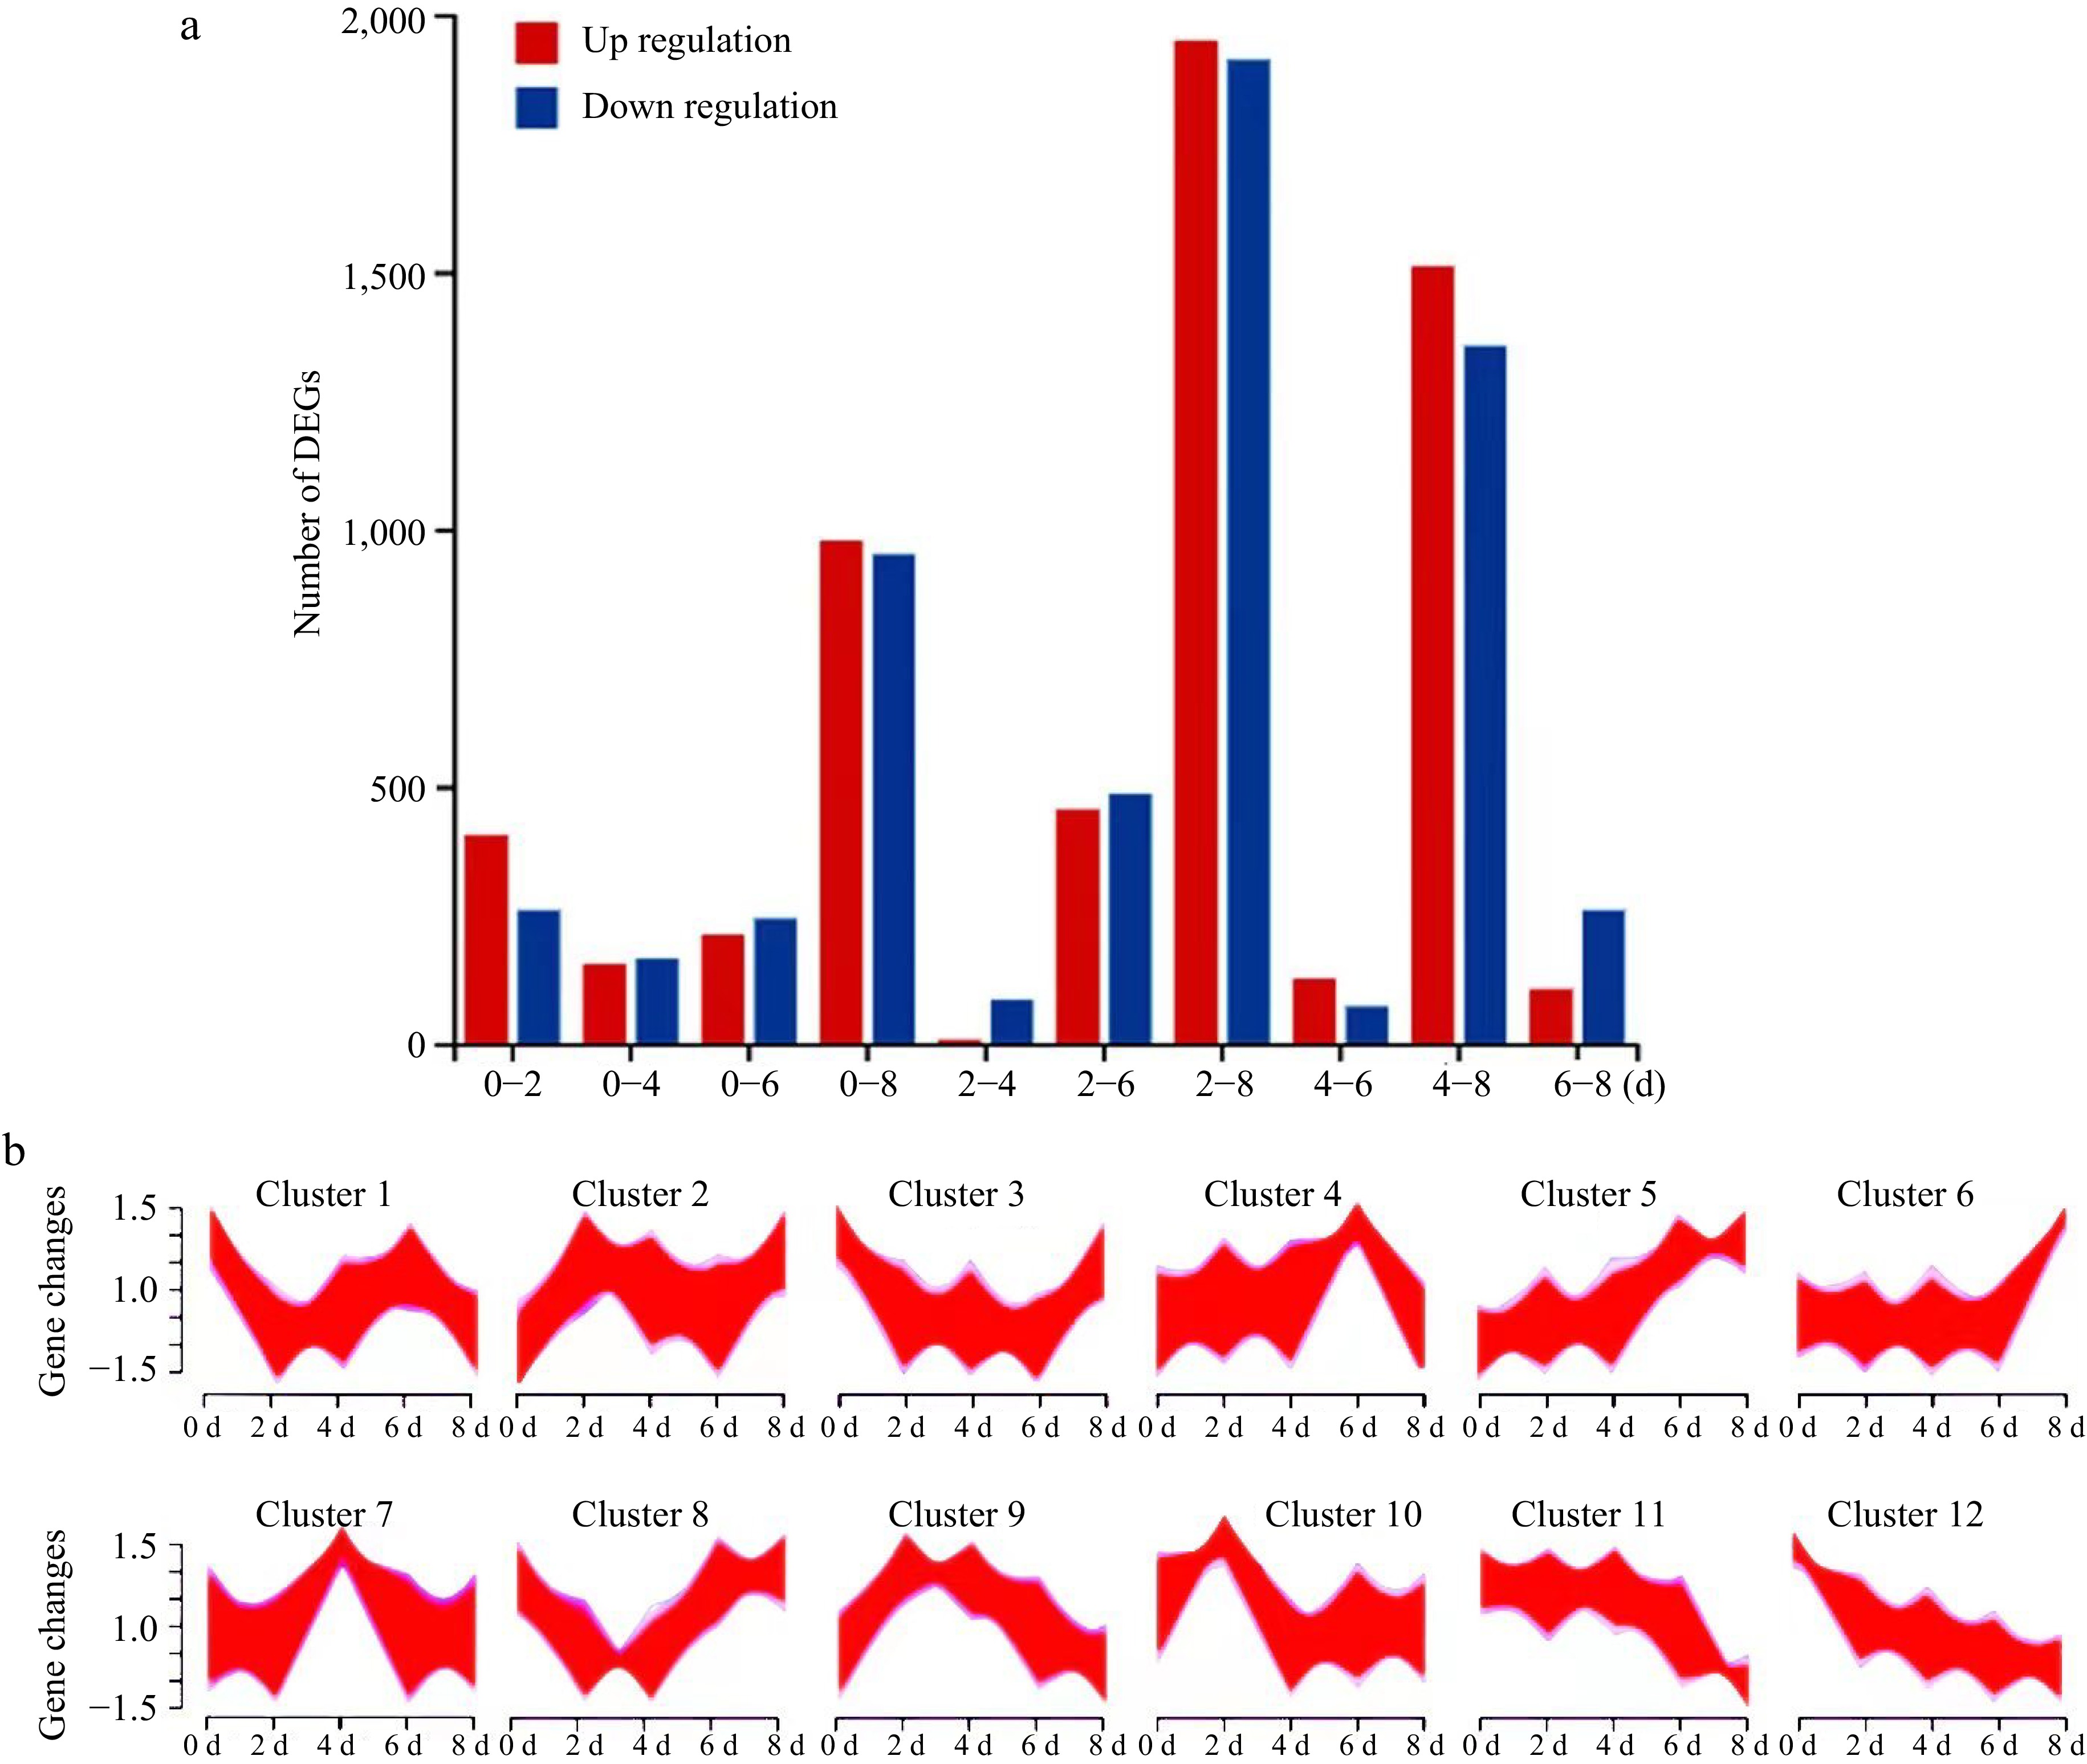
Figure 3.
The numbers and clusters of DGEs in strawberry fruit over time at room temperature during 0−8 d storage. (a) DGEs by pair comparison. The '0−2' represents DGEs by pair comparison between 0-d identified proteins and 2-d identified proteins, and so on for 0−4, 0−6, and 0−8 DGEs by pair comparison. The '0−2' represents DGEs by pair comparison between 0-d unigenes and 2-d unigenes, and so on for 0−4, 0−6, 0−8, 2−4, 2−6, 2−8, 4−6, 4−8, and 6−8. (b) DGE clusters over time. DGEs: differentially expressed genes.
-
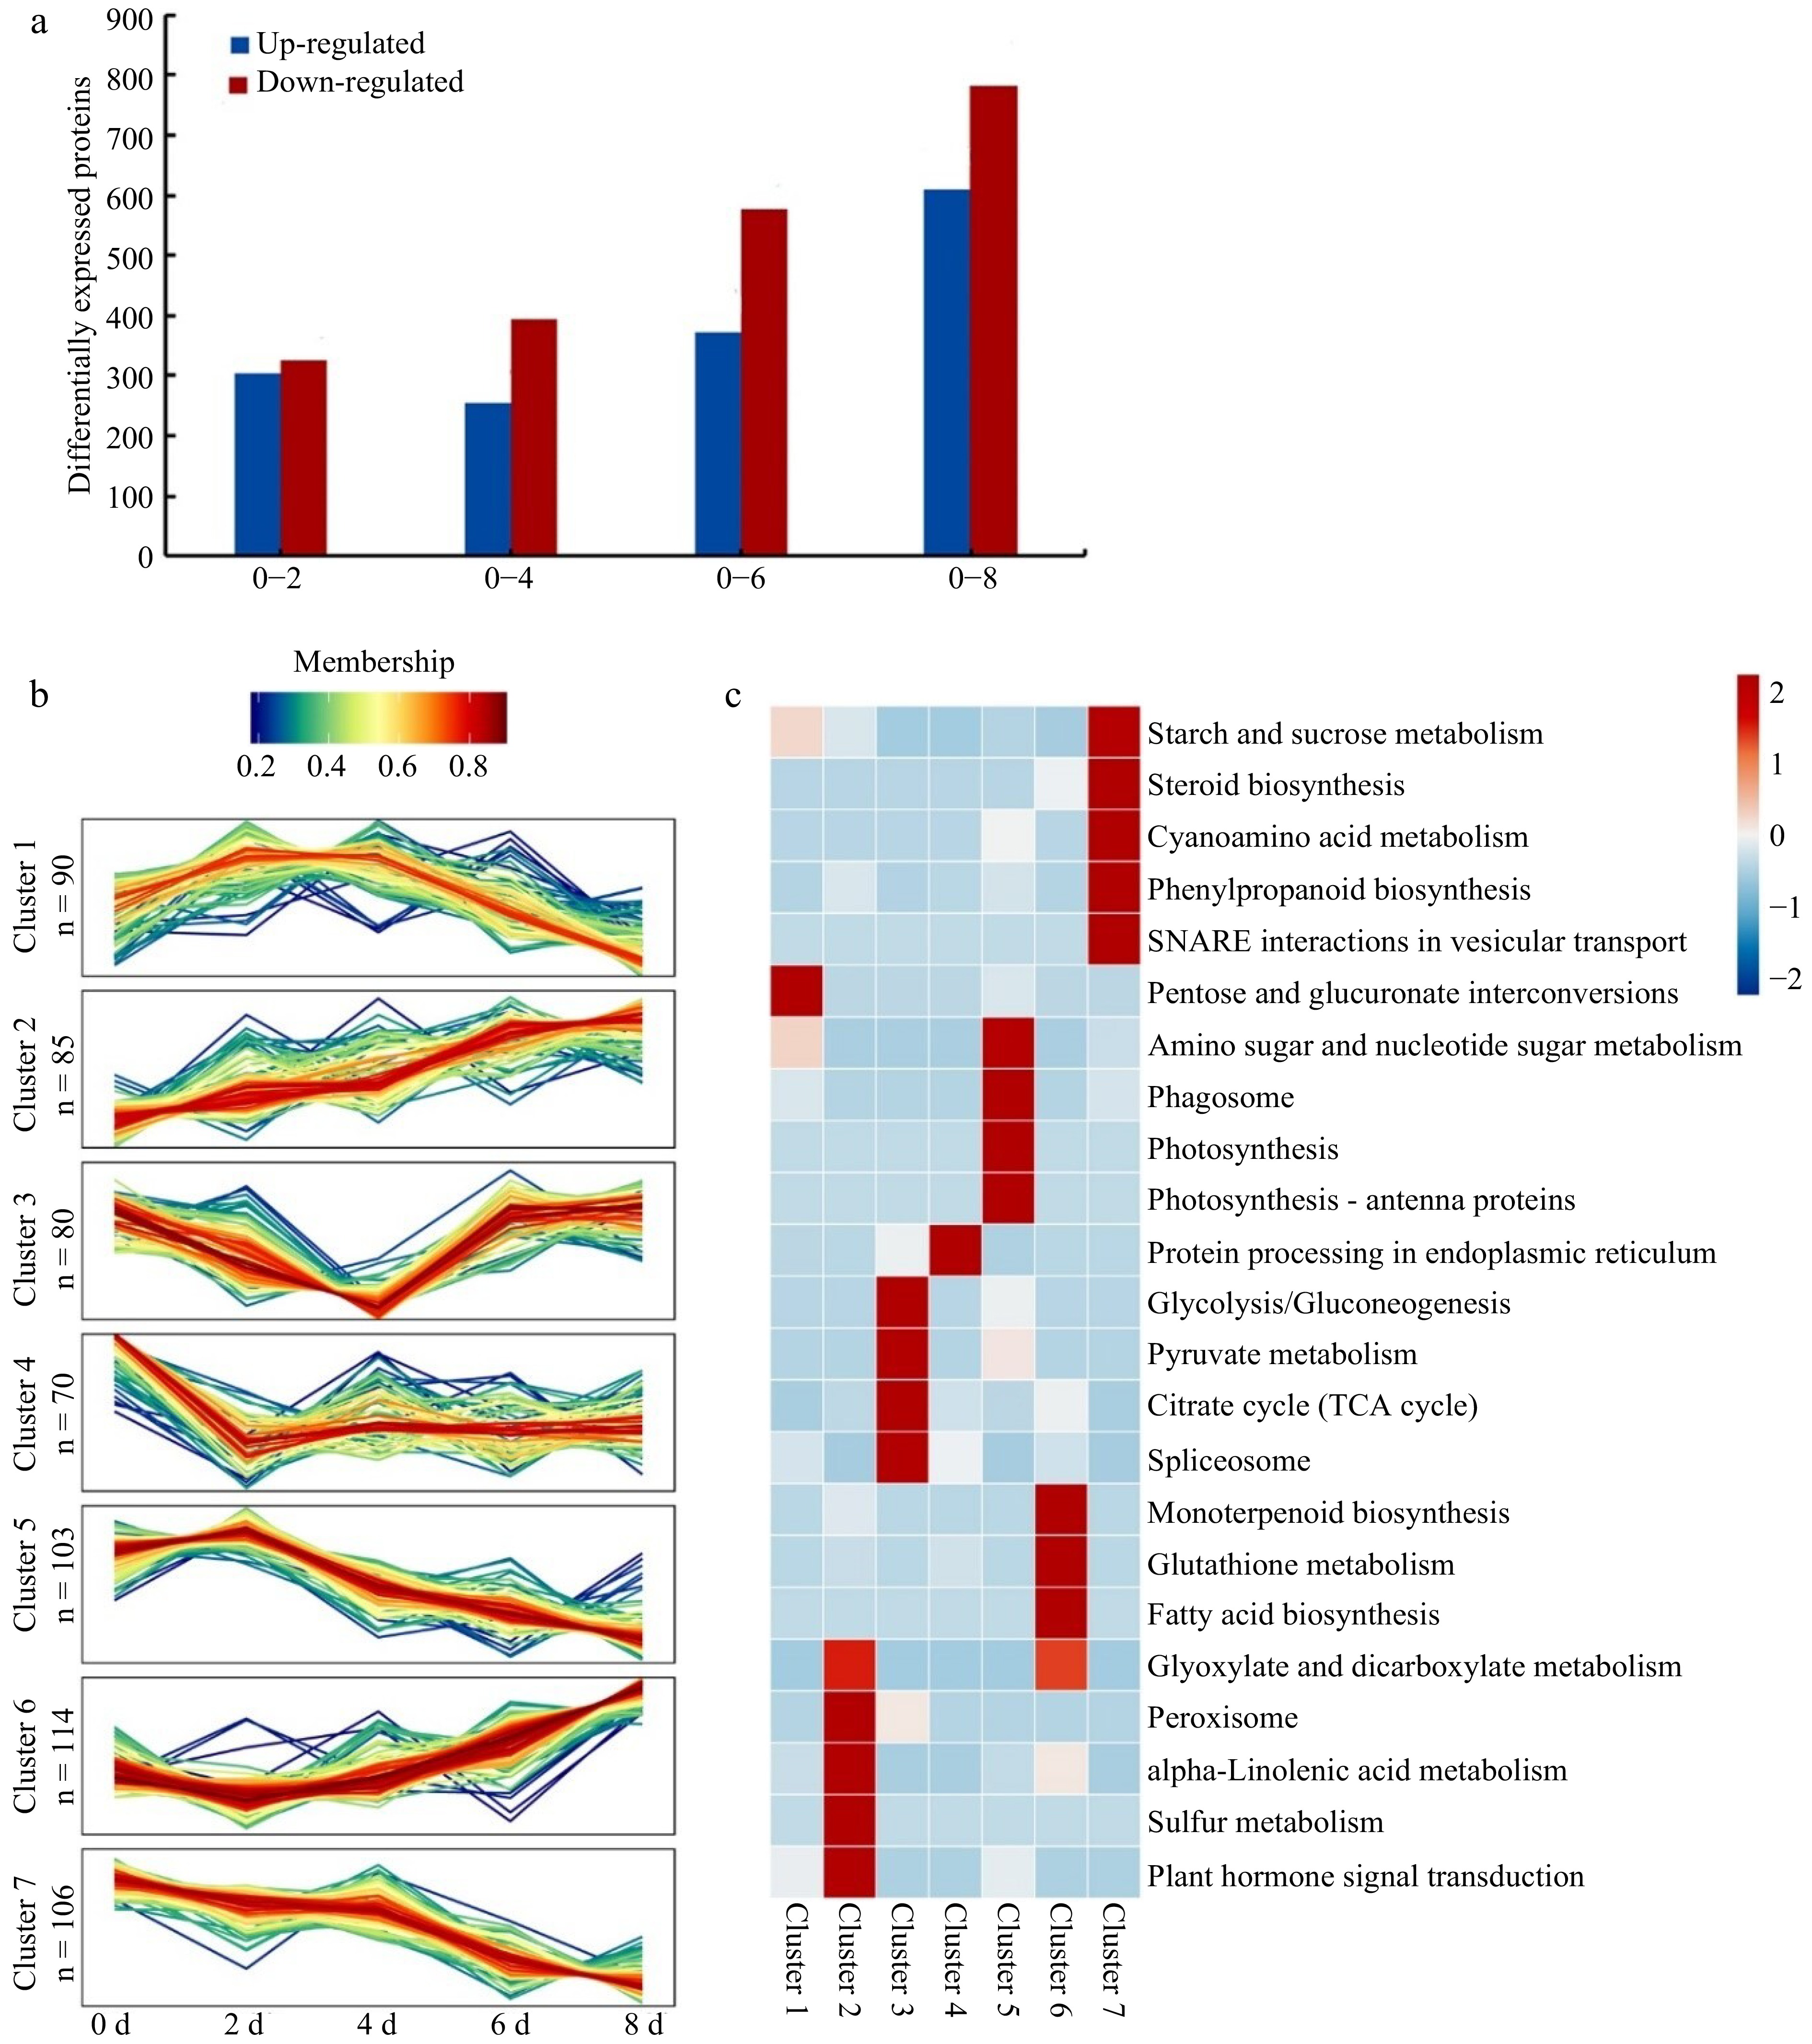
Figure 4.
The numbers, pathways and clusters of DEPs in strawberry fruit over time at room temperature during 0−8 d storage. (a) Differentially expressed proteins (DEPs) by pair comparison. The '0−2' represents DEPs by pair comparison between 0-d identified proteins and 2-d identified proteins, and so on for 0−4, 0−6, and 0−8. (b) The DGP clusters and highlighting pathways over time. DEPs: differentially expressed proteins. The n represents the numbers of DGPs in a cluster. (c) Enrichment of differentially expressed protein cluster KEGG pathway.
-
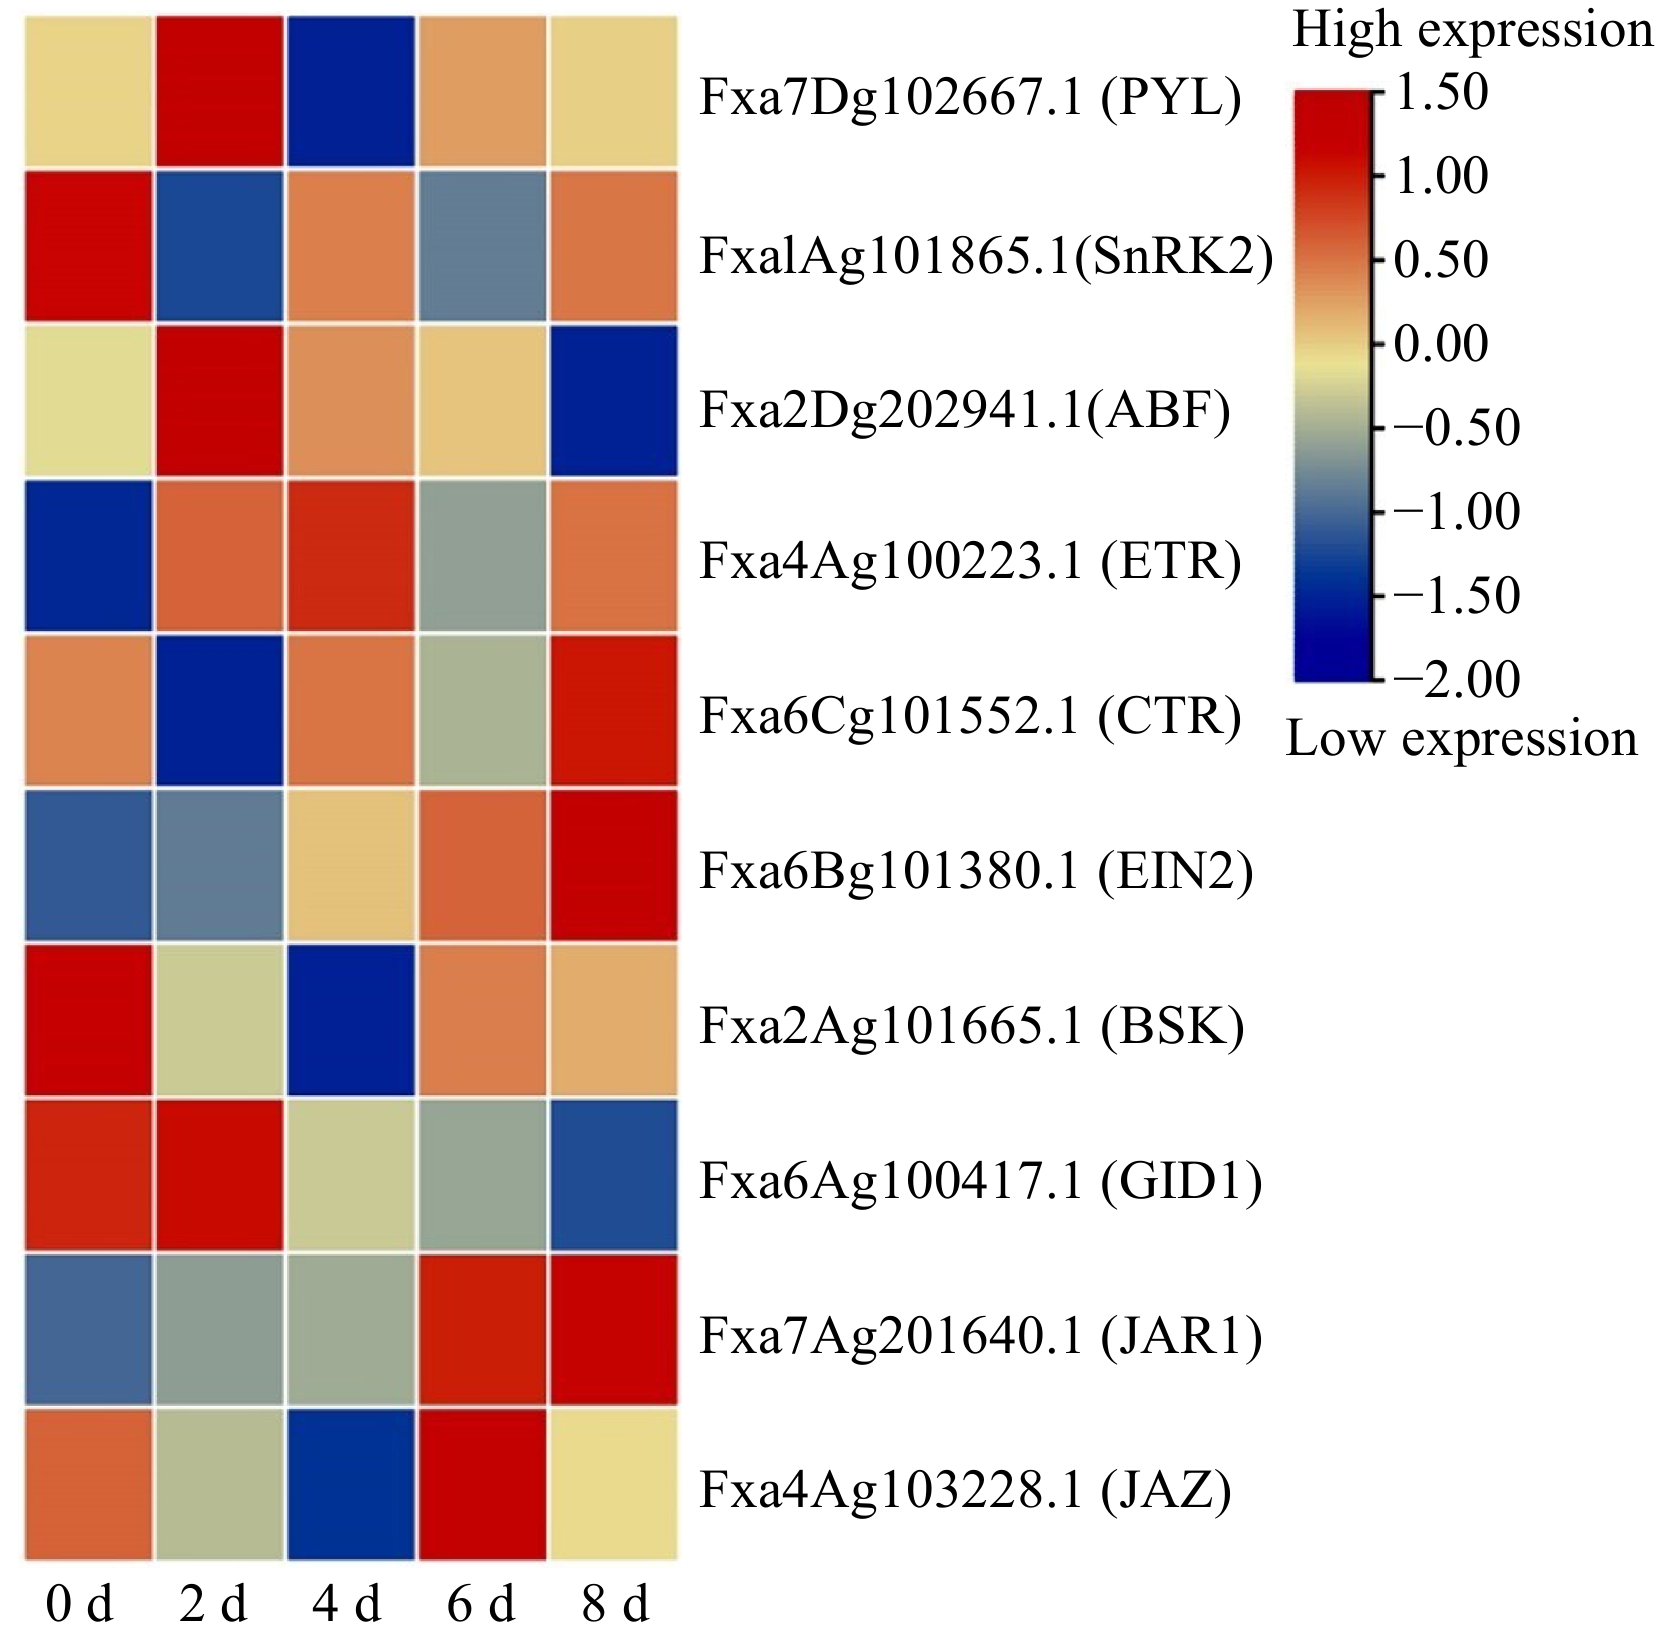
Figure 5.
Heatmap analysis of differentially expressed proteome related to strawberry fruit senescence during storage. PYL: PYR1-like/regulatory components of ABA receptor proteins (PYR/PYL/RCARs); SnRK2: SNF1-related kinase 2; ABF: ABRE (ABA-responsive element binding protein)-binding factor); ETR: ethylene triple response; ETR2: CTR: constitutive triple response; EIN2: Ethylene Insensitive 2; BSK: brassinolide signal kinase; GID1: gibberellin-insensitive dwarf1 (gibberellin receptor); JAR1: jasmonate resistant 1; JAZ: jasmonate-ZIM domain.
-
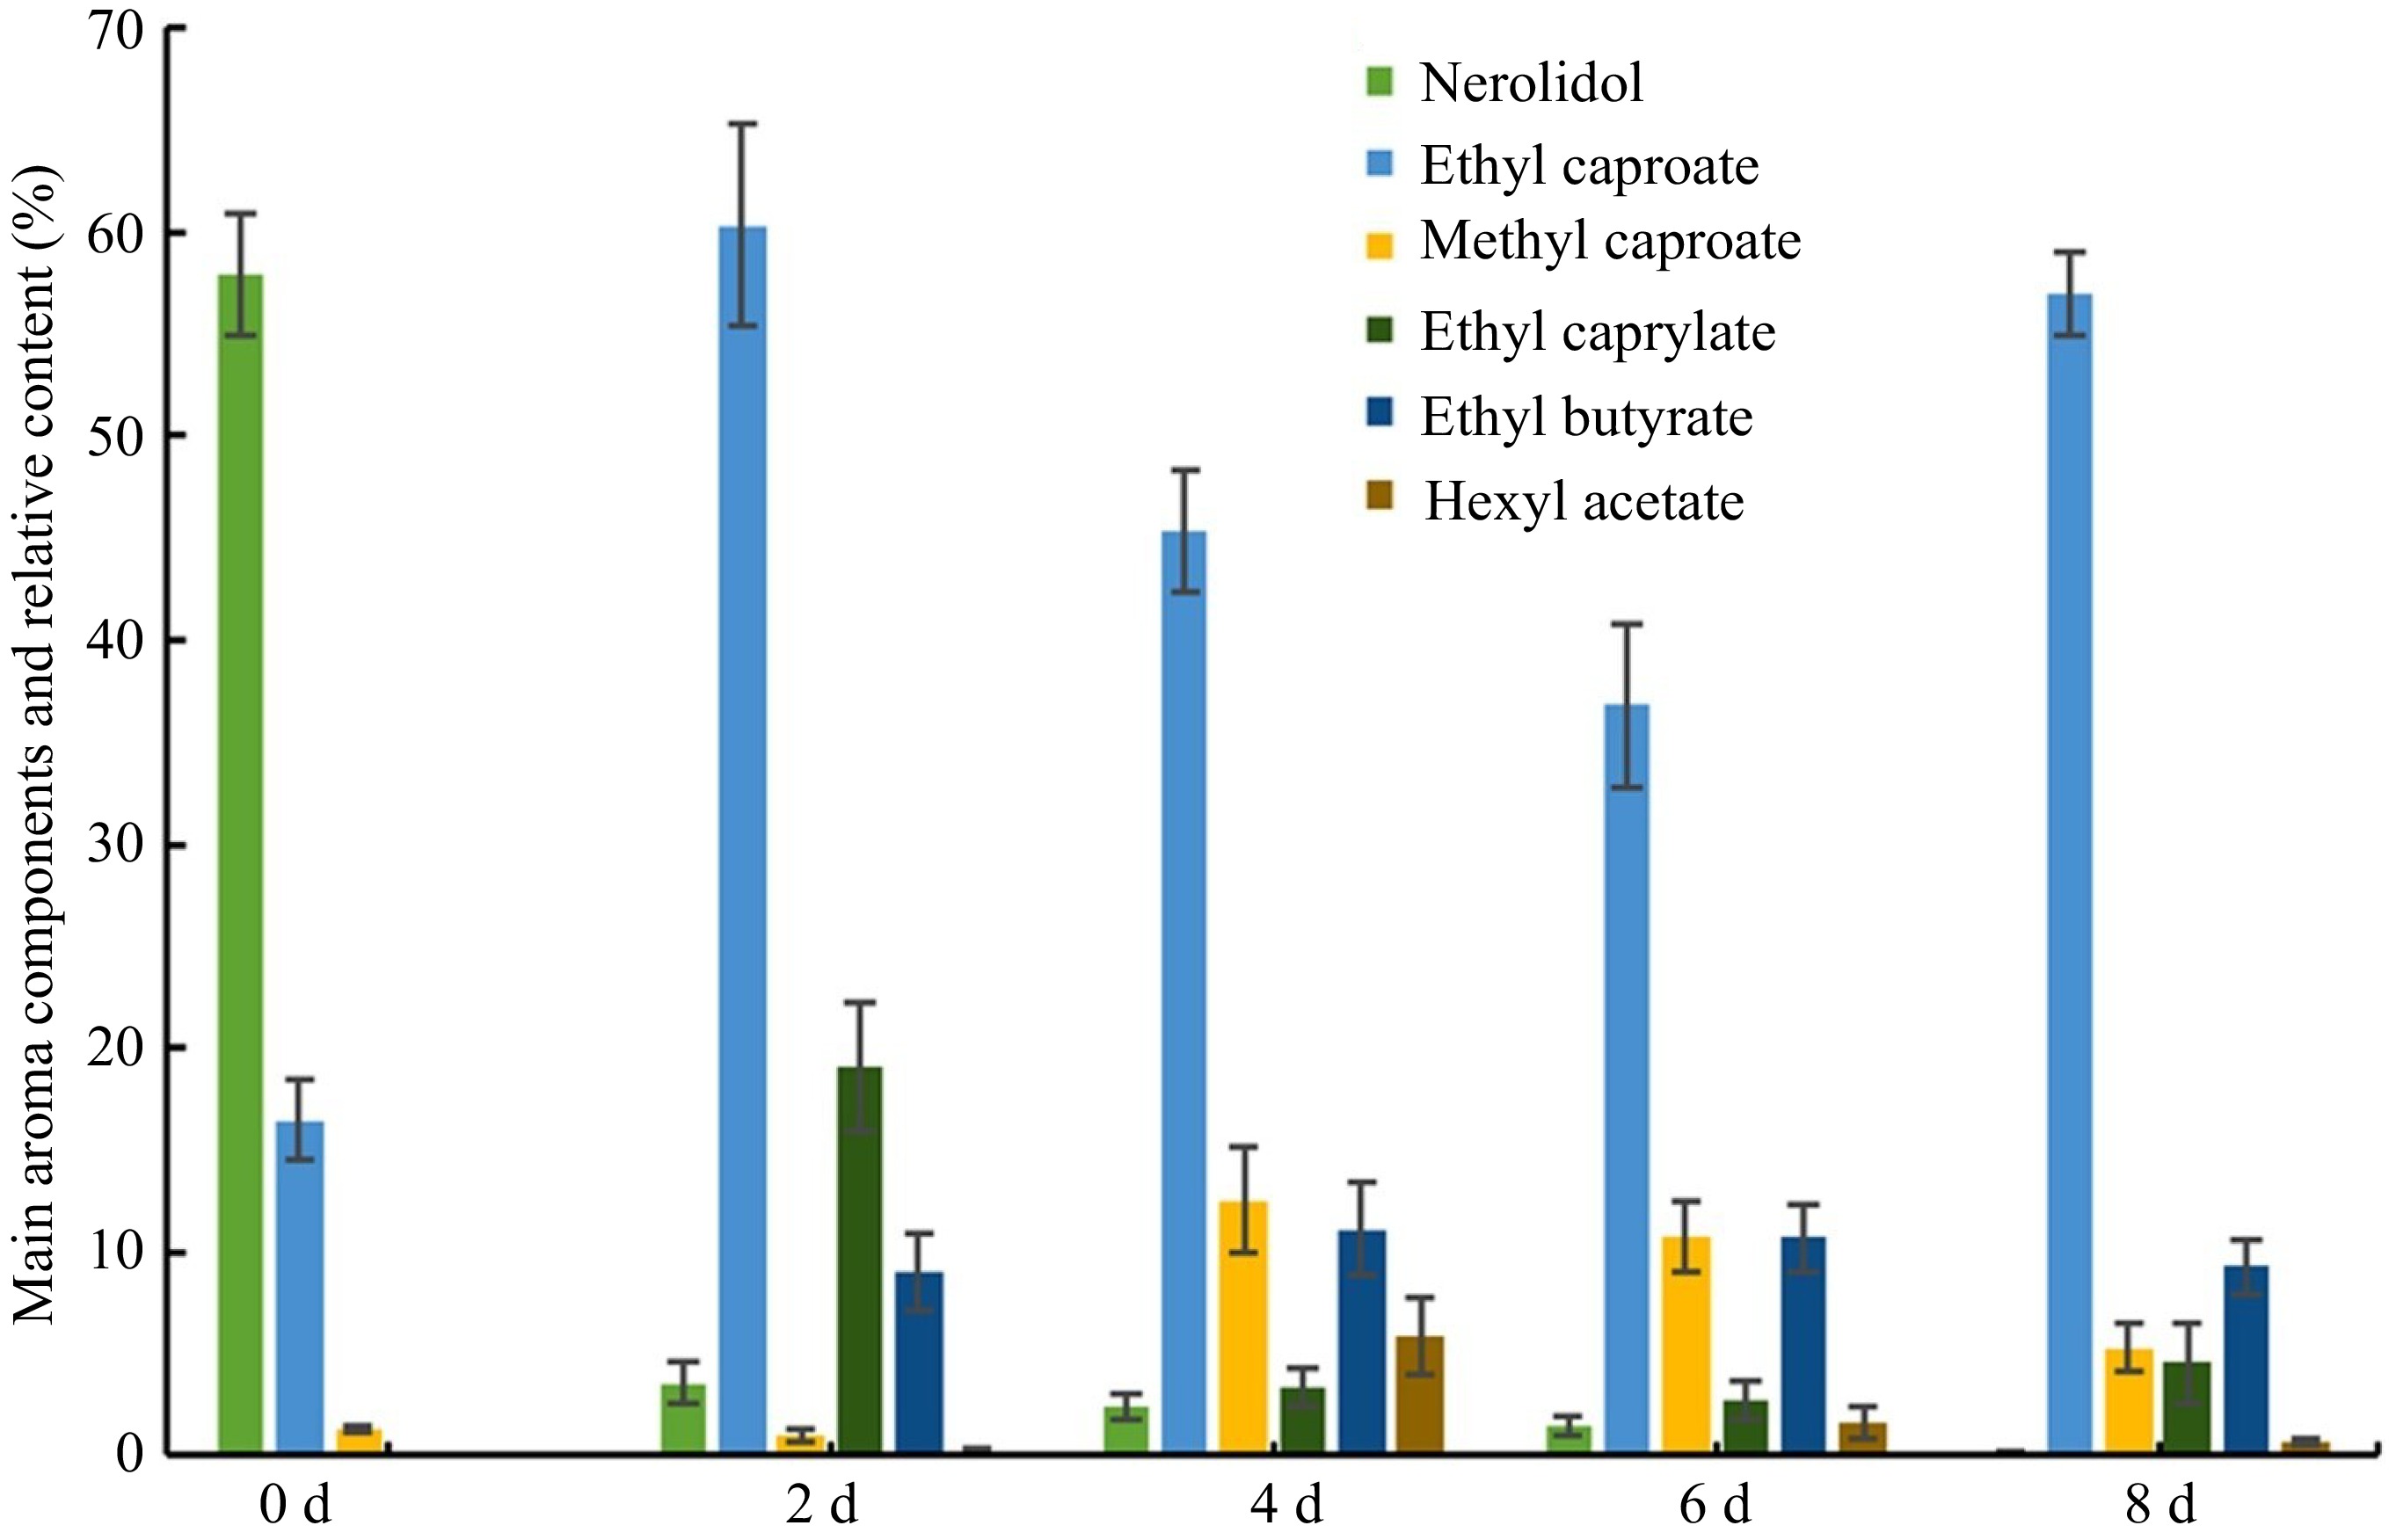
Figure 6.
Changes in the relative contents of the main aroma components in strawberry fruit over time.
-
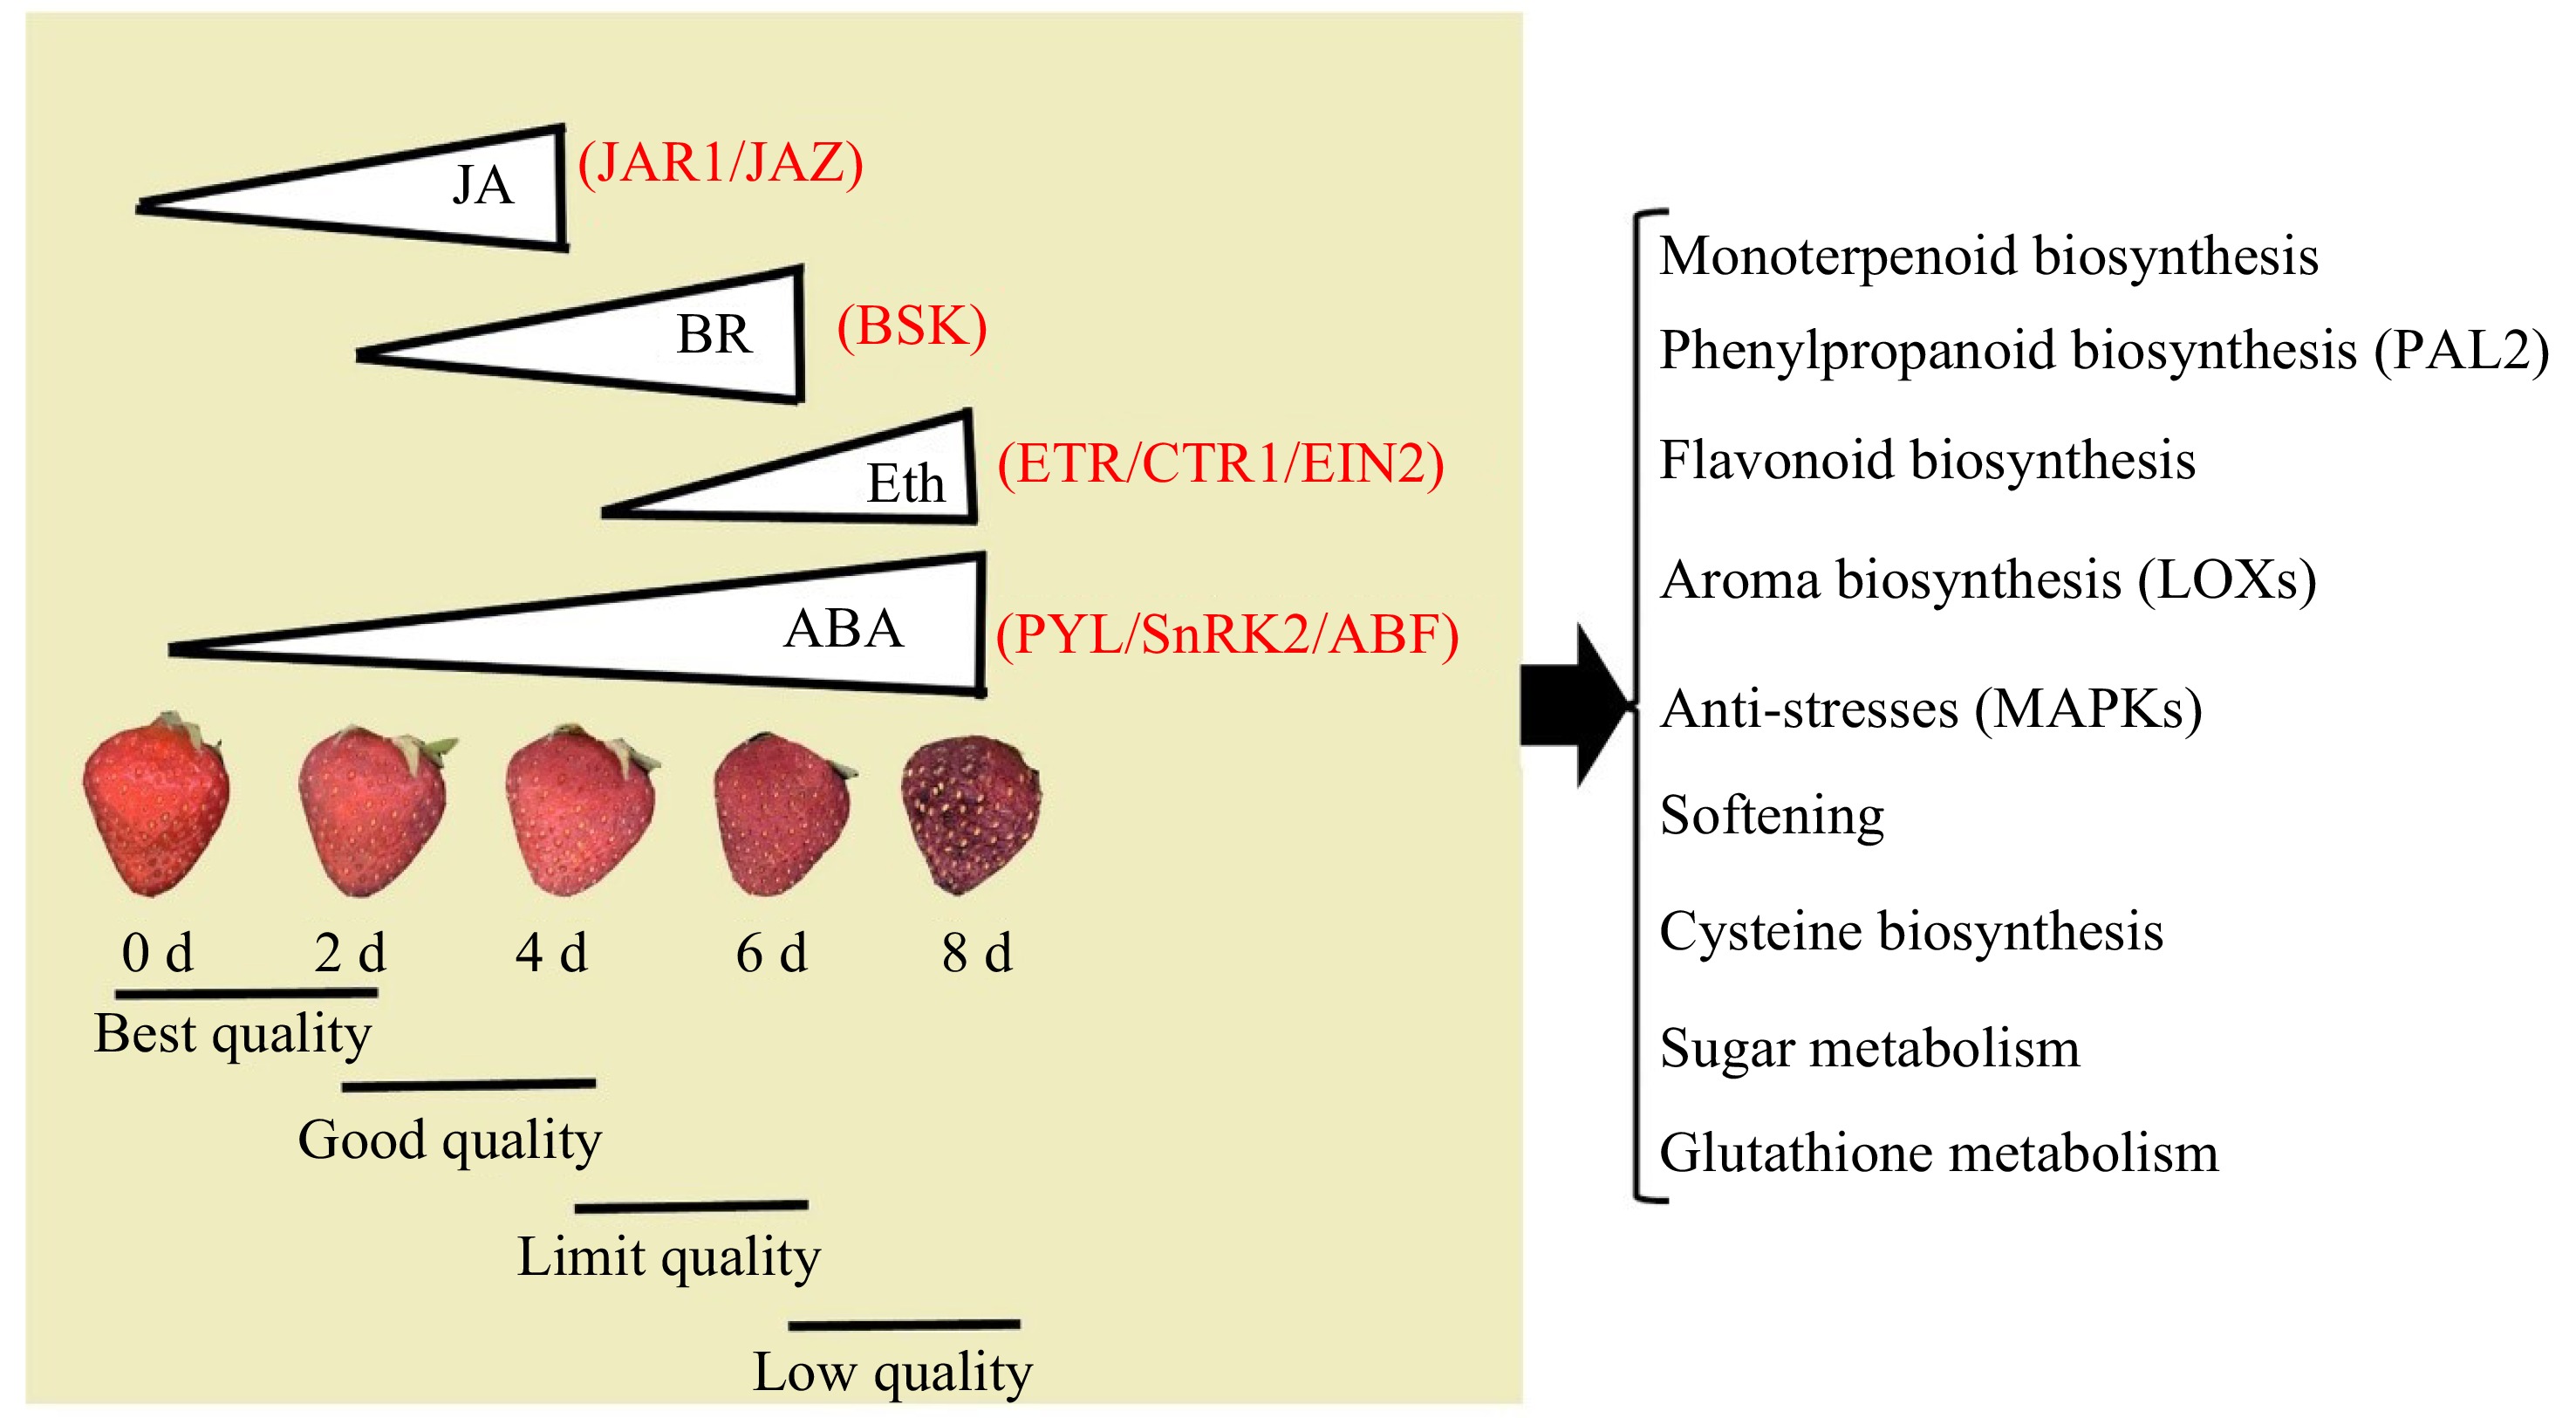
Figure 7.
A physiological, molecular and metabolism model for strawberry fruit senescence from the best quality to low quality. The central hormone of ABA promotes the fruit rapid senescence from the best, good, and limited quality to low quality during 0−8 d, by a coordinated regulation of the early stage (0−4 d) with JA, middle stage (2−6 d) with BR, and later stage (4−6 d) with Eth. They trigger a series of signaling transduction and metabolisms: the former includes ABA with PYL/SnRK2/ABF, JA with JAR1/JAZ, BR with BSK, Eth with ETR/CTR/EIN2; the later includes monoterpenoid, phenylpropanoids, and flavonoid biosynthesis, as well as sugar metabolism, together with aroma and cysteine biosynthesis, anti-stresses, and softening. PYL: PYR1-like/regulatory components of ABA receptor proteins (PYR/PYL/RCARs); SnRK2: SNF1-related kinase 2; ABF: ABRE (ABA-responsive element binding protein)-binding factor); ETR: ethylene triple response; CTR: constitutive triple response; EIN2: Ethylene Insensitive 2; BSK: brassinolide signal kinase; GID1: gibberellin-insensitive dwarf1 (gibberellin receptor); JAR1: jasmonate resistant 1; JAZ: jasmonate-ZIM domain.
-
Free amino acid (µg/g) 0 d 2 d 4 d 6 d 8 d Threonine (Thr) 2.085 ± 0.091a 1.539 ± 0.045b 1.085 ± 0.062c 1.463 ± 0.079b 0.824 ± 0.025c Alanine (Ala) 0.901 ± 0.028a 0.735 ± 0.032b 0.487 ± 0.024d 0.549 ± 0.018c 0.717 ± 0.010b Glutamic acid (Glu) 0.313 ± 0.012a 0.272 ± 0.027ab 0.234 ± 0.008b 0.268 ± 0.040ab 0.216 ± 0.052b Aspartic acid (Asp) 0.165 ± 0.042a 0.165 ± 0.040a 0.185 ± 0.046a 0.188 ± 0.037a 0.127 ± 0.047a Serine (Ser) 0.152 ± 0.026a 0.139 ± 0.028a 0.134 ± 0.034a 0.158 ± 0.082a 0.184 ± 0.058a Valine (Val) 0.127 ± 0.035a 0.141 ± 0.023a 0.107 ± 0.028a 0.111 ± 0.066a 0.091 ± 0.029a Phenylalanine (Phe) 0.037 ± 0.042a 0.035 ± 0.044a 0.029 ± 0.027a 0.035 ± 0.014a 0.017 ± 0.032a Glycine (Gly) 0.026 ± 0.015a 0.021 ± 0.011a 0.025 ± 0.012a 0.027 ± 0.014a 0.031 ± 0.017a Leucine (Leu) 0.024 ± 0.011ab 0.015 ± 0.021b 0.029 ± 0.035ab 0.011 ± 0.006b 0.039 ± 0.008a Lysine (Lys) 0.021 ± 0.020a 0.024 ± 0.013a 0.019 ± 0.015a 0.024 ± 0.012a 0.015 ± 0.014a Tyrosine (Tyr) 0.015 ± 0.005a — — — 0.009 ± 0.001a Isoleucine (Ile) 0.014 ± 0.002a 0.015 ± 0.008a — — — Histidine (His) 0.013 ± 0.007a 0.015 ± 0.009a — 0.009 ± 0.005a 0.008 ± 0.003a Methionine (Met) 0.011 ± 0.005a — — 0.011 ± 0.009a 0.014 ± 0.006a Arginine (Arg) — 0.009 ± 0.004b 0.024 ± 0.083a — 0.012 ± 0.008a Cysteine (Cys) — — — 0.006 ± 0.001a 0.005 ± 0.002a Total amino acids 3.904 ± 1.52a 3.124 ± 1.26ab 2.358 ± 0.34ab 2.855 ± 0.45ab 2.309 ± 0.27b —, representing not detectable. For each free amino acid, different letters within a row indicate significant differences according to Duncan's multiple range test at p < 0.05. Table 1.
Changes in free amino acid content in the 'Benihope' strawberry fruit during storage.
Figures
(7)
Tables
(1)