-
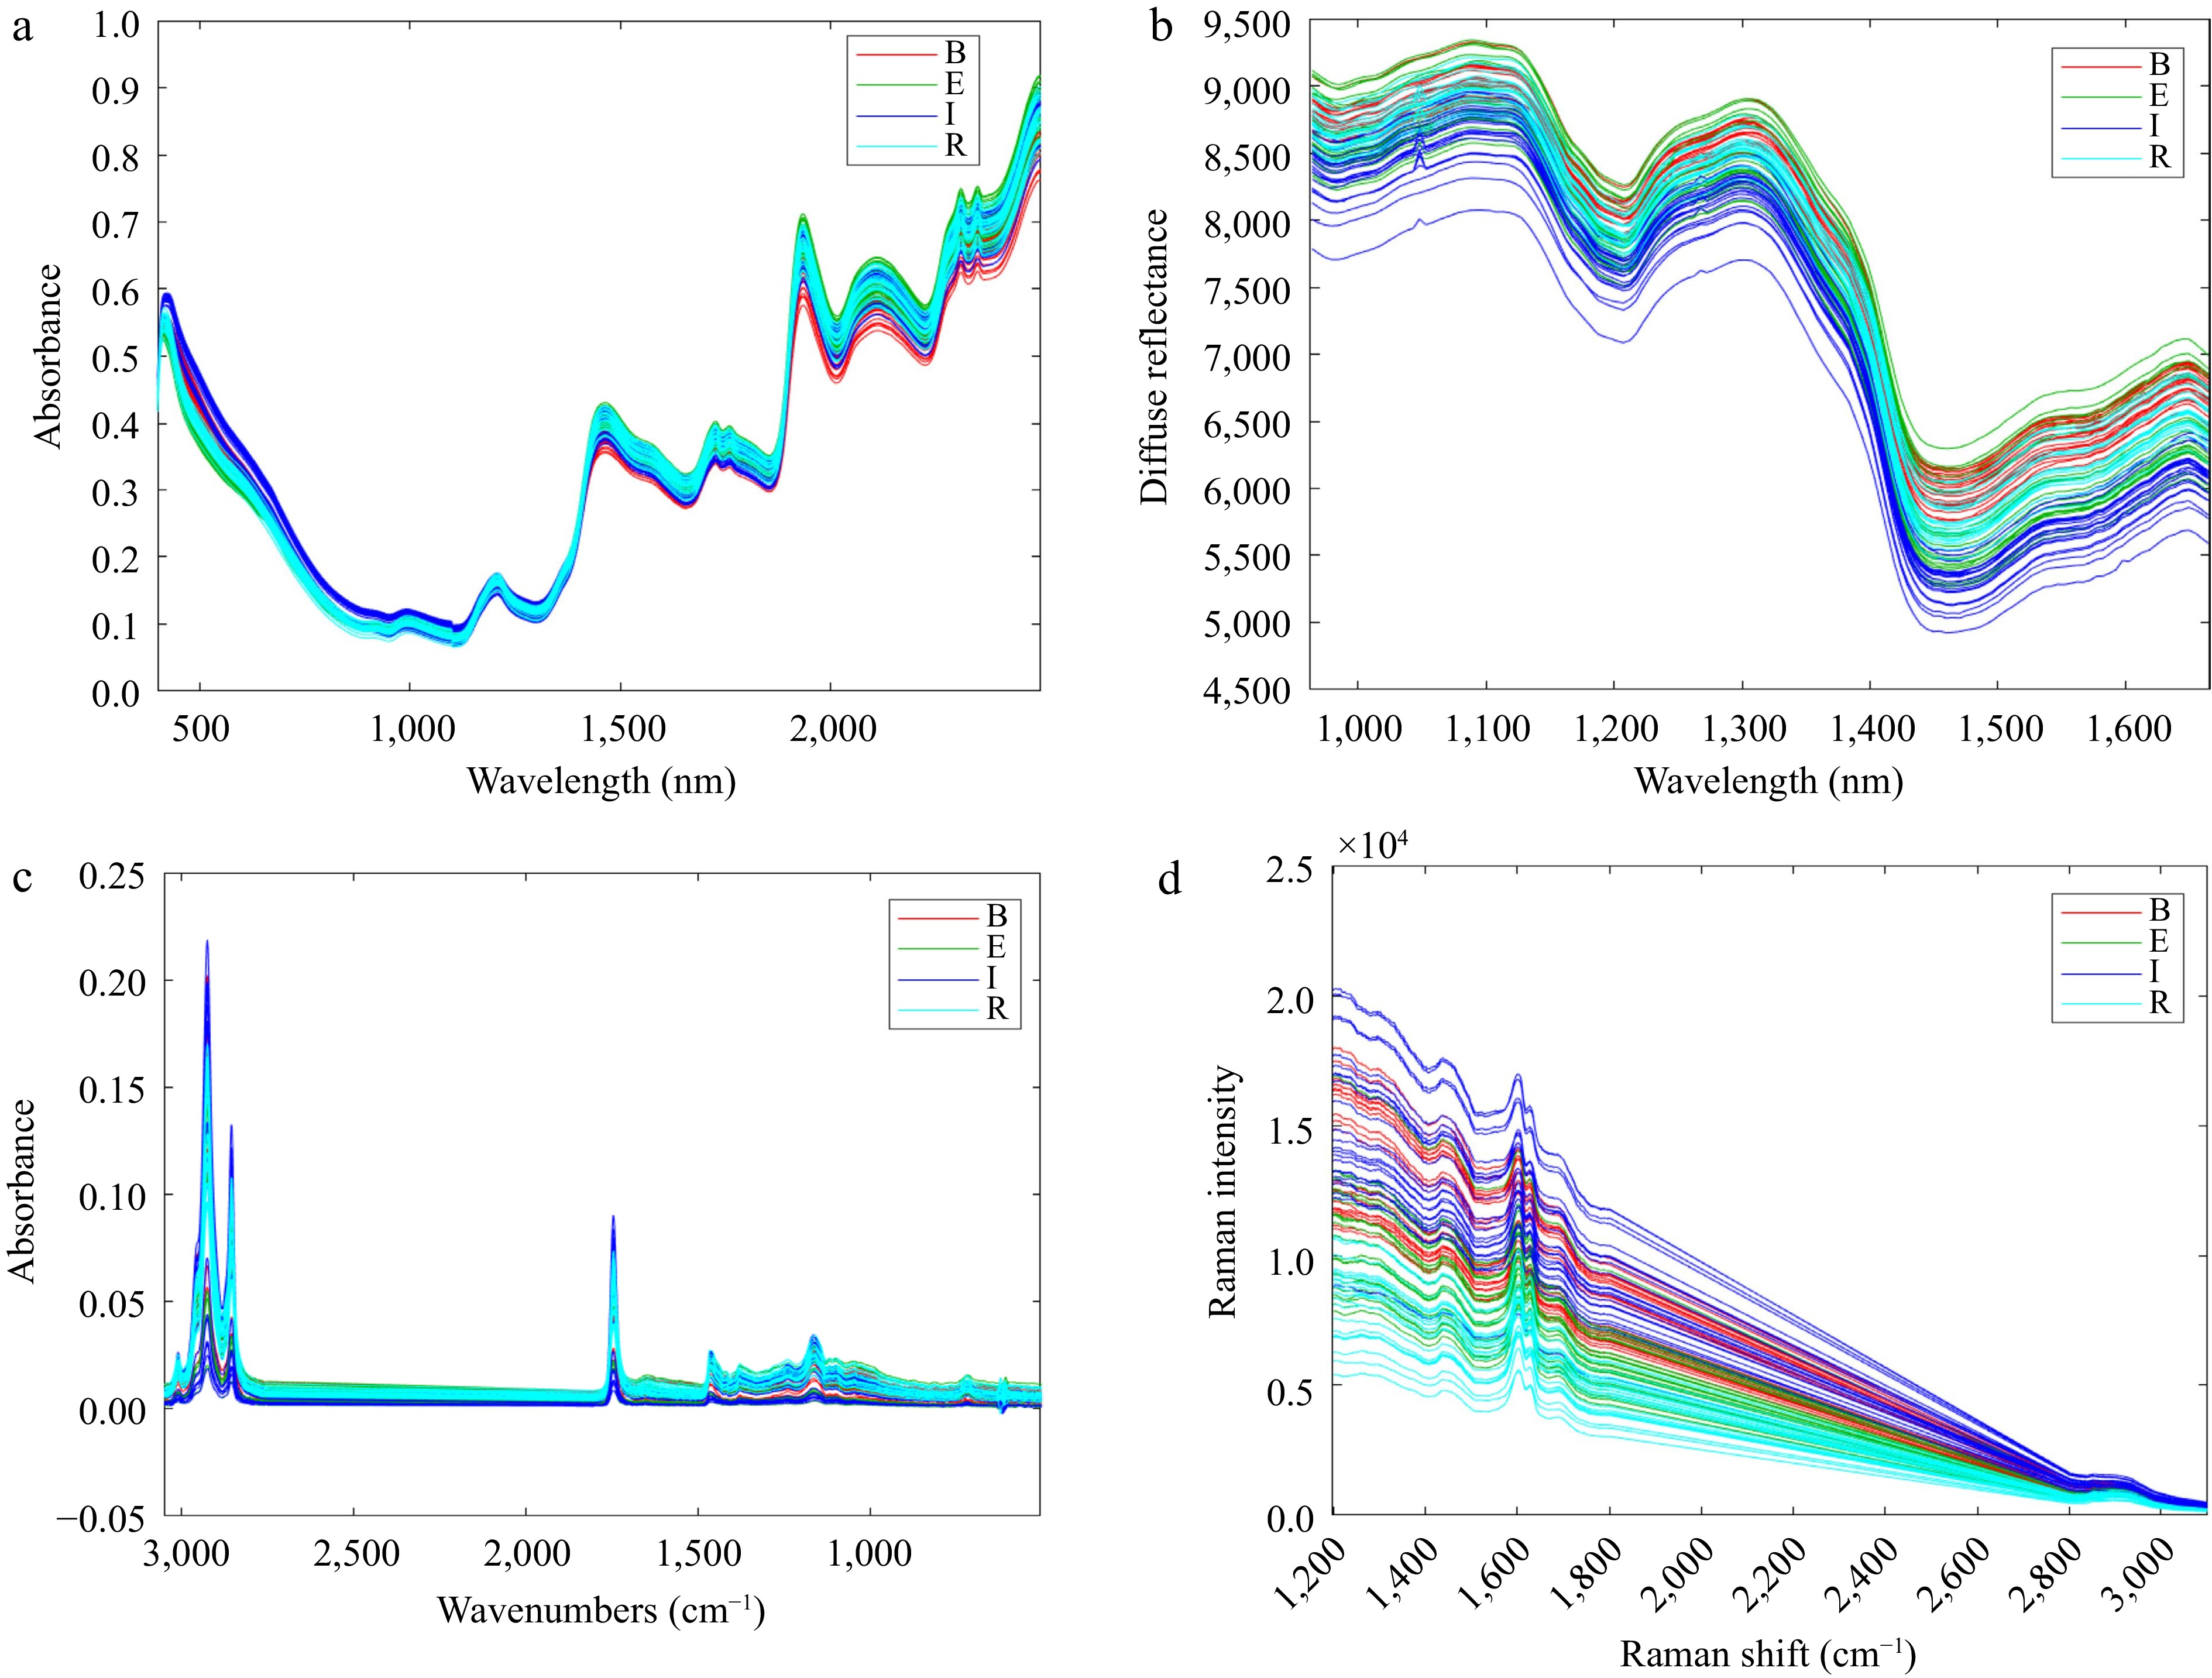
Figure 1.
Raw spectra from instruments before pre-processing data treatment: (a) DG-NIR, (b) HSI-NIR, (c) ATR-FTIR, (d) Raman. GCP samples are labelled according to the country of origin (B: Brazil, E: Ethiopia, I: Indonesia, R: Rwanda).
-
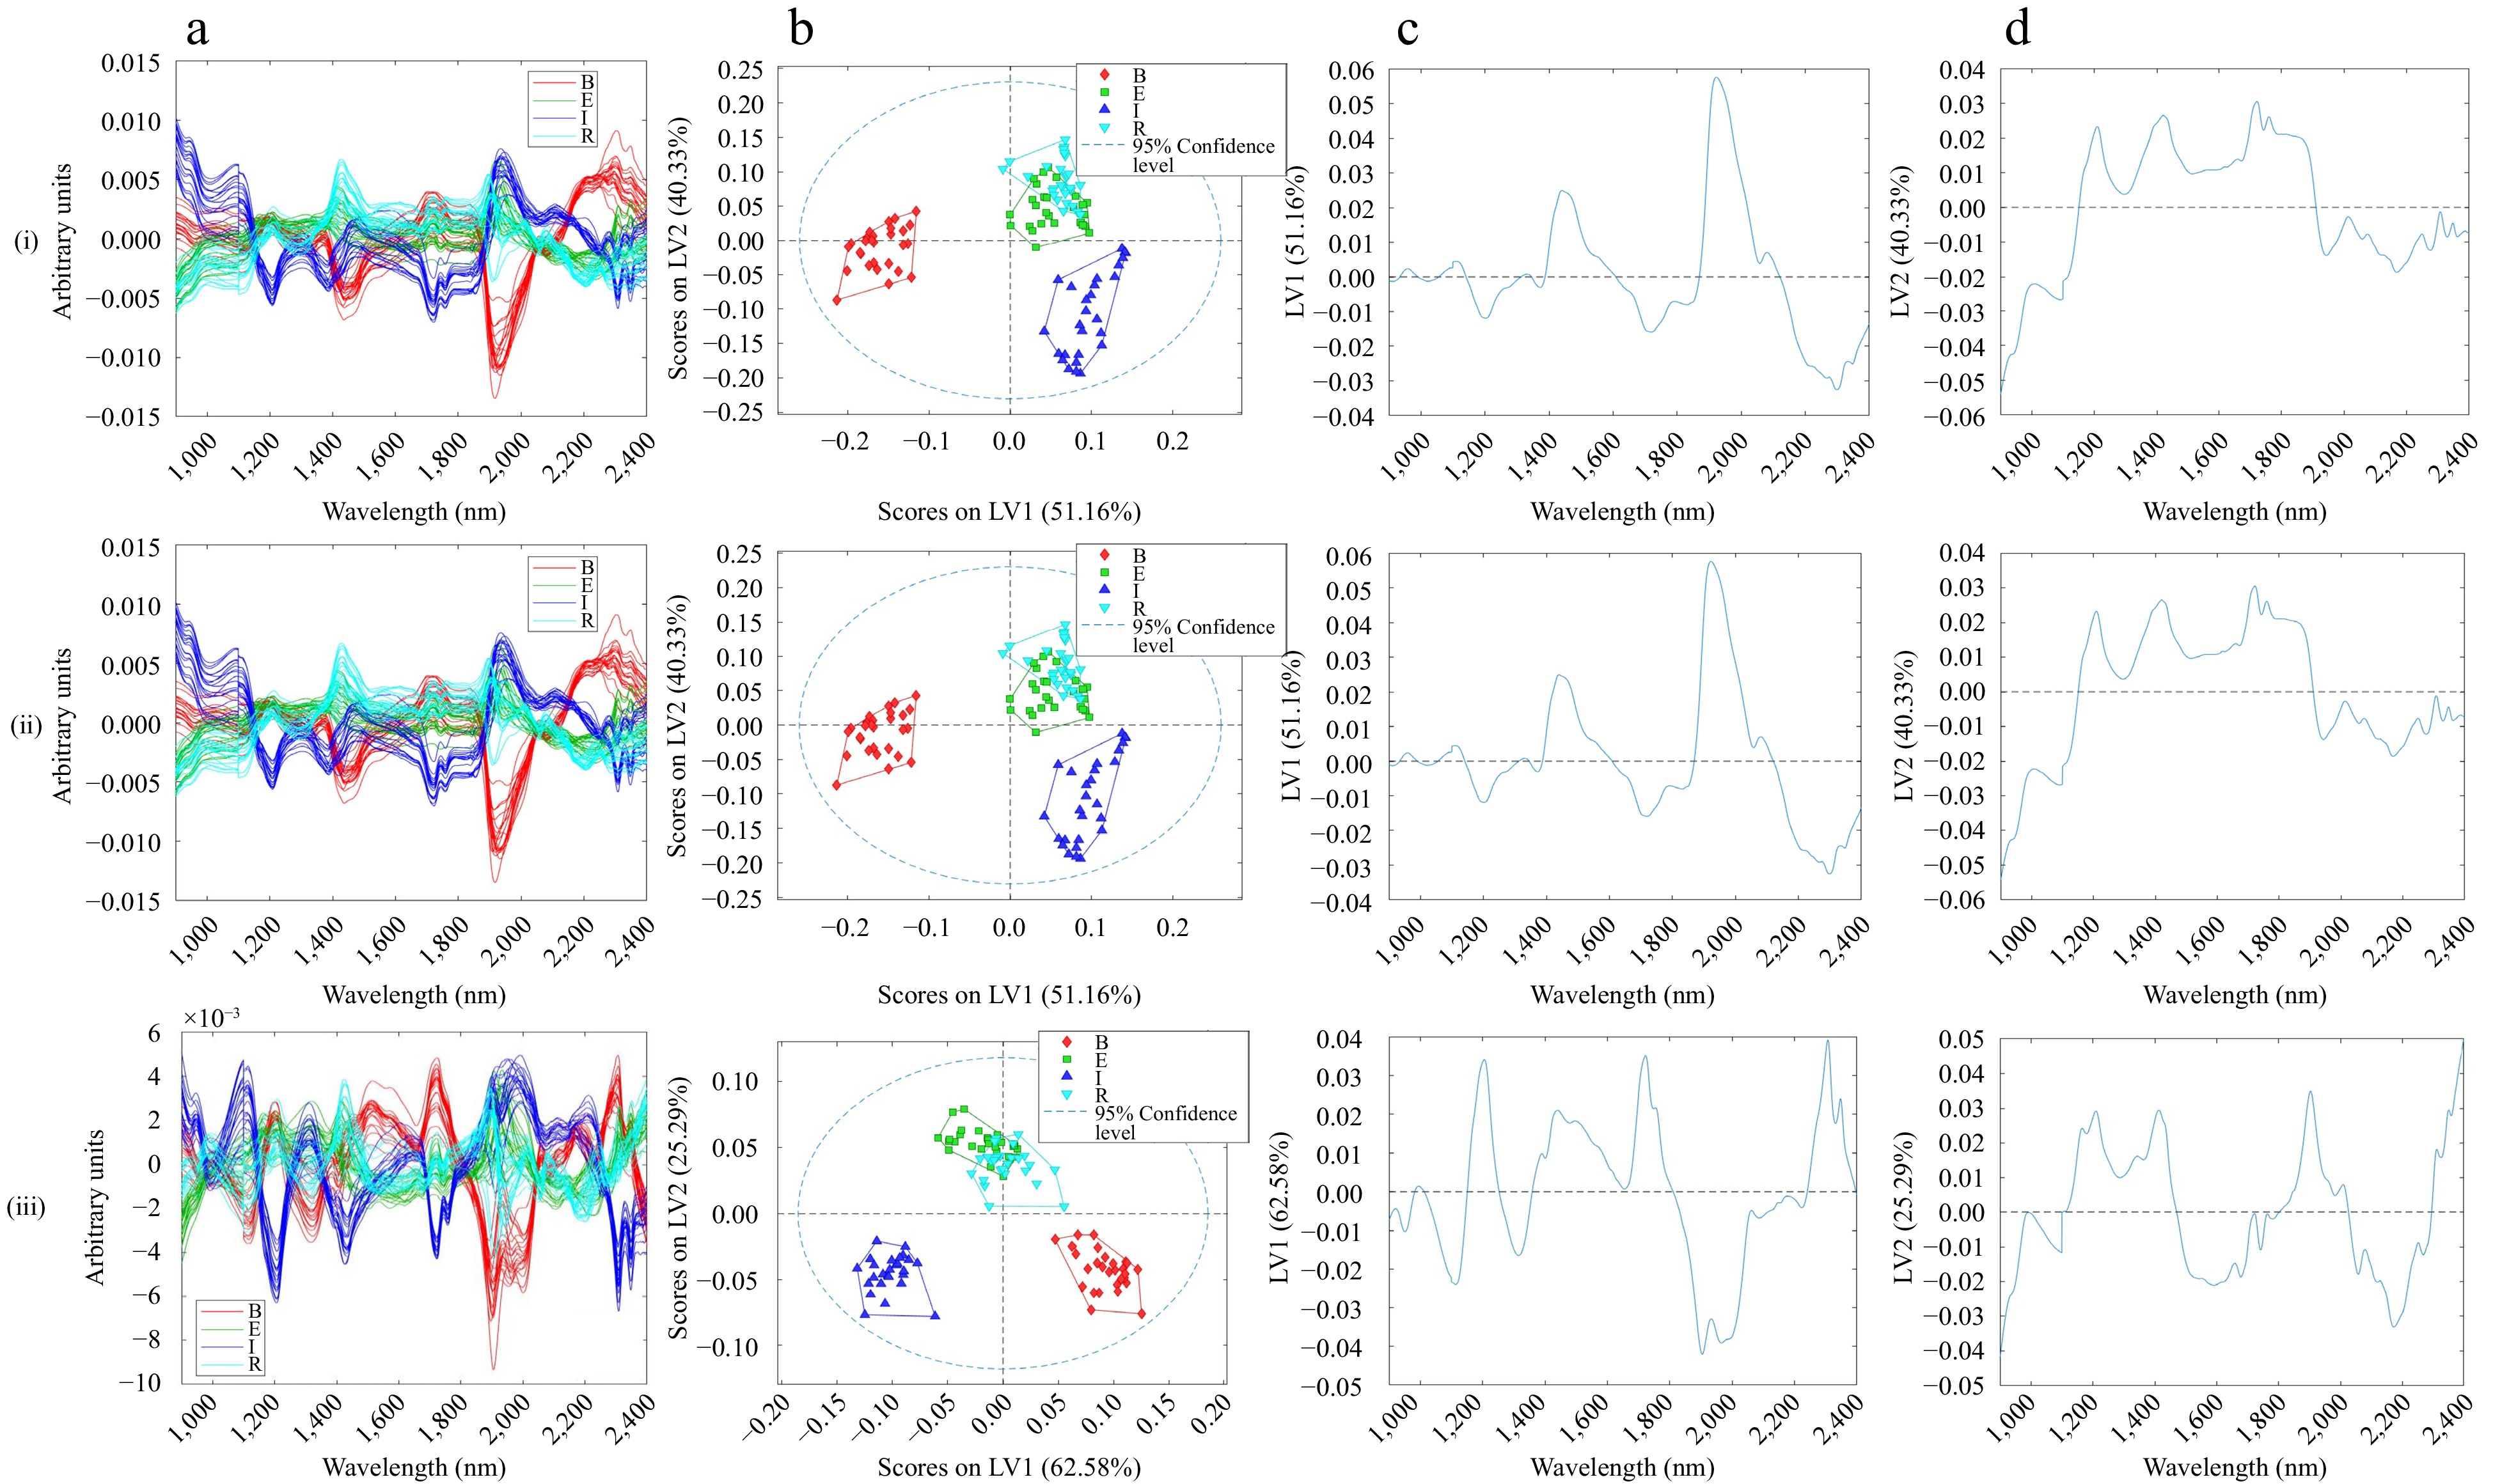
Figure 2.
(a) Pre-processed DG-NIR spectra, (b) scores, (c) first loading, (d) second loading of (i) MSC with MNCN, (ii) SNV with MNCN, (iii) EMSC with MNCN pre-processed DG-NIR spectra.
-
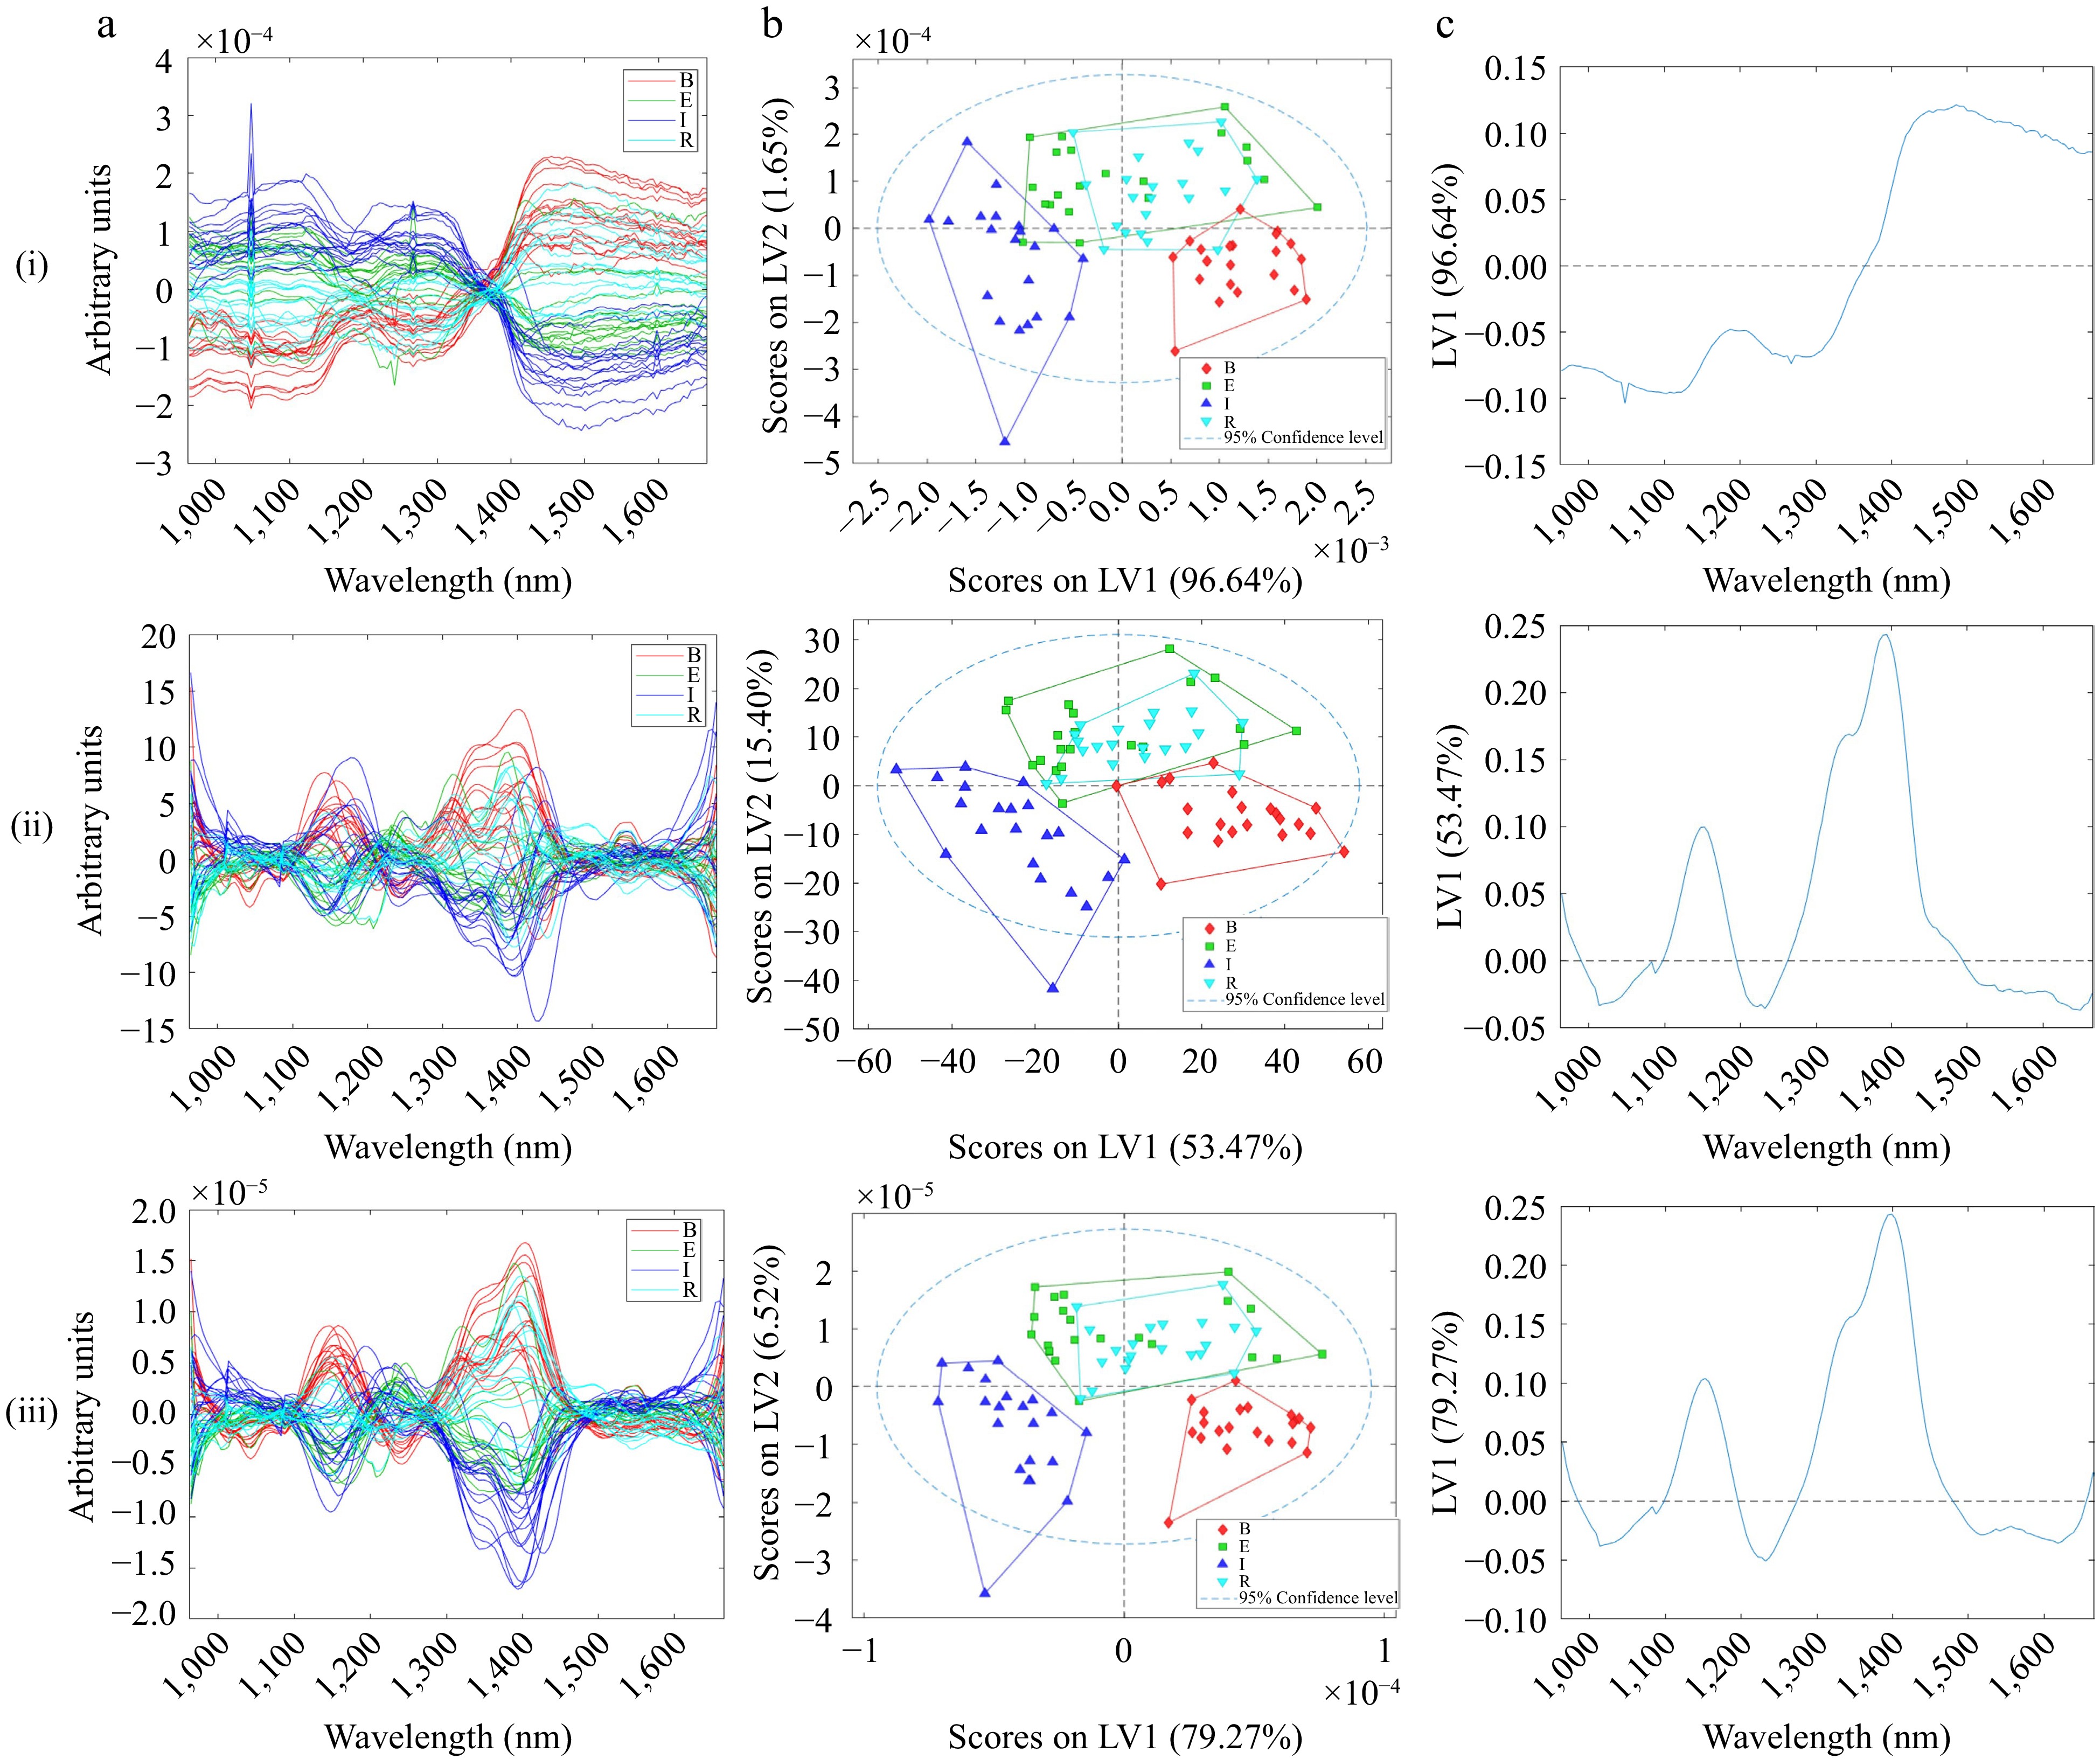
Figure 3.
(a) Pre-processed HSI-NIR spectra measured in reflectance, (b) scores, (c) first loading of (i) Normalisation with MNCN, (ii) SG (1st der, 2nd poly, 15 pts) with MNCN, (iii) Normalisation, SG (1st der, 2nd poly, 15 pts) with MNCN pre-processed HSI-NIR spectra.
-
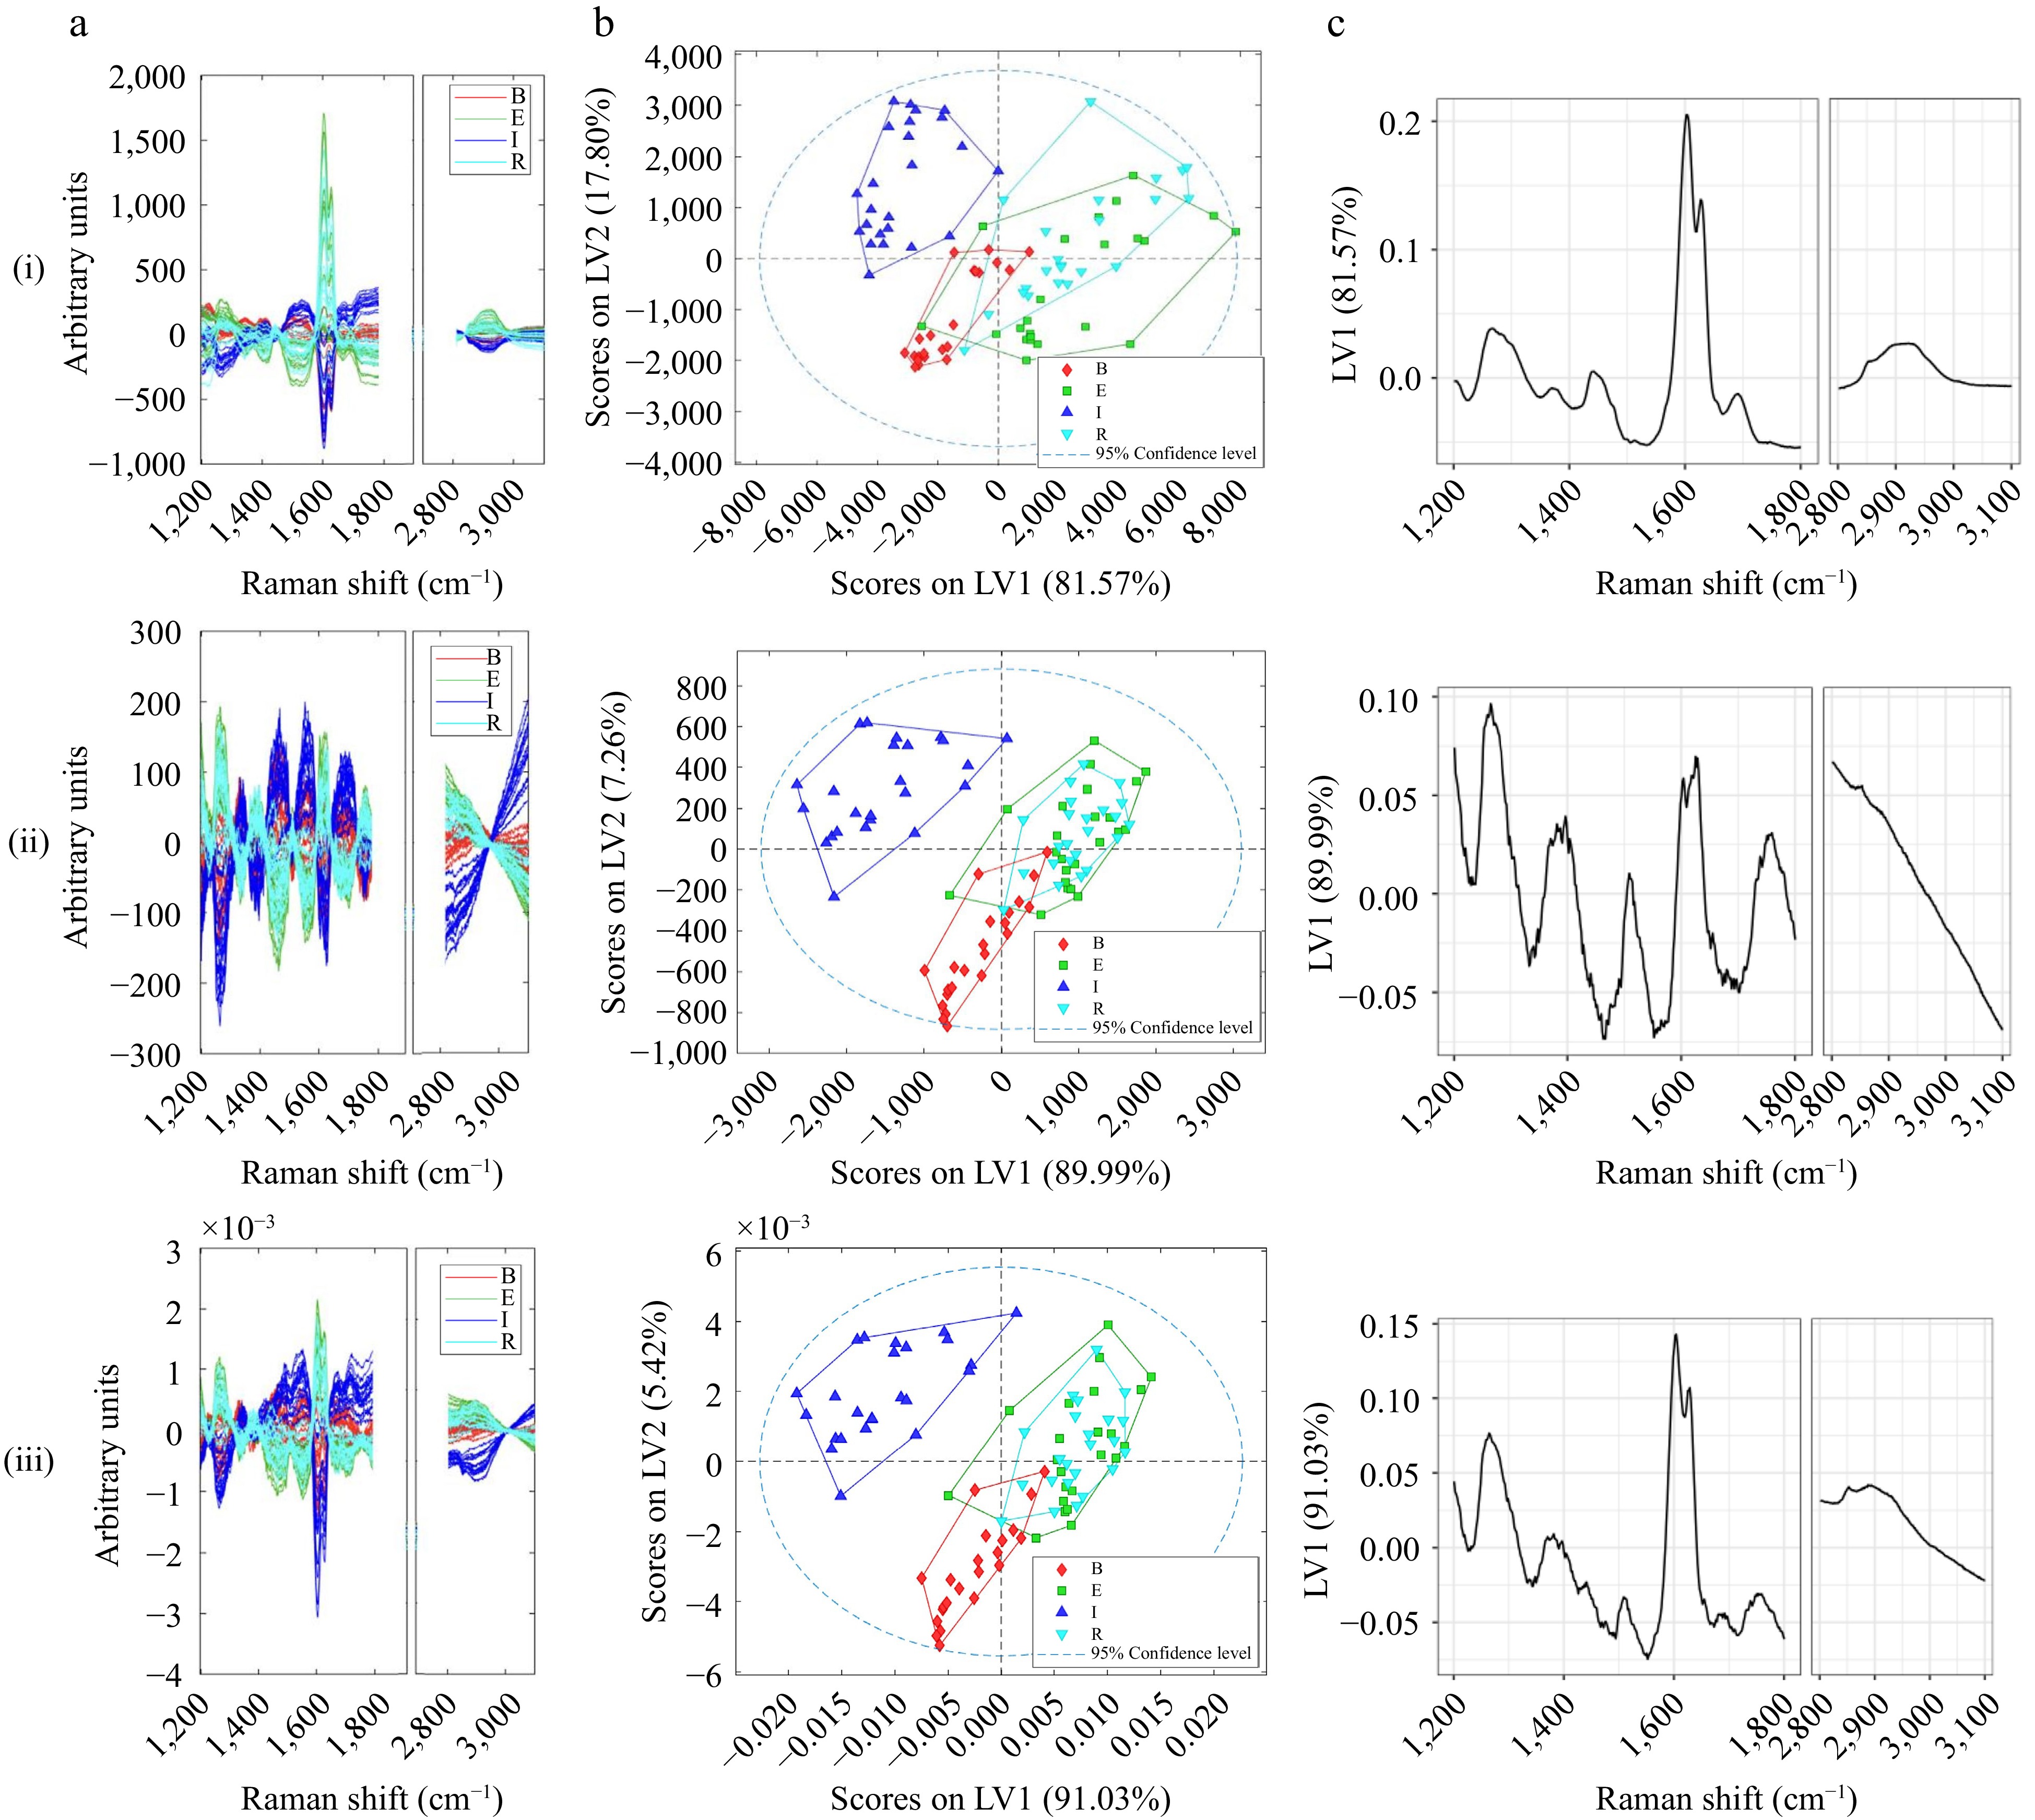
Figure 4.
(a) Pre-processed Raman spectra, (b) scores, (c) first loading of (i) MSC with MNCN, (ii) EMSC with MNCN, (iii) WLS, Normalisation with MNCN pre-processed Raman spectra. Loading plots were produced using R.
-
Optimised pre-processing TVar % RMSECV RMSEC RMSEP MCC, Pred. Accuracy, Pred F1, Pred. DG-NIR MNCN 98.54 0.338 0.329 0.473 0.383 0.665 0.483 MSC, MNCN 91.49 0.245 0.243 0.309 0.774 0.882 0.865 SNV, MNCN 91.49 0.245 0.243 0.309 0.774 0.882 0.865 SNV, Detrend, MNCN 91.32 0.245 0.243 0.309 0.774 0.882 0.865 MSC, SG (1st der, 2nd poly, 15 pts), MNCN 76.06 0.268 0.265 0.350 0.684 0.835 0.788 Normalisation, SG (2nd der, 2nd poly, 7 pts), MNCN 98.05 0.358 0.352 0.351 0.652 0.812 0.757 EMSC, MNCN 87.87 0.240 0.238 0.250 0.876 0.929 0.916 HSI-NIR MNCN 99.69 0.372 0.362 0.421 0.618 0.800 0.681 Normalisation, MNCN 98.28 0.333 0.322 0.402 0.655 0.767 0.650 SG (1st der, 2nd poly, 15 pts), MNCN 68.87 0.341 0.325 0.364 0.636 0.800 0.728 MSC, SG (1st der, 2nd poly, 15 pts), MNCN 63.41 0.338 0.324 0.403 0.473 0.733 0.605 Normalisation, SG (1st der, 2nd poly, 15 pts), MNCN 85.79 0.324 0.313 0.375 0.612 0.800 0.732 SNV, SG( 1st der, 2nd poly, 15 pts), MNCN 63.38 0.337 0.324 0.402 0.473 0.733 0.605 FTIR MNCN 99.69 0.335 0.321 0.386 0.253 0.452 0.200 Normalisation, MNCN 98.17 0.334 0.320 0.391 0.372 0.452 0.179 Normalisation, SG (1st der, 2nd poly, 15 pts), MNCN 97.12 0.402 0.369 0.490 0.141 0.500 0.330 EMSC, MNCN 71.52 0.409 0.384 0.482 0.286 0.500 0.326 Raman MNCN 99.91 0.319 0.312 0.329 0.756 0.860 0.819 SG (2nd der, 2nd poly, 7 pts), MNCN 99.66 0.350 0.343 0.369 0.521 0.735 0.648 Normalisation, SG (1st der, 2nd poly, 15 pts), MNCN 98.94 0.321 0.315 0.334 0.554 0.747 0.622 WLS (2nd poly), MNCN 96.86 0.343 0.336 0.372 0.611 0.795 0.760 FT, Fourier-Transform; DG, Dispersive; HSI, Hyperspectral Imaging; NIR, near-infrared; TVar, Total explained variance; RMSE(C/CV/P), Root Mean Square Errors of Calibration/Cross-Validation/Prediction; MCC, Matthew's Correlation Coefficient, MNCN, Mean centering; MSC; Multiplicative Scatter Correction; EMSC, Extended Multiplicative Scatter Correction; SG (#der, #poly, #pts), Savitzky-Golay #derivative, #polynomial, #window points; WLS, Weighted Least Squares; Pred., Prediction. Table 1.
Prediction statistics associated with optimal pre-processing methods for spectral data collected using DG-NIR, HSI-NIR, FTIR and Raman.
Figures
(4)
Tables
(1)