-
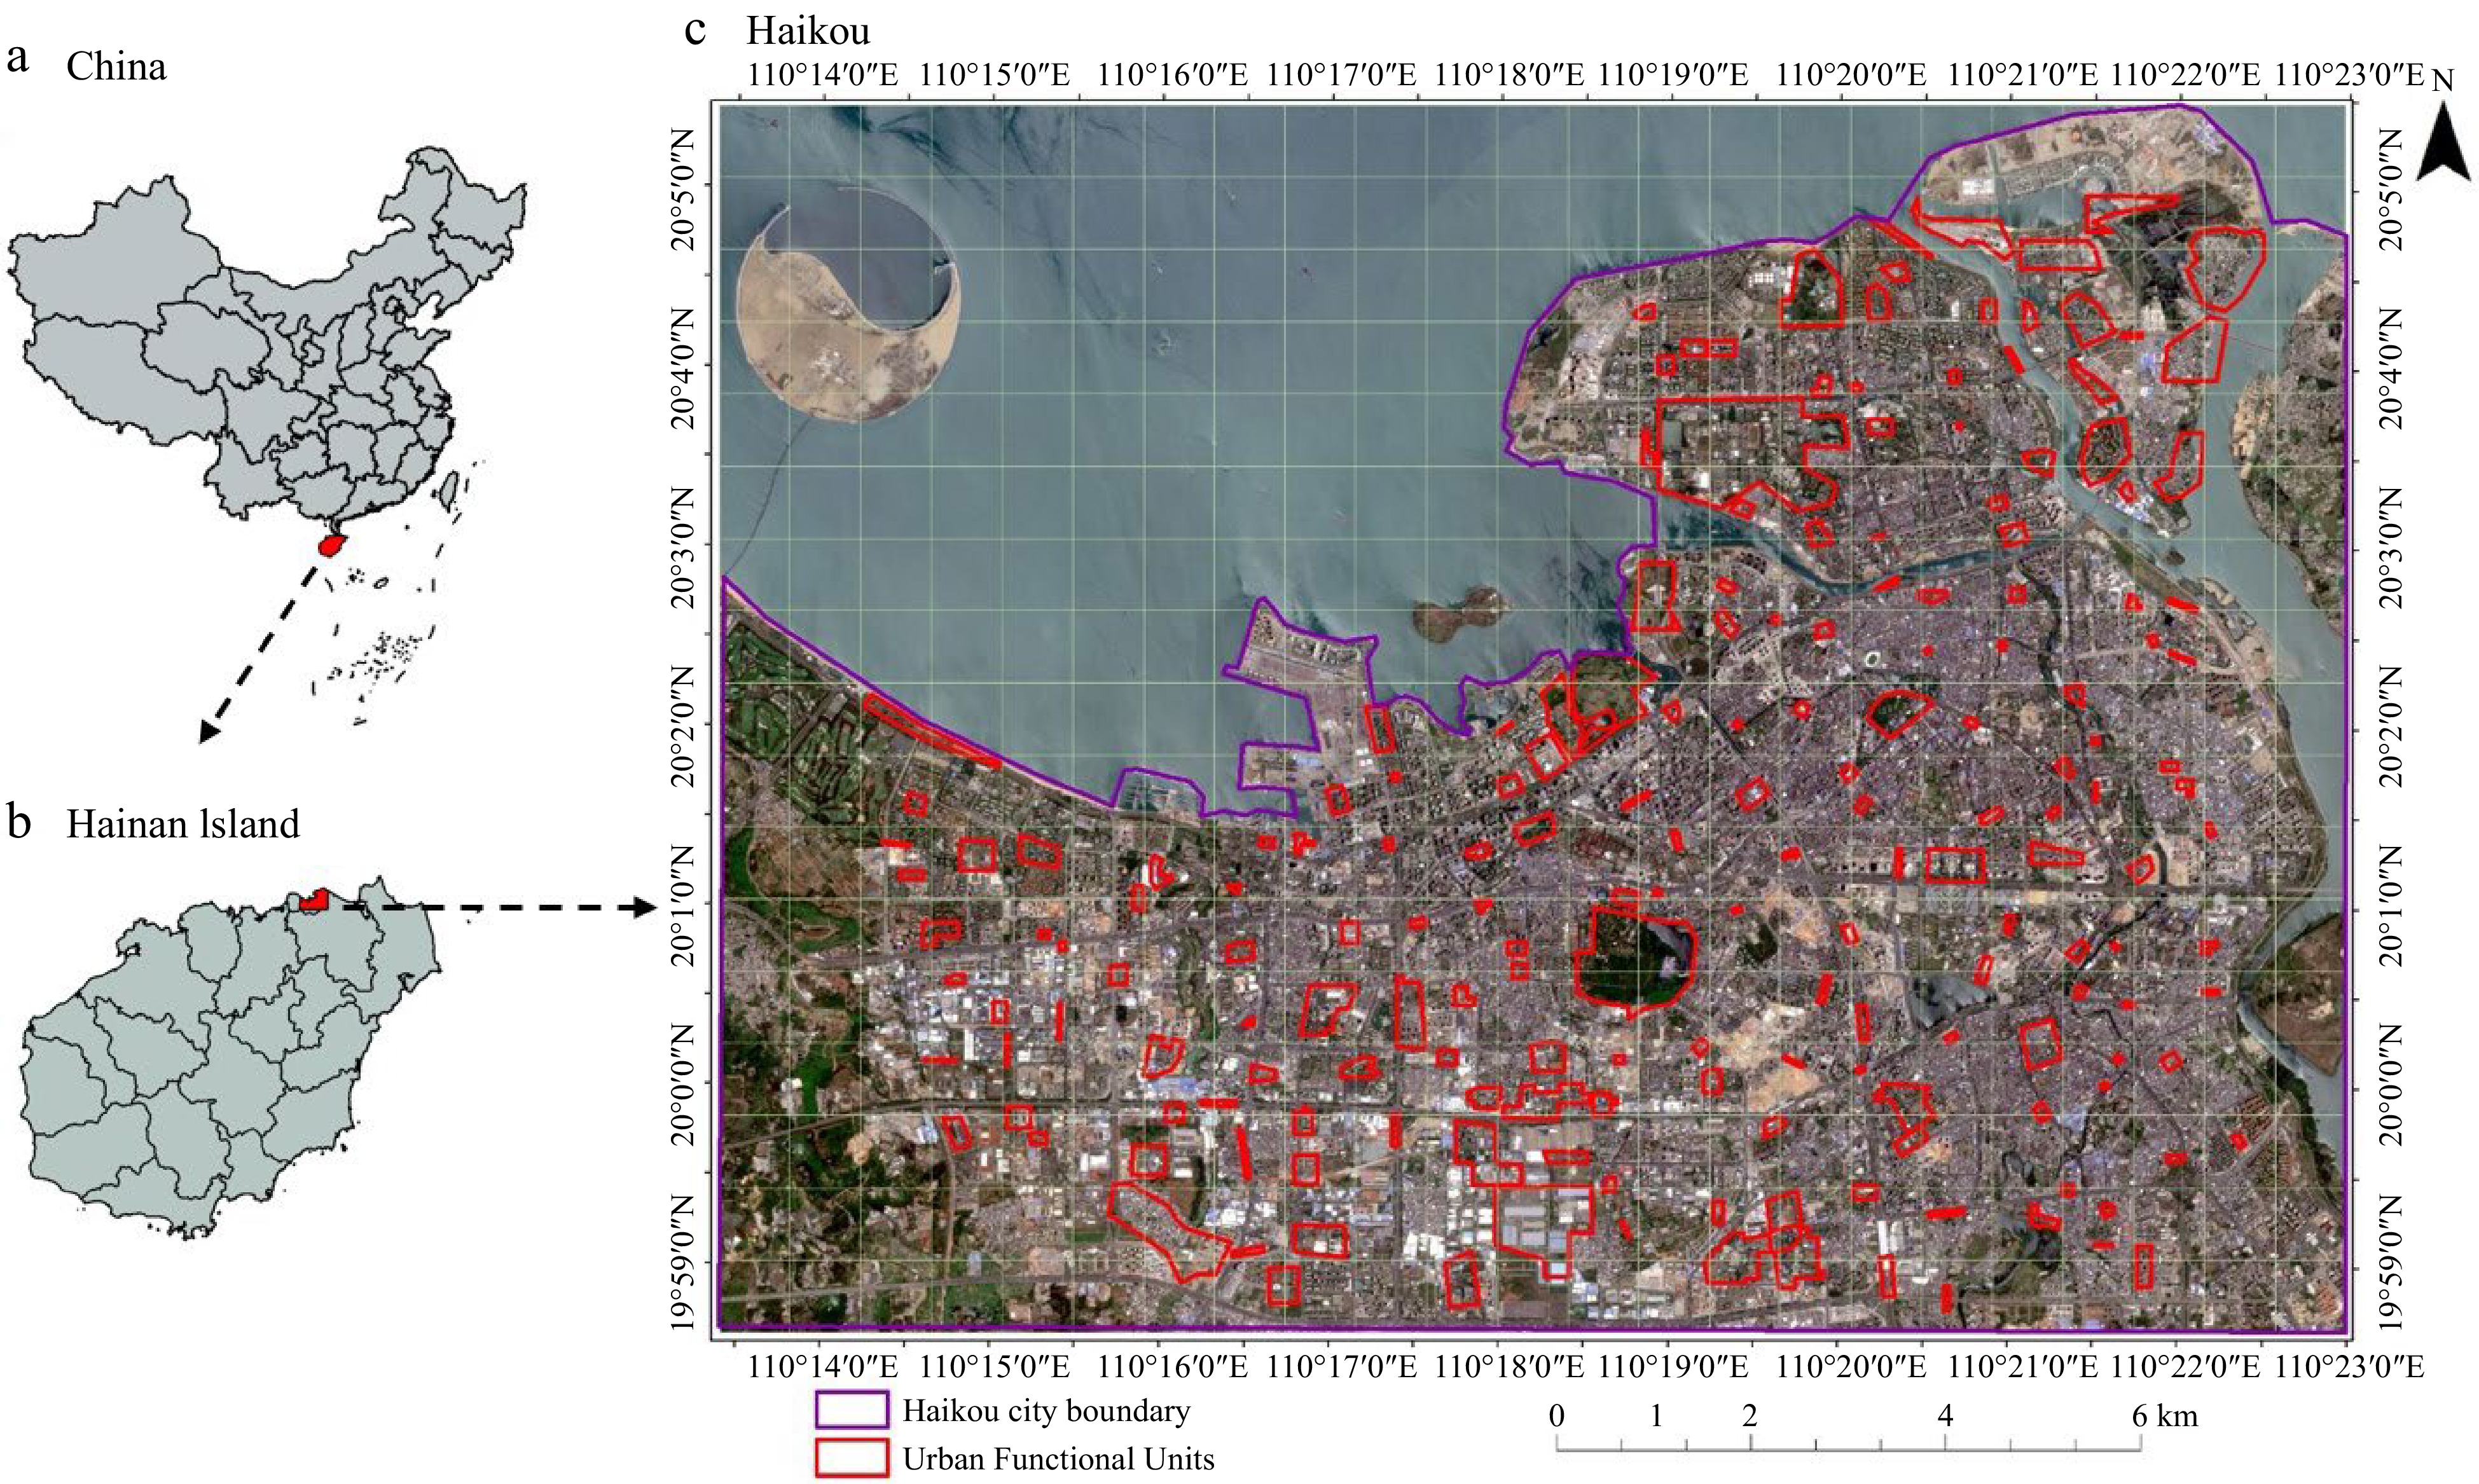
Figure 1.
(a) Map of China indicating the location of Hainan. (b) Map of Hainan indicating the assessment areas for UGS drivers. (c) Satellite map of Haikou (
www.google.com/maps ) displaying the 190 urban functional units (UFUs, red boundaries) surveyed within the Haikou study region (purple line). -
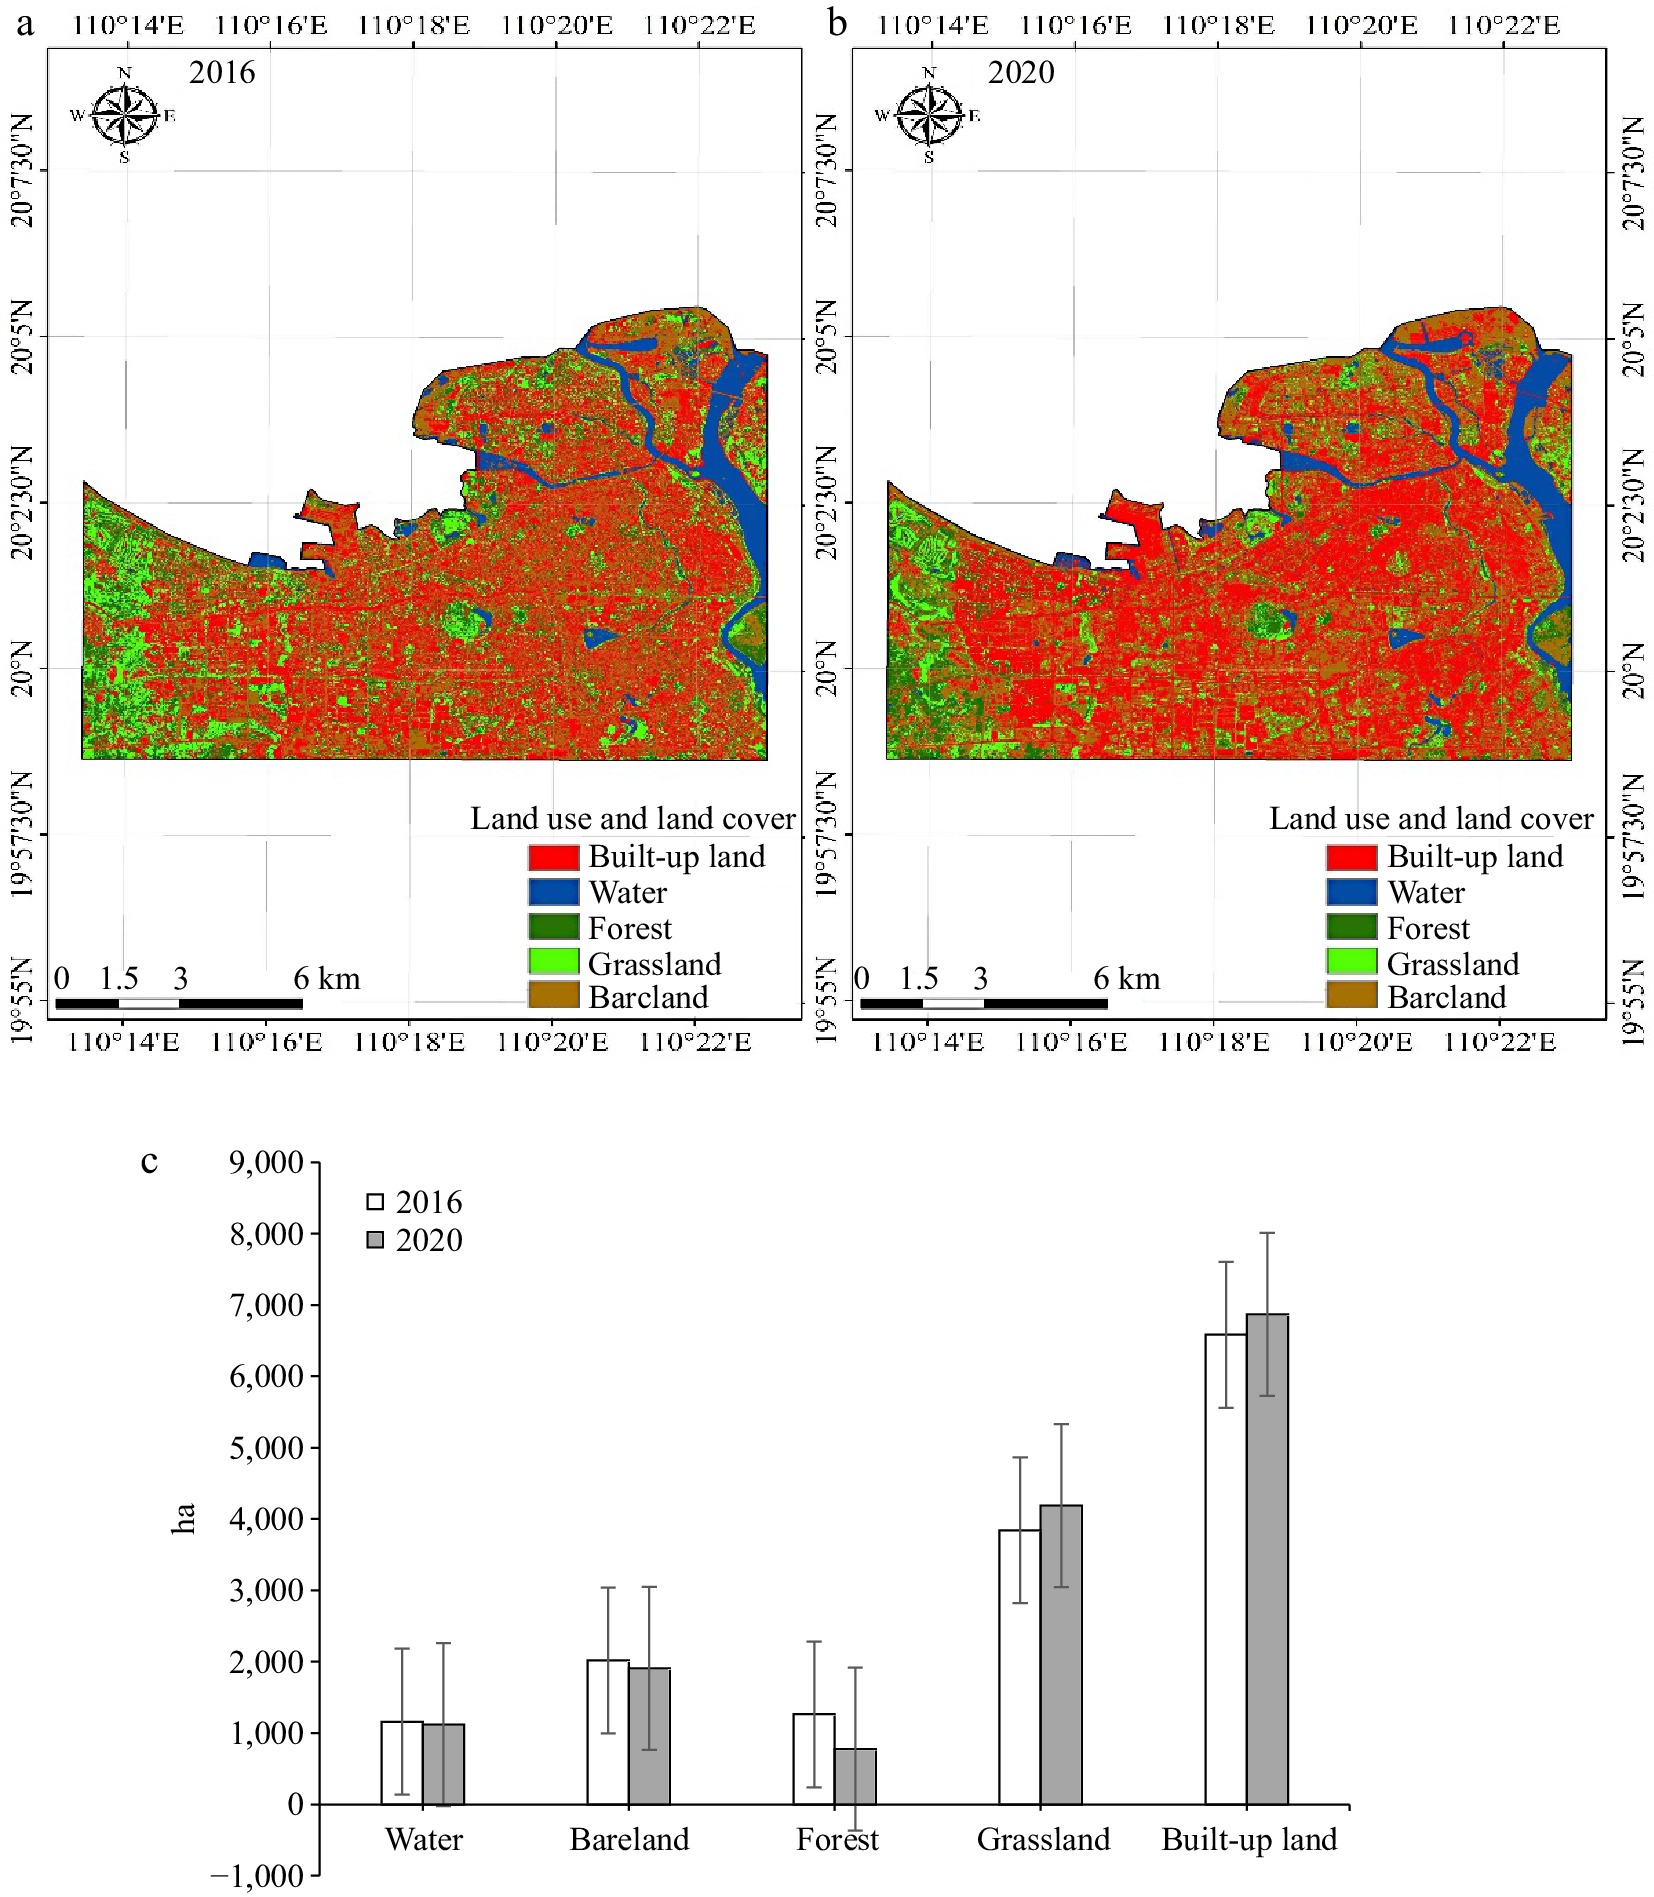
Figure 2.
Landuse of Haikou in (a) 2016 and (b) 2020 and (c) landuse change in Haikou City.
-
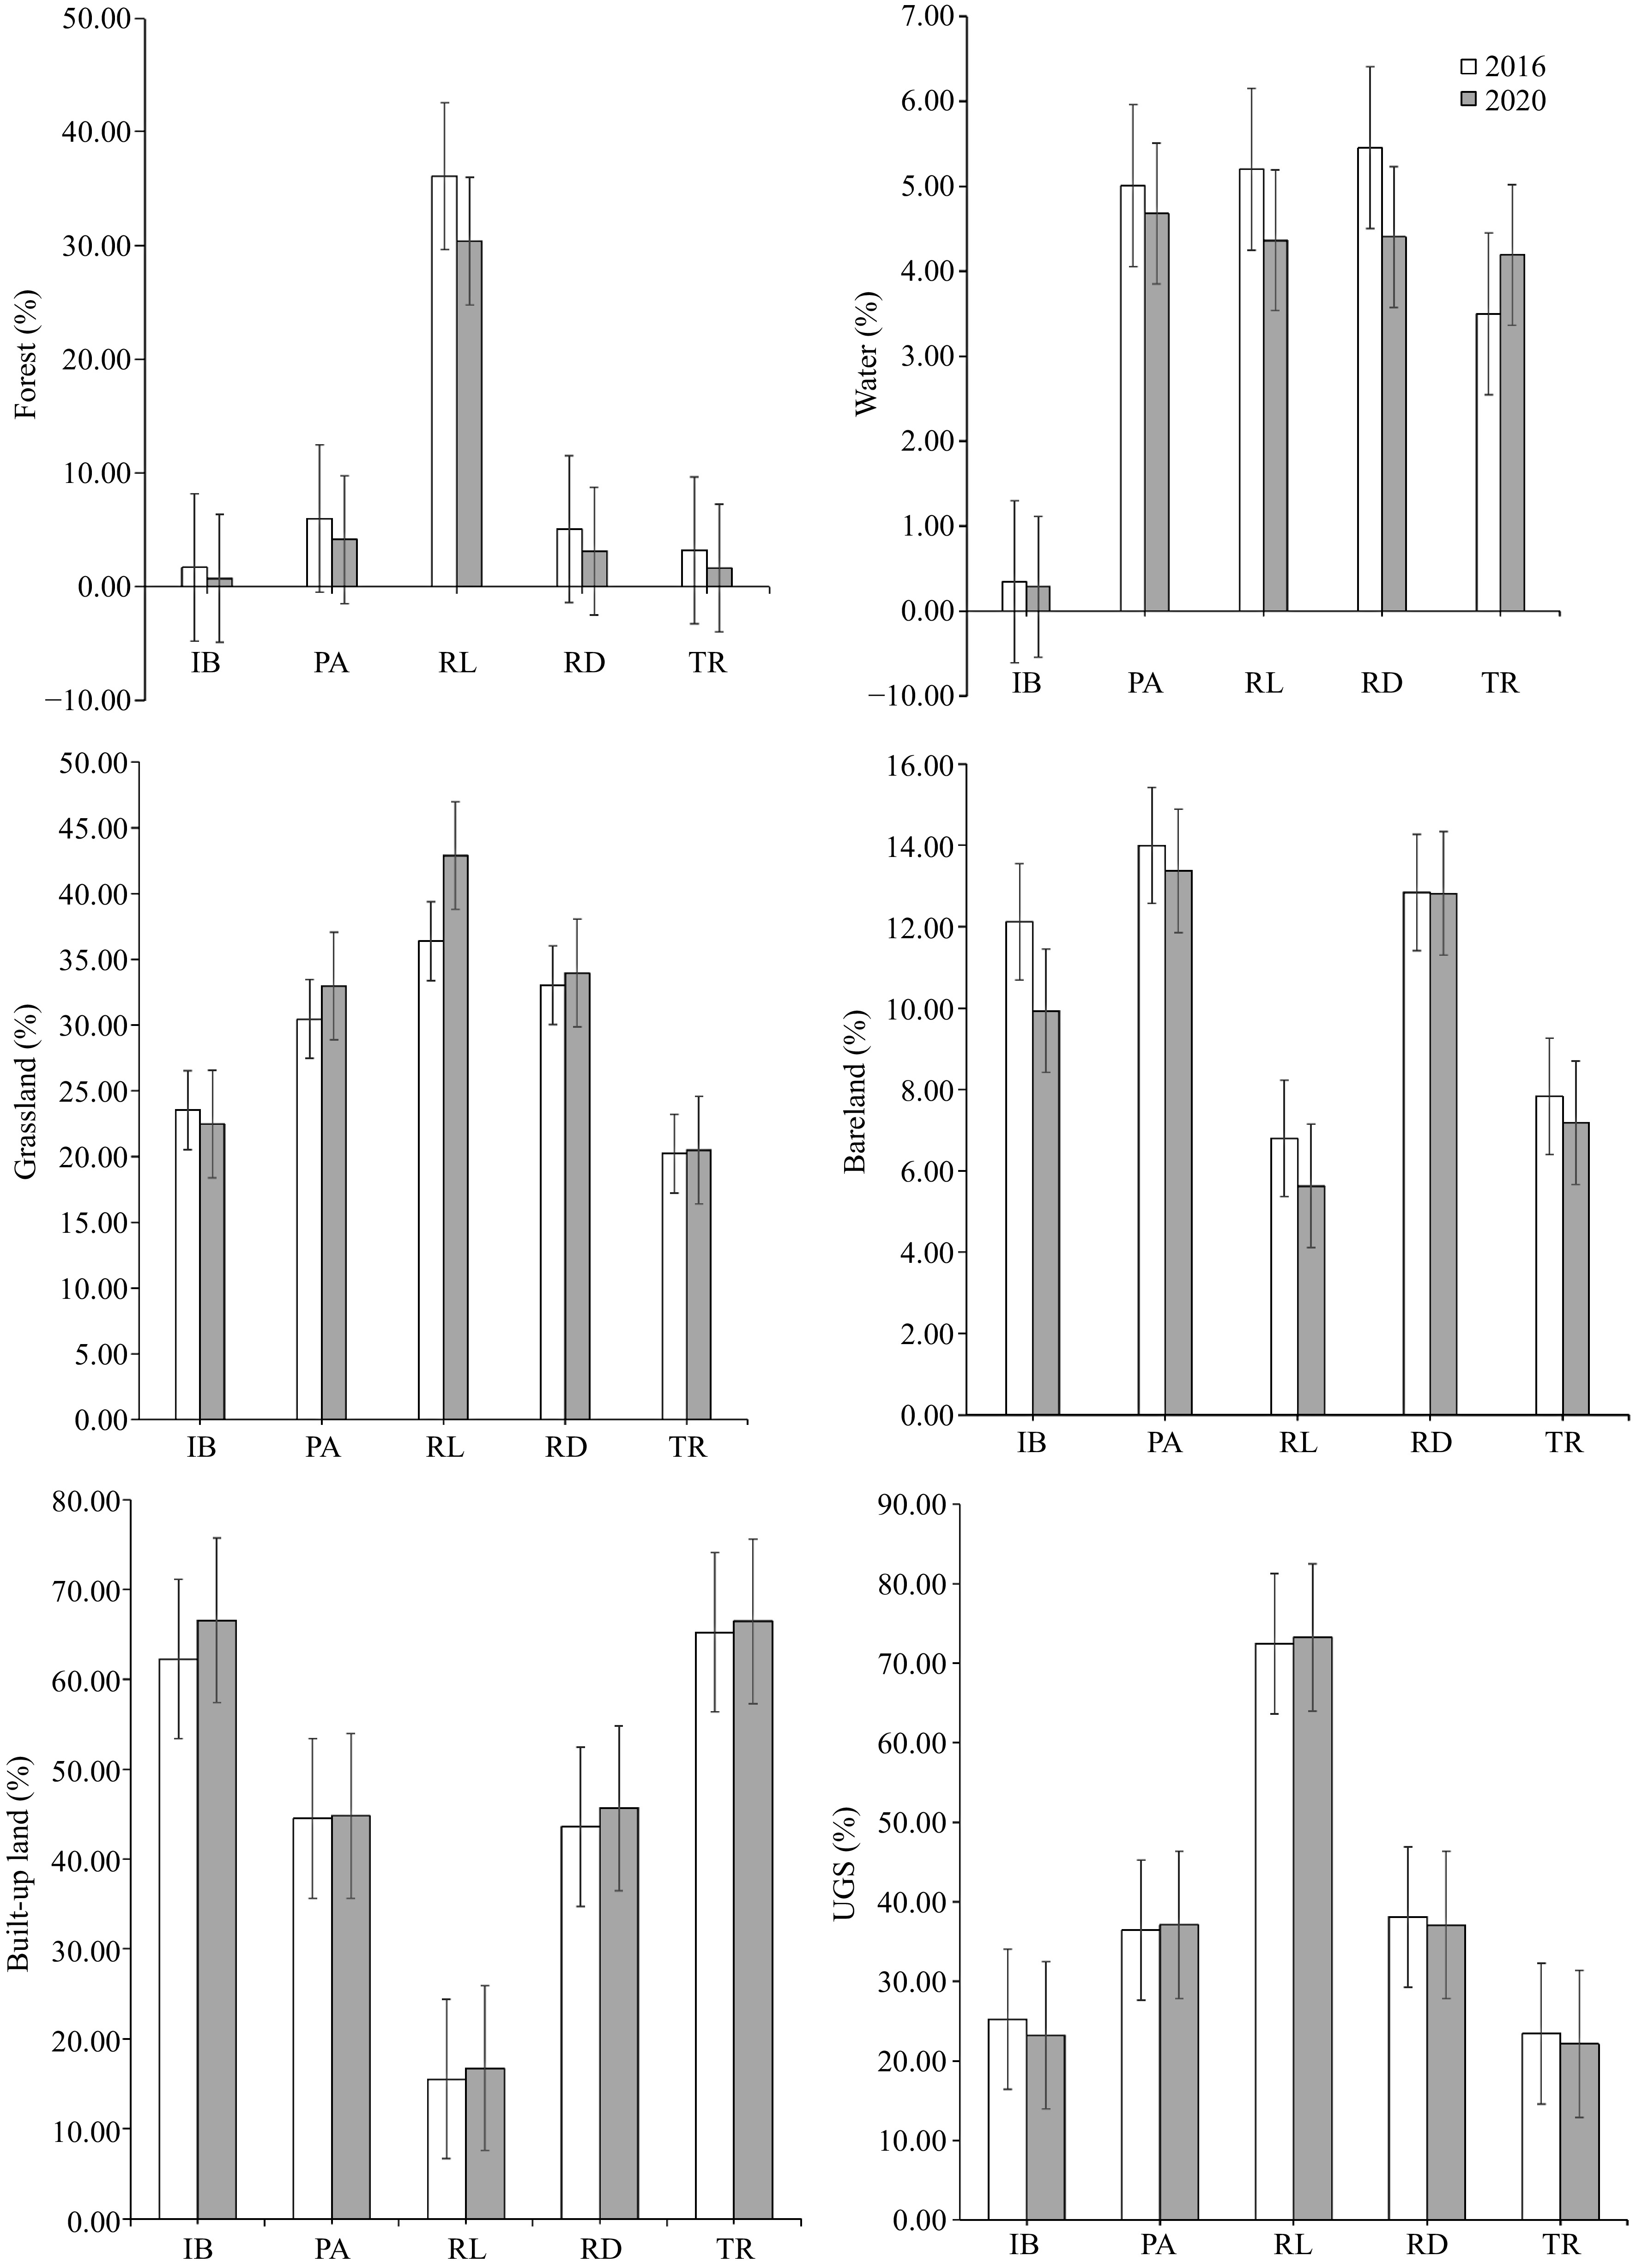
Figure 3.
Landuse and UGS in primary UFUs in Haikou in 2016 and 2020. Among them, IB: Industry and business districts, PA: Public affairs service districts, RL: Recreation and leisure districts, RD: Residential districts, TR: Transportation.
-
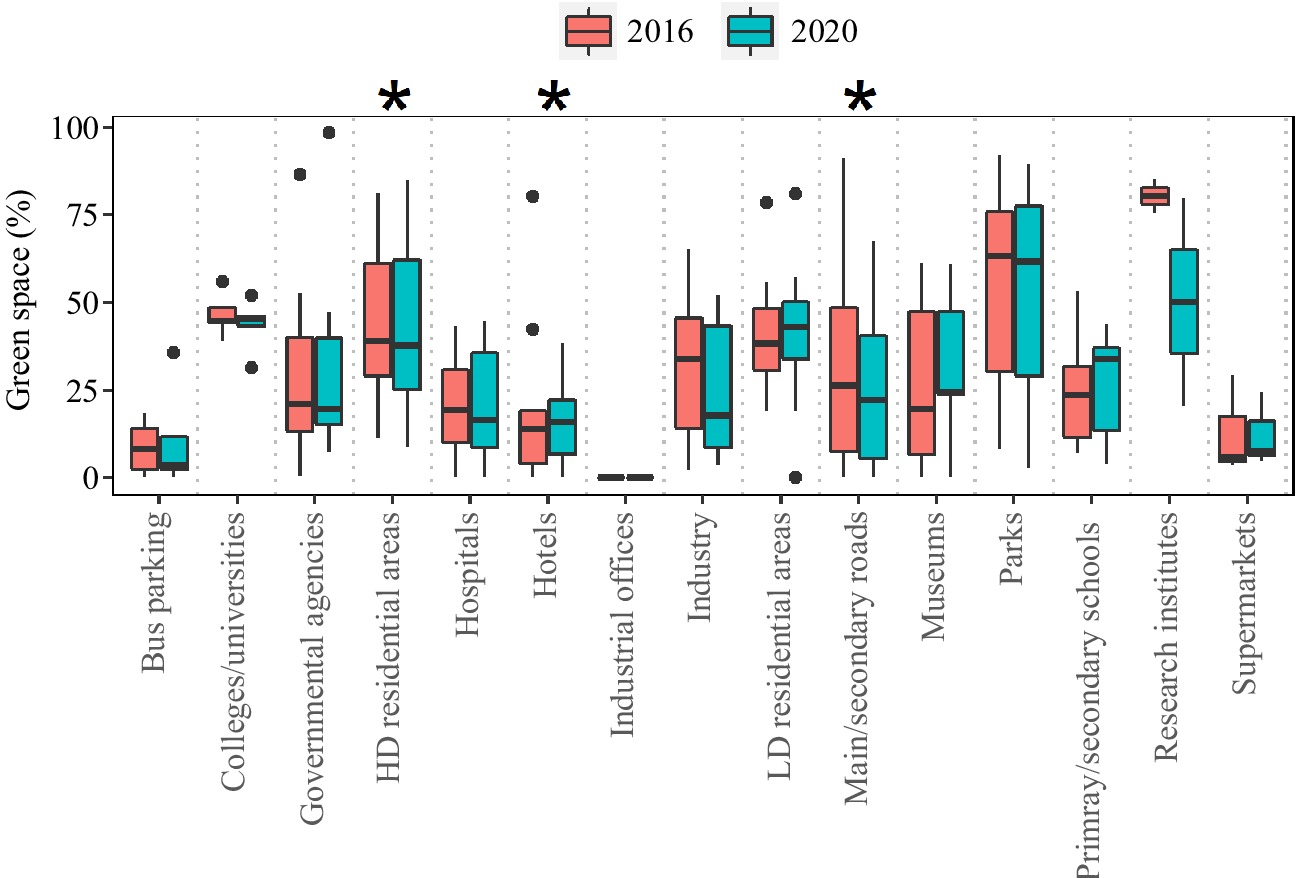
Figure 4.
Proportion of green space (area covered in vegetation) in secondary UFUs in 2016 and 2020 in Haikou city. * indicate significant differences between 2016 and 2020 based on Wilcoxon tests.
-
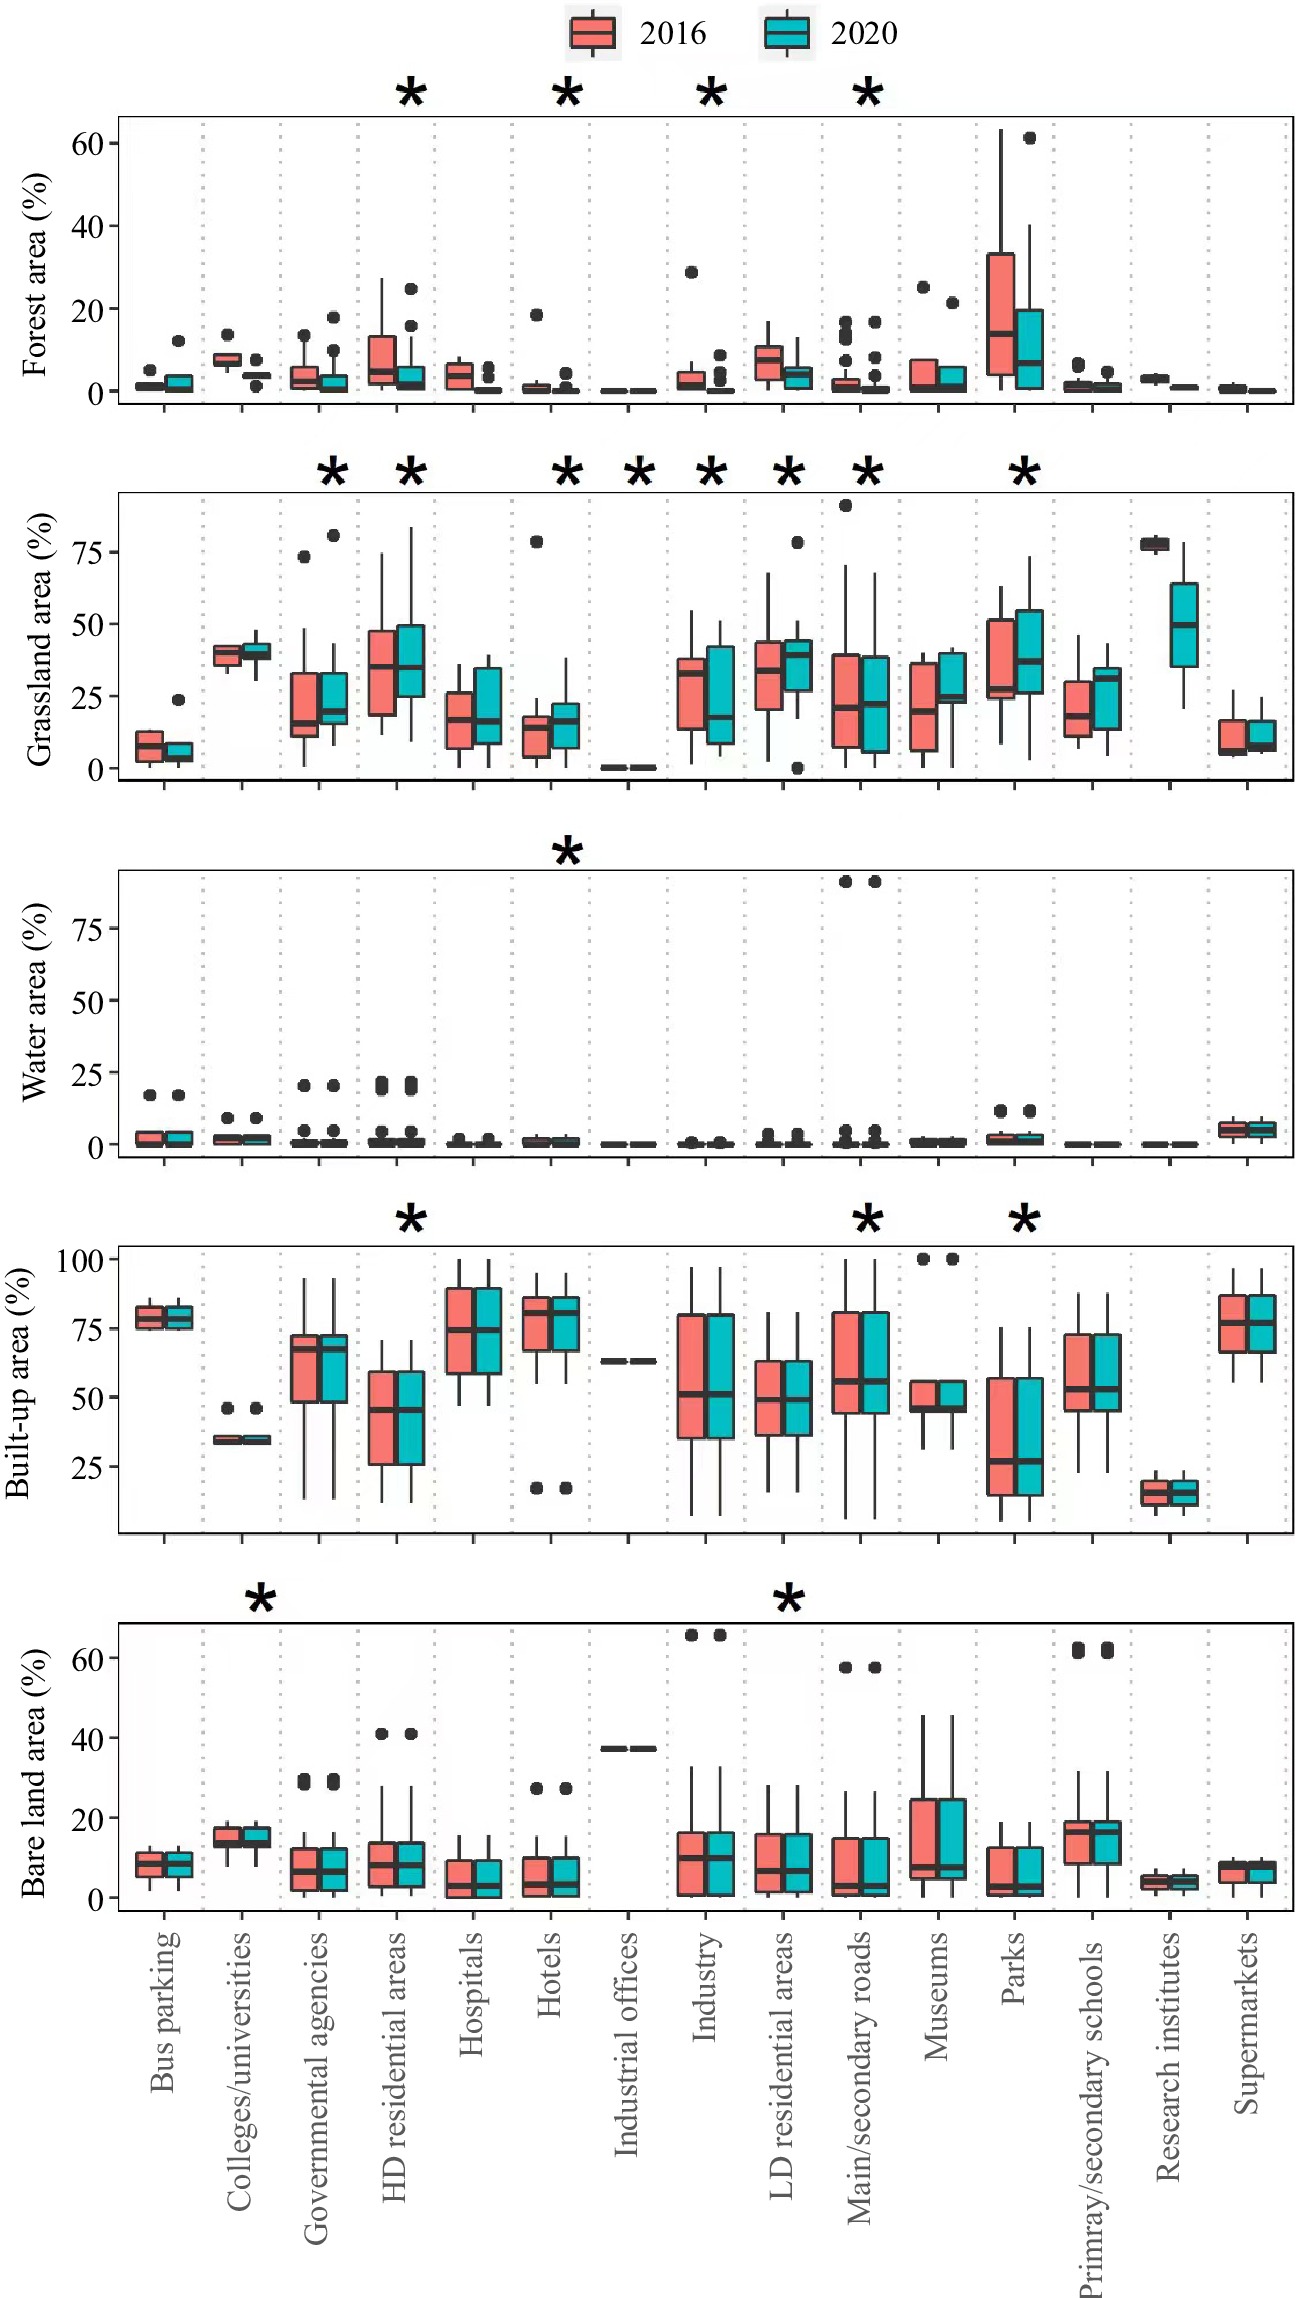
Figure 5.
Proportion of landuse in secondary UFUs in 2016 and 2020 in Haikou city. * indicate significant differences between 2016 and 2020 based on Wilcoxon tests.
-
Primary UFUs Secondary UFUs Polygons included Public affairs service districts Governmental Agencies 18 Colleges/universities 7 Primary/Middle Schools 18 Research institutes 4 Hospitals 12 Industry and business districts Industry 12 Hotels 11 Industrial offices 9 Supermarkets 3 Residential districts Low-density residential areas
(lower than six stories)5 High-density residential areas (higher than six stories) 43 Recreation and leisure districts Parks 7 Museums 5 Transportation Main/secondary roads 28 Bus parking 5 Undeveloped land Wetland 3 Total 190 Table 1.
The number of primary and secondary urban functional units (UFUs) sampled in Haikou.
-
Classes Definition Built-up land Land under construction inside the city area or its surroundings; including buildings and construction sites. Forest land Forested areas, native or planted; composed of tall trees and a dense canopy. Water Any water body or water resource in the area, including the sea, rivers, streams, dams, and ponds. Grassland Natural or planted grassy areas dominated by graminoids and forbs. Bare land Any area of exposed soil. Found on sites under construction, underdeveloped roads, sandpits, or sand sources. Table 2.
Land use land cover classes and definitions.
-
Landuse 2016 2020 Producer accuracy User accuracy Producer accuracy User accuracy Water 100% 100% 100% 100% Bare land 100% 60% 100% 50% Forest area 75% 90% 69% 90% Grassland 86% 60% 67% 40% Built-up land 76% 100% 74% 100% Overall accuracy 85.71% 81.25% Table 3.
Summary of mapping accuracy assessment.
-
Land use and land cover Primary UFUs Construction age
(β coefficient, n = 190)Housing price
(β coefficient, n = 190)Population density
(β coefficient, n = 190)R2 Water area Industry and business −0.142 0.127 −0.098 0.052 Public service −0.000 −0.156 0.302 0.041 Recreation and leisure 0.019 −0.172 −0.136 0.058 Residential −0.612*** 0.018 −0.188 0.430*** Transportation 0.095 −0.107 0.099 0.033 Bare land area Industry and business 0.106 −0.253 0.384* 0.223 Public service 0.027 0.635*** 0.203 0.656*** Recreation and leisure 0.089 −0.038 −0.070 0.022 Residential 0.370* −0.073 0.162 0.172* Transportation −0.023 −0.025 0.239 0.056 Forest area Industry and business −0.087 0.487 −0.146 0.271* Public service 0.042 0.252 −0.252 0.027 Recreation and leisure 0.187 −0.176 −0.156 0.138 Residential 0.544*** −0.091 0.216 0.373*** Transportation −0.534** 0.034 −0.075 0.319* Grassland area Industry and business −0.241 0.195 −0.139 0.130 Public service −0.045 −0.772*** −0.215** 0.921*** Recreation and leisure 0.138 −0.442 0.092 0.228 Residential −0.878*** −0.074 −0.097 0.776*** Transportation 0.118 0.023 0.015 0.014 Built-up area Industry and business −0.022 −0.398* 0.023 0.161 Public service 0.099 0.139 −0.154 0.016 Recreation and leisure −0.111 0.181 0.126 0.088 Residential −0.009 0.314* −0.060 0.102 Transportation 0.205 −0.145 −0.116 0.074 Significance codes: * p < 0.05, ** p < 0.01, *** p < 0.001. Table 4.
Multivariate regression analysis results of Landuse area with construction age, housing prices, and population density in primary UFUs of Haikou City in 2020.
Figures
(5)
Tables
(4)