-
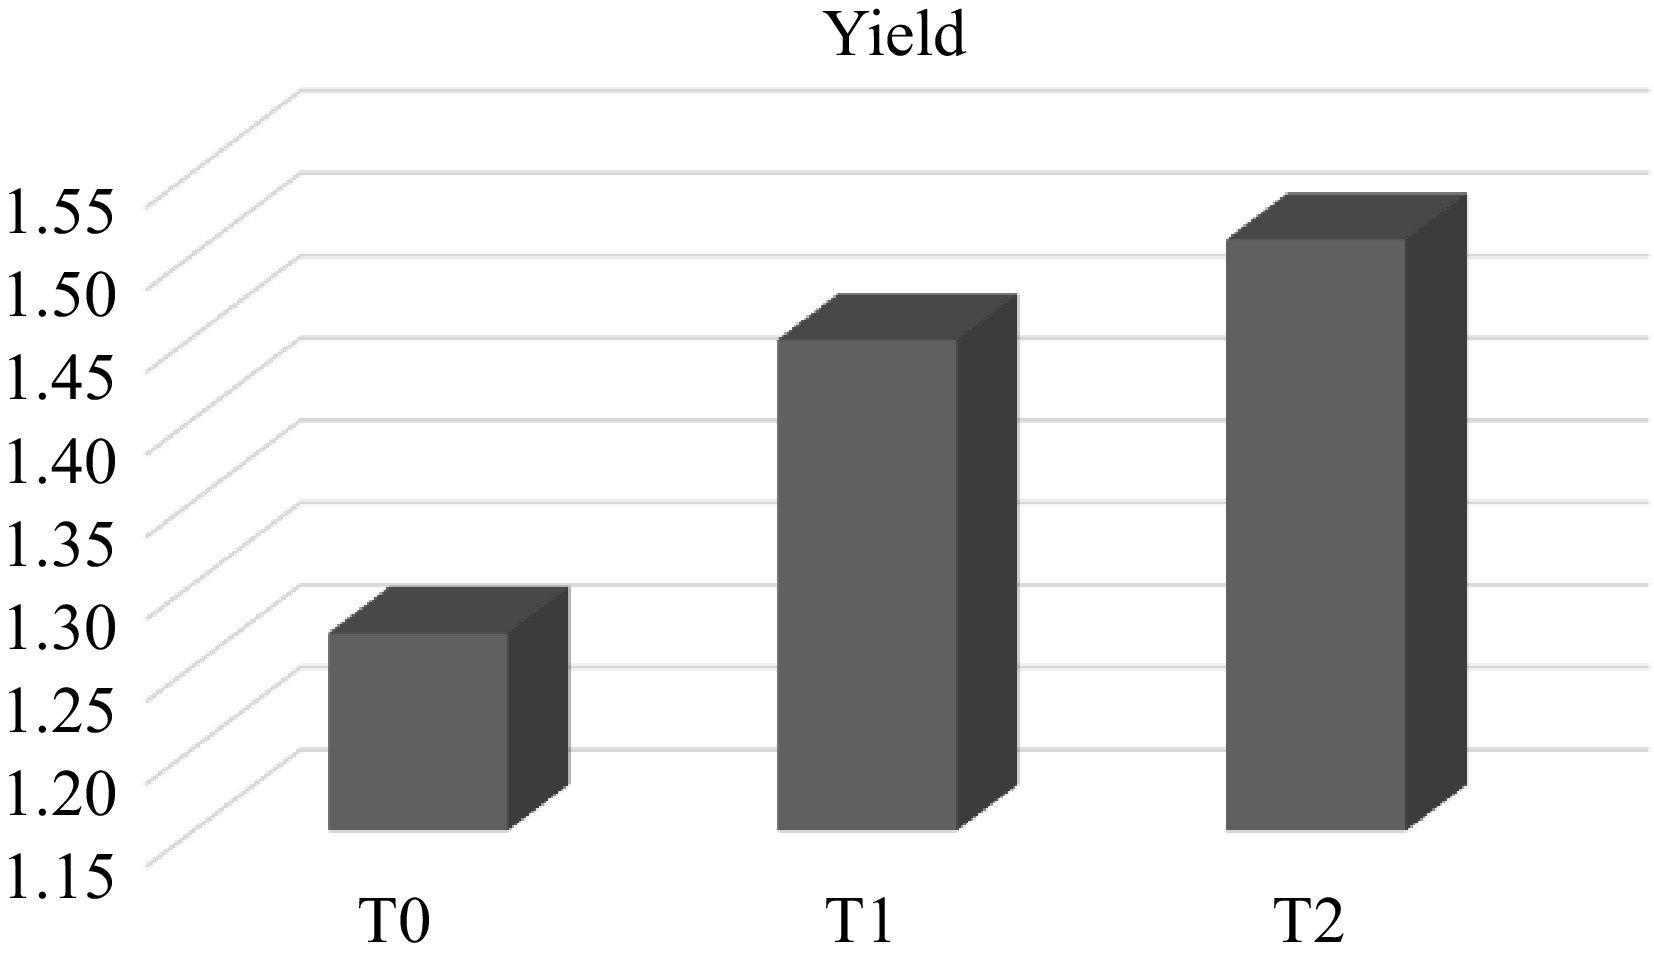
Figure 1.
Total yield performance of grey oyster mushroom on different treated substrates.
-
Substrate/
treatmentComposition of substrate T0 (Control) 97.2% SD + 0.8% RB + 2% L T1 (Mixed) 60% RS + 22.2% EFB + 15% PPF + 0.8% RB + 2% L T2 (Mixed) 60% OPF + 22.2% EFB + 15% SD + 0.8% RB + 2% L OPF, Oil Palm Frond; EFB, Empty Fruit Bunch; PPF, Palm Pressed Fibre; SD, Sawdust; RB, Rice bran; L, Lime. Table 1.
Substrate composition.
-
Items Extremely
like 4Like 3 Dislike 2 Extremely dislike 1 Number of crackers Cracker in every bite Cracker in 75% chips Cracker in 50% chips < 50% cracker Texture/
feelConsistently crispy and crunchy chewy Chewy middle, crispy edges Crunchy
only and
not crispyLess crunchy and not crispy Colour Even golden brown Brown with pale centre Very brown Burned Richness Edible Less oily Medium oily High oily Table 2.
Survey form for the sensory evaluation of mushroom crackers.
-
Products Cost (RM)/block Yield/ block /selling price Yield performance/ income/block T0 (Sawdust commercial/control) 0.74 86.7 g/RM 1.12 100%/RM 0.38 T1 (RS + EFB + PPF) 0.75 93 g/RM 1.2 107% (7% >)/RM 0.53 T2 (OPF + EFB + sawdust) 0.60 100 g/RM 1.30 115% (15% >)/RM 0.70 Table 3.
Income performance of each of the substrate treated mushroom yield.
-
Sample Mushroom cracker (1 g) Commercial potato
cracker (1 g)Protein (%) 2.19 ± 0.90 2.22 ± 0.10 Fat (%) 11.335 ± 0.3061 12.8283 ± 0.2475 Ash (%) 2.0567 ± 0.1201 1.4667 ± 0.2566 Moisture (%) 7.8733 ± 0.2219 6.15 ± 0.5 Carbohydrate (%) 76.5467 ± 0.12503 77.3350 ± 0.5327 Table 4.
Proximate analysis of mushroom cracker and commercial cracker.
-
Mushroom cracker Commercial potato cracker Sig.
(2-tailed)Mean S.D. Mean S.D. L* 55.89 1.0017 62.8033 0.1721 0.006 a* 6.75 1.7197 11.7267 0.5258 0.029 b* 18.1667 1.5016 31.55 0.7502 0.001 Table 5.
Independent t-test for colour analysis.
-
Mushroom cracker Commercial potato cracker Sig.
(2-tailed)Mean S.D. Mean S.D. Hardness (g) 1,117.00 126.74 2481.00 115.8836 0.000 Cohesiveness 1.00 0.1473 0.1867 0.0851 0.003 Springiness (mm) 6.49 0.8972 14.61 9.5103 0.215 Table 6.
Independent t-test for texture properties.
-
Scale Sensory attribute Acceptable Texture Colour Richness Overall acceptance Extremely like 74% 74% 38% 78% 66% Like 22% 26% 62% 22% 33% Dislike 4% 0 0 0 1% Extremely dislike 0 0 0 0 0 Table 7.
Sensory evaluation of mushroom crackers.
Figures
(1)
Tables
(7)