-
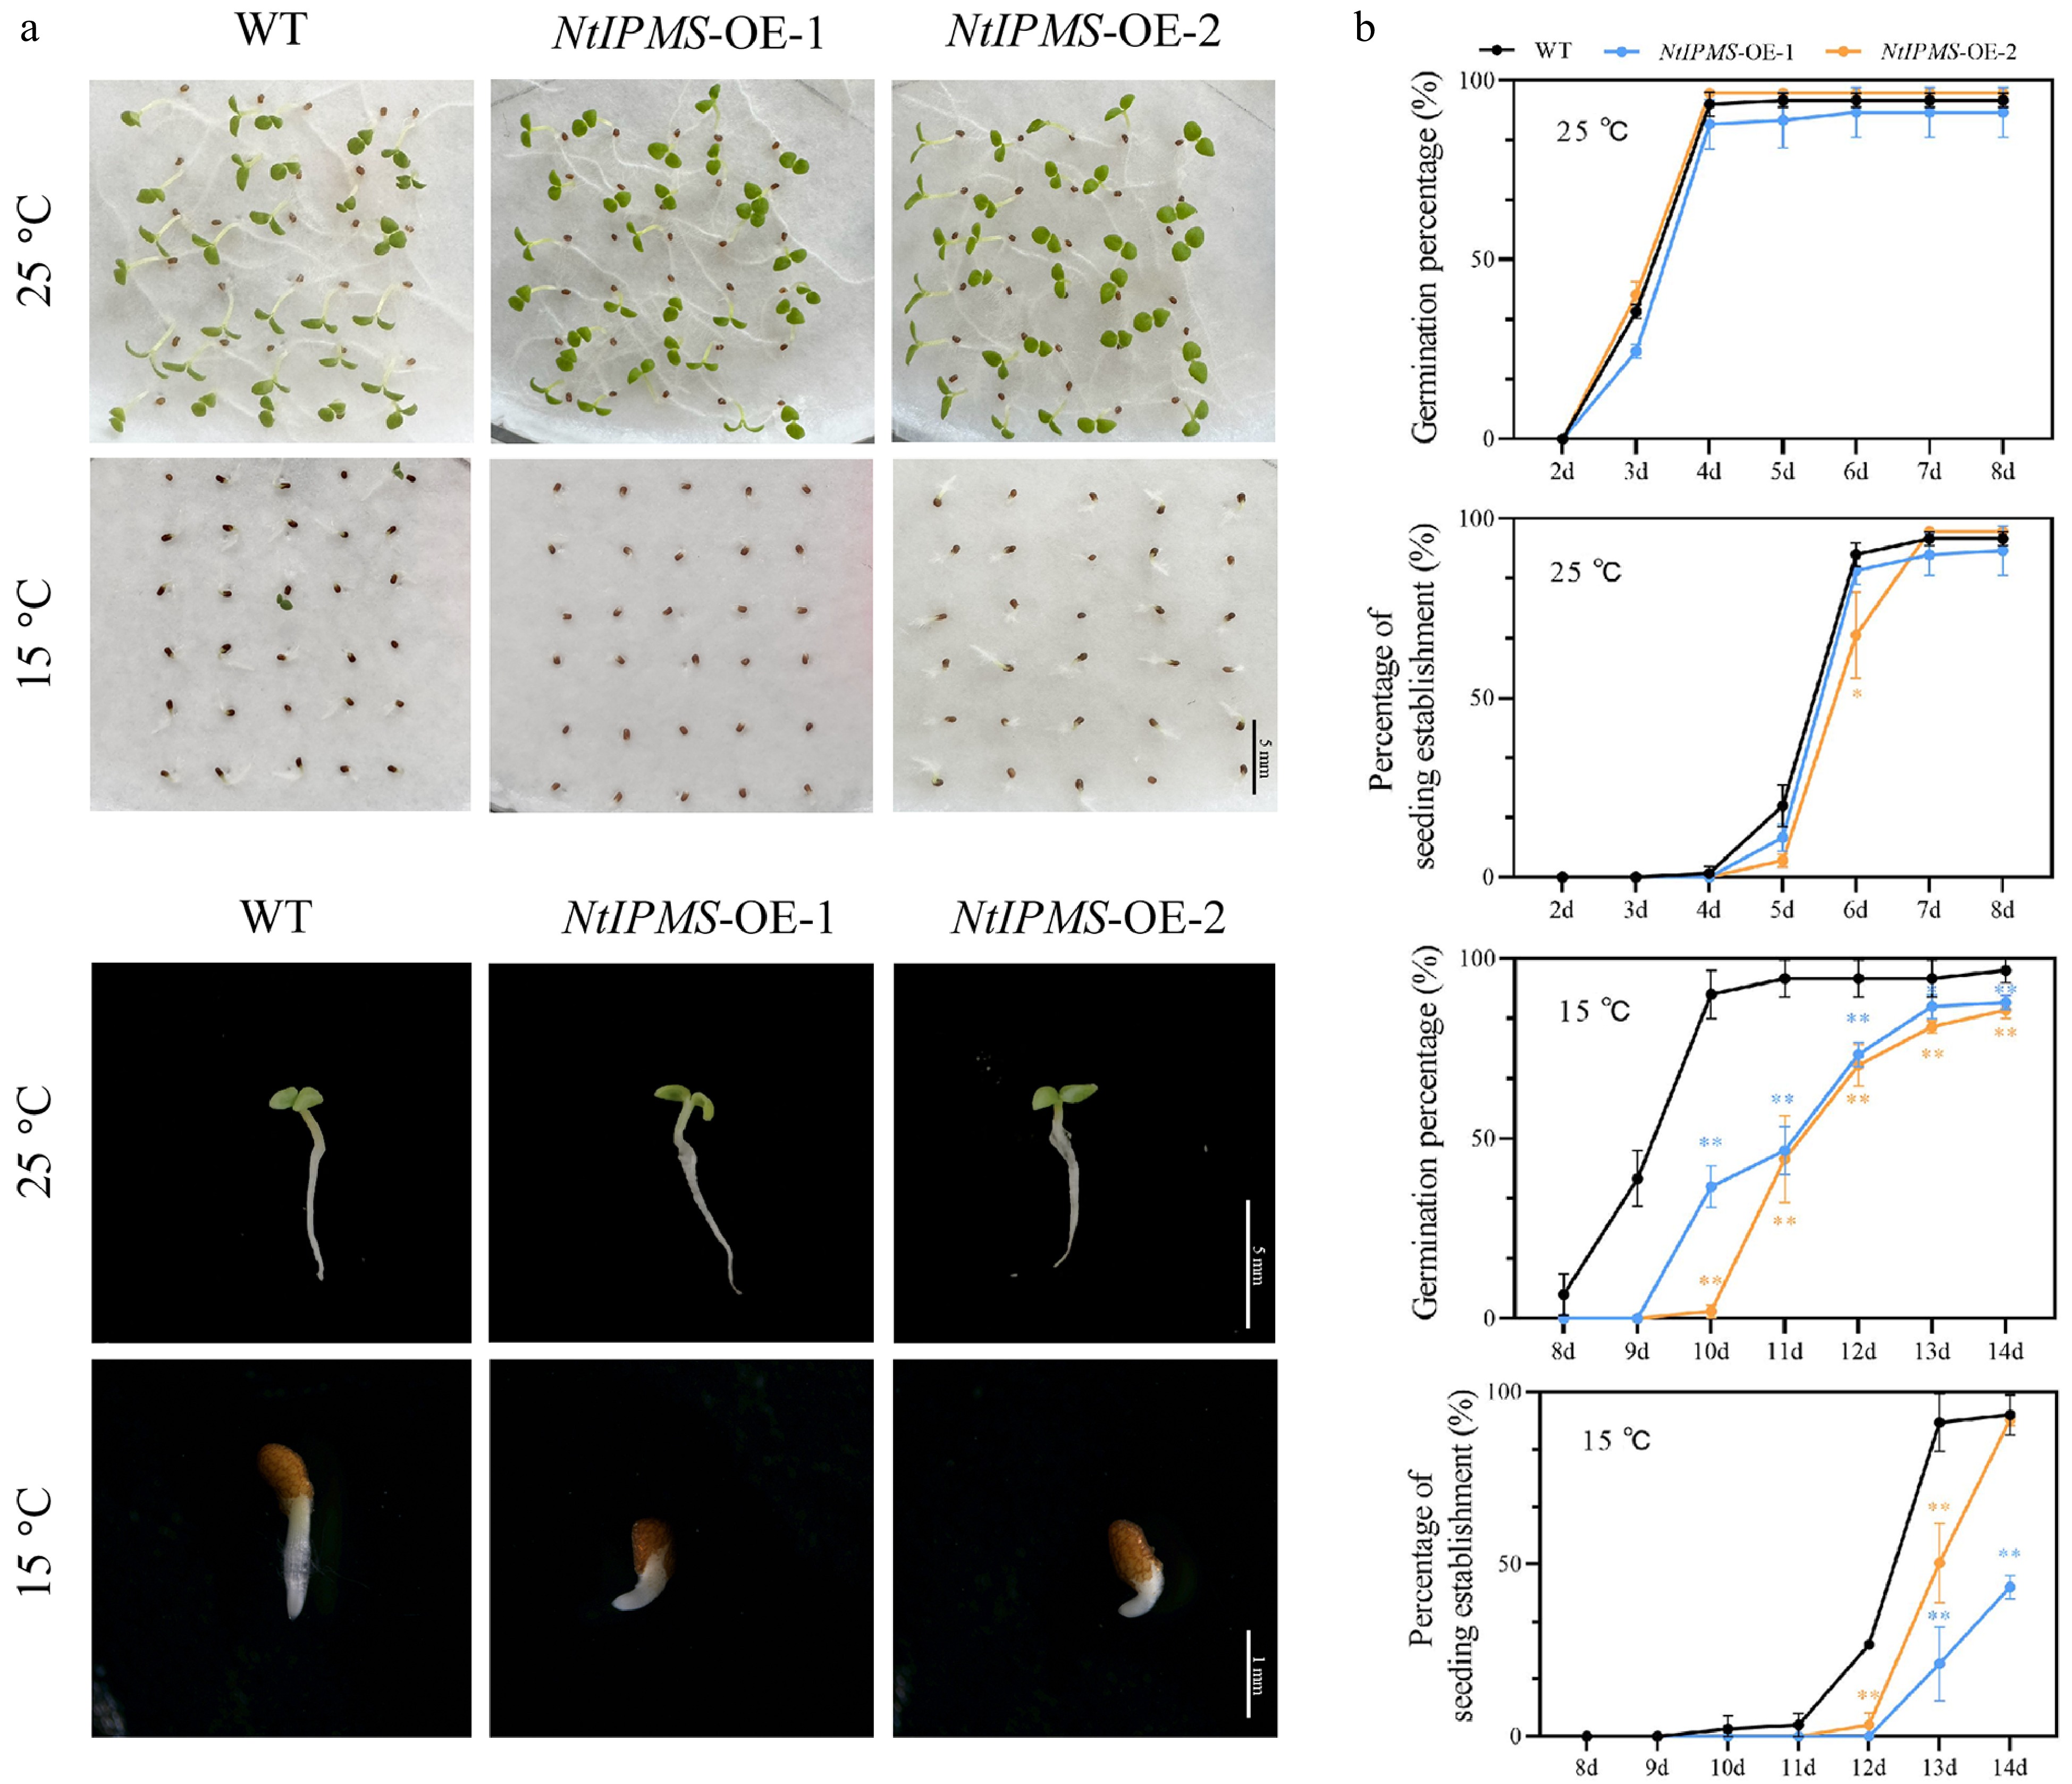
Figure 1.
Overexpression of NtIPMS reduces seed germination under cold stress in tobacco. (a) Representative images of seed germination under normal (25 °C) and cold stress (15 °C) conditions. Scale bars = 1 or 5 mm. (b) Comparison of germination percentage and percentage of seedling establishment in Yunyan 87 (WT) and NtIPMS-OE lines. Each point represents the mean ± standard deviation. n = 3. * and ** denote significant differences determined using Student's t-test at p < 0.05 and p < 0.01, respectively.
-
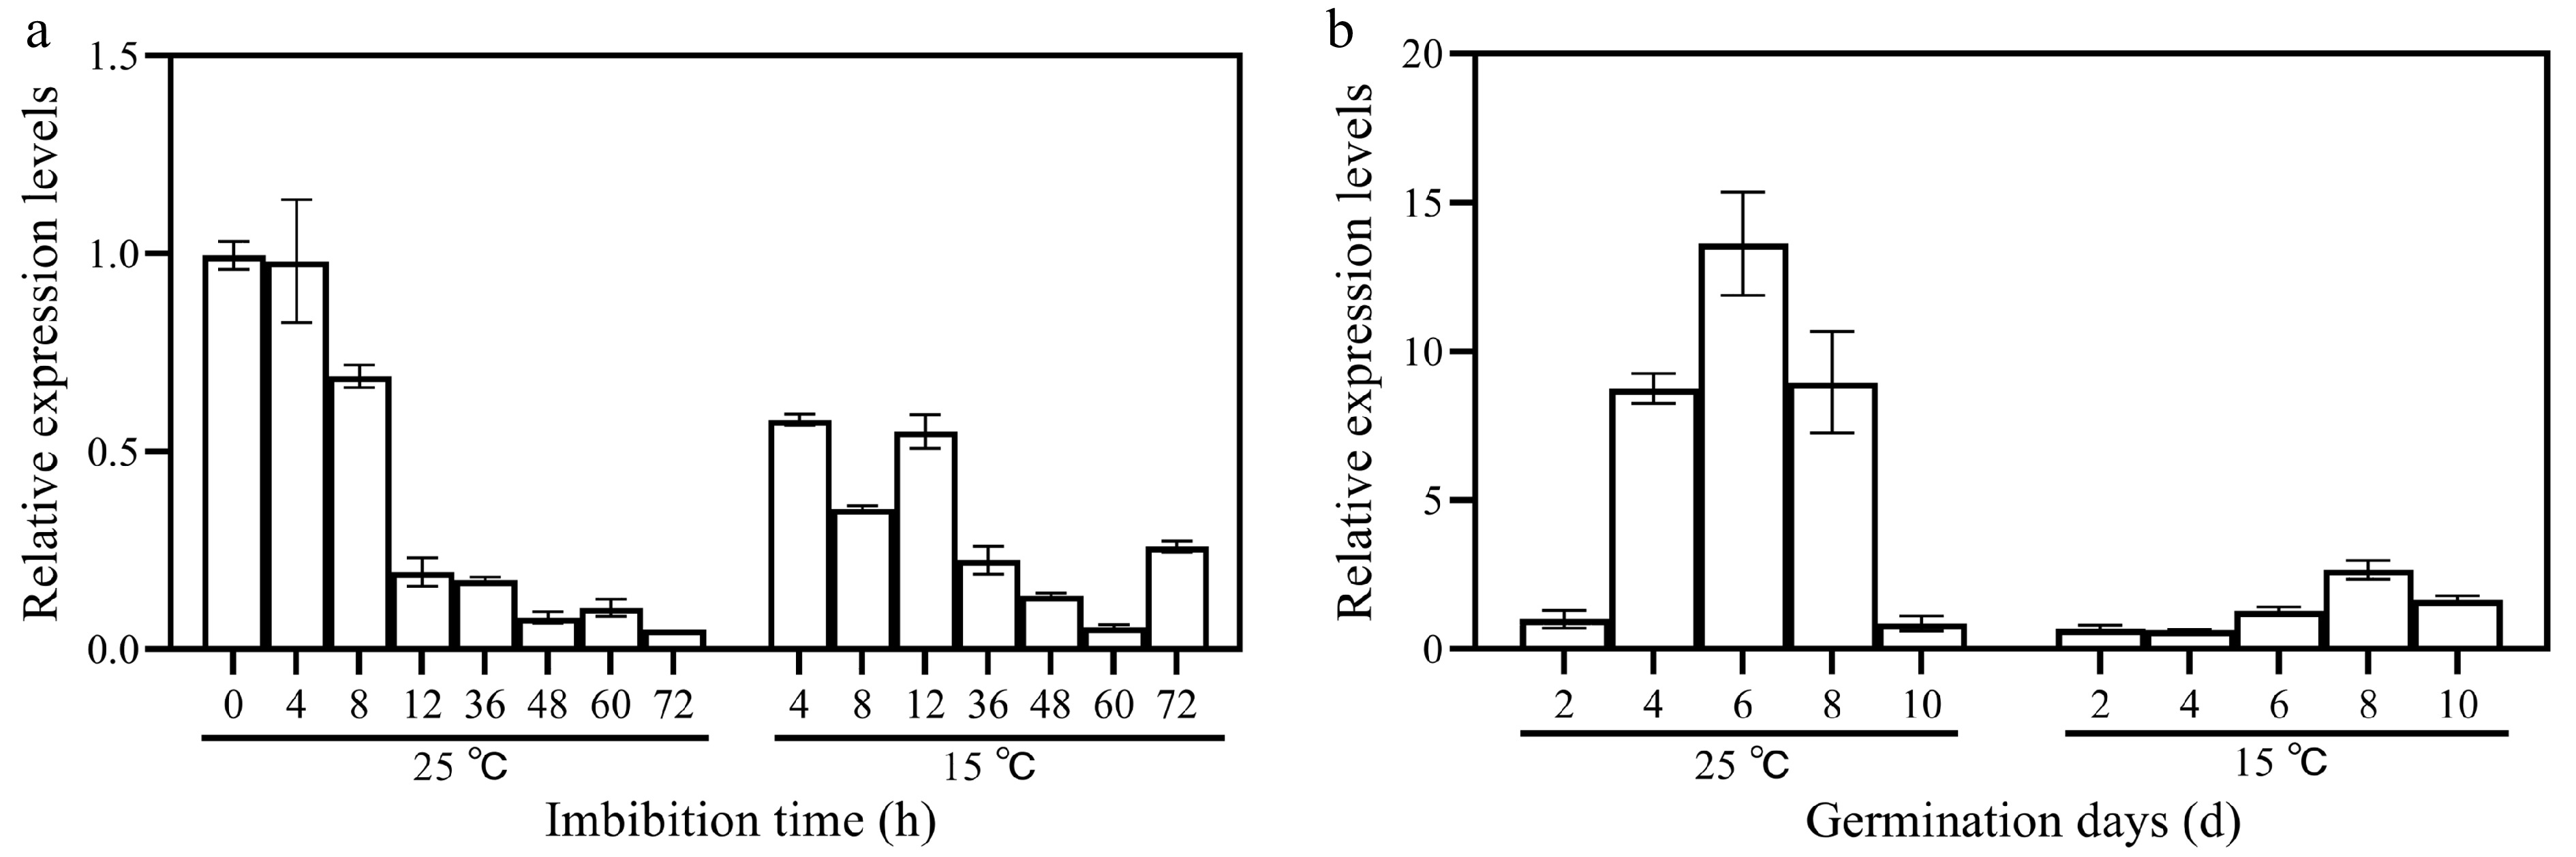
Figure 2.
Expression patterns of NtIPMS during seed germination under normal (25 °C) and cold stress (15 °C) conditions in tobacco. (a) Relative expression level of NtIPMS in Yunyan 87 tobacco during (a) the early germination stage and (b) the late germination stage determined via quantitative RT-PCR. NtEF1a gene was used as the internal control. Each column represents the mean ± standard deviation n = 3.
-
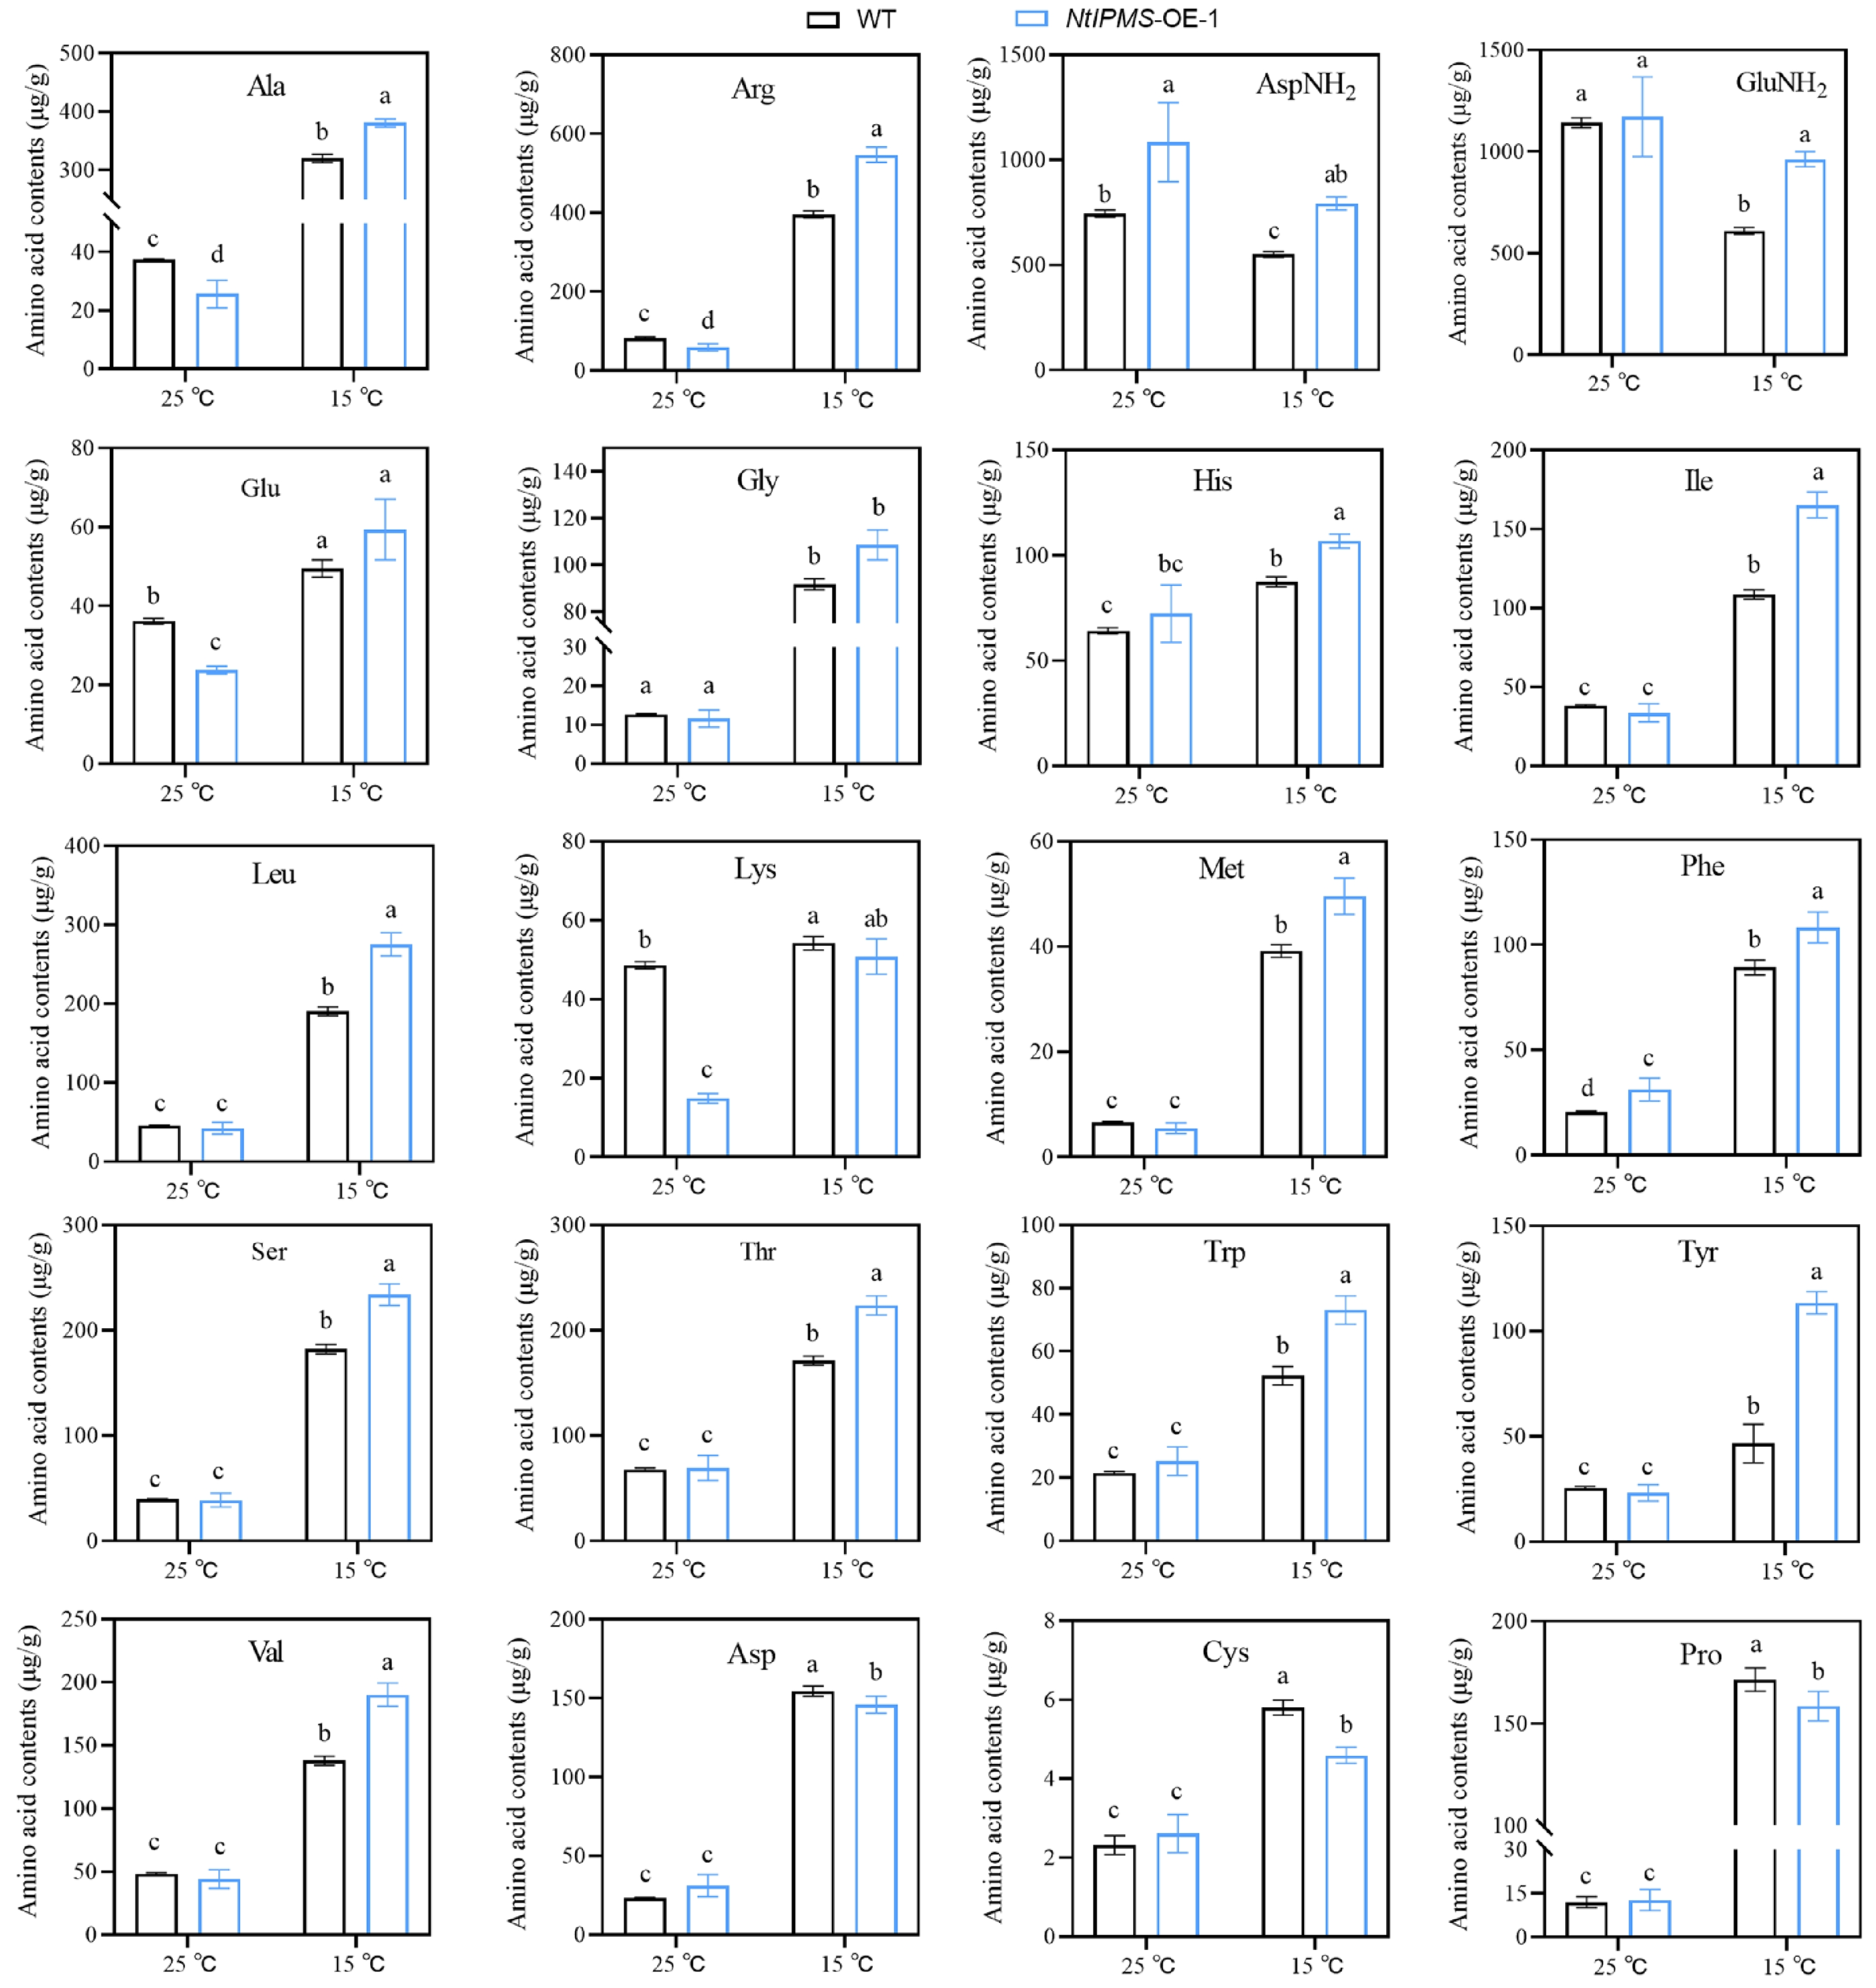
Figure 3.
Comparison of amino acids between Yunyan 87 (WT) and NtIPMS-OE-1 lines after 10 d germination under normal (25 °C) and cold stress (15 °C) conditions in tobacco. Each column represents the mean ± standard deviation. n = 3. Different letters indicate significant differences determined using Duncan's multiple range test: p < 0.05.
-
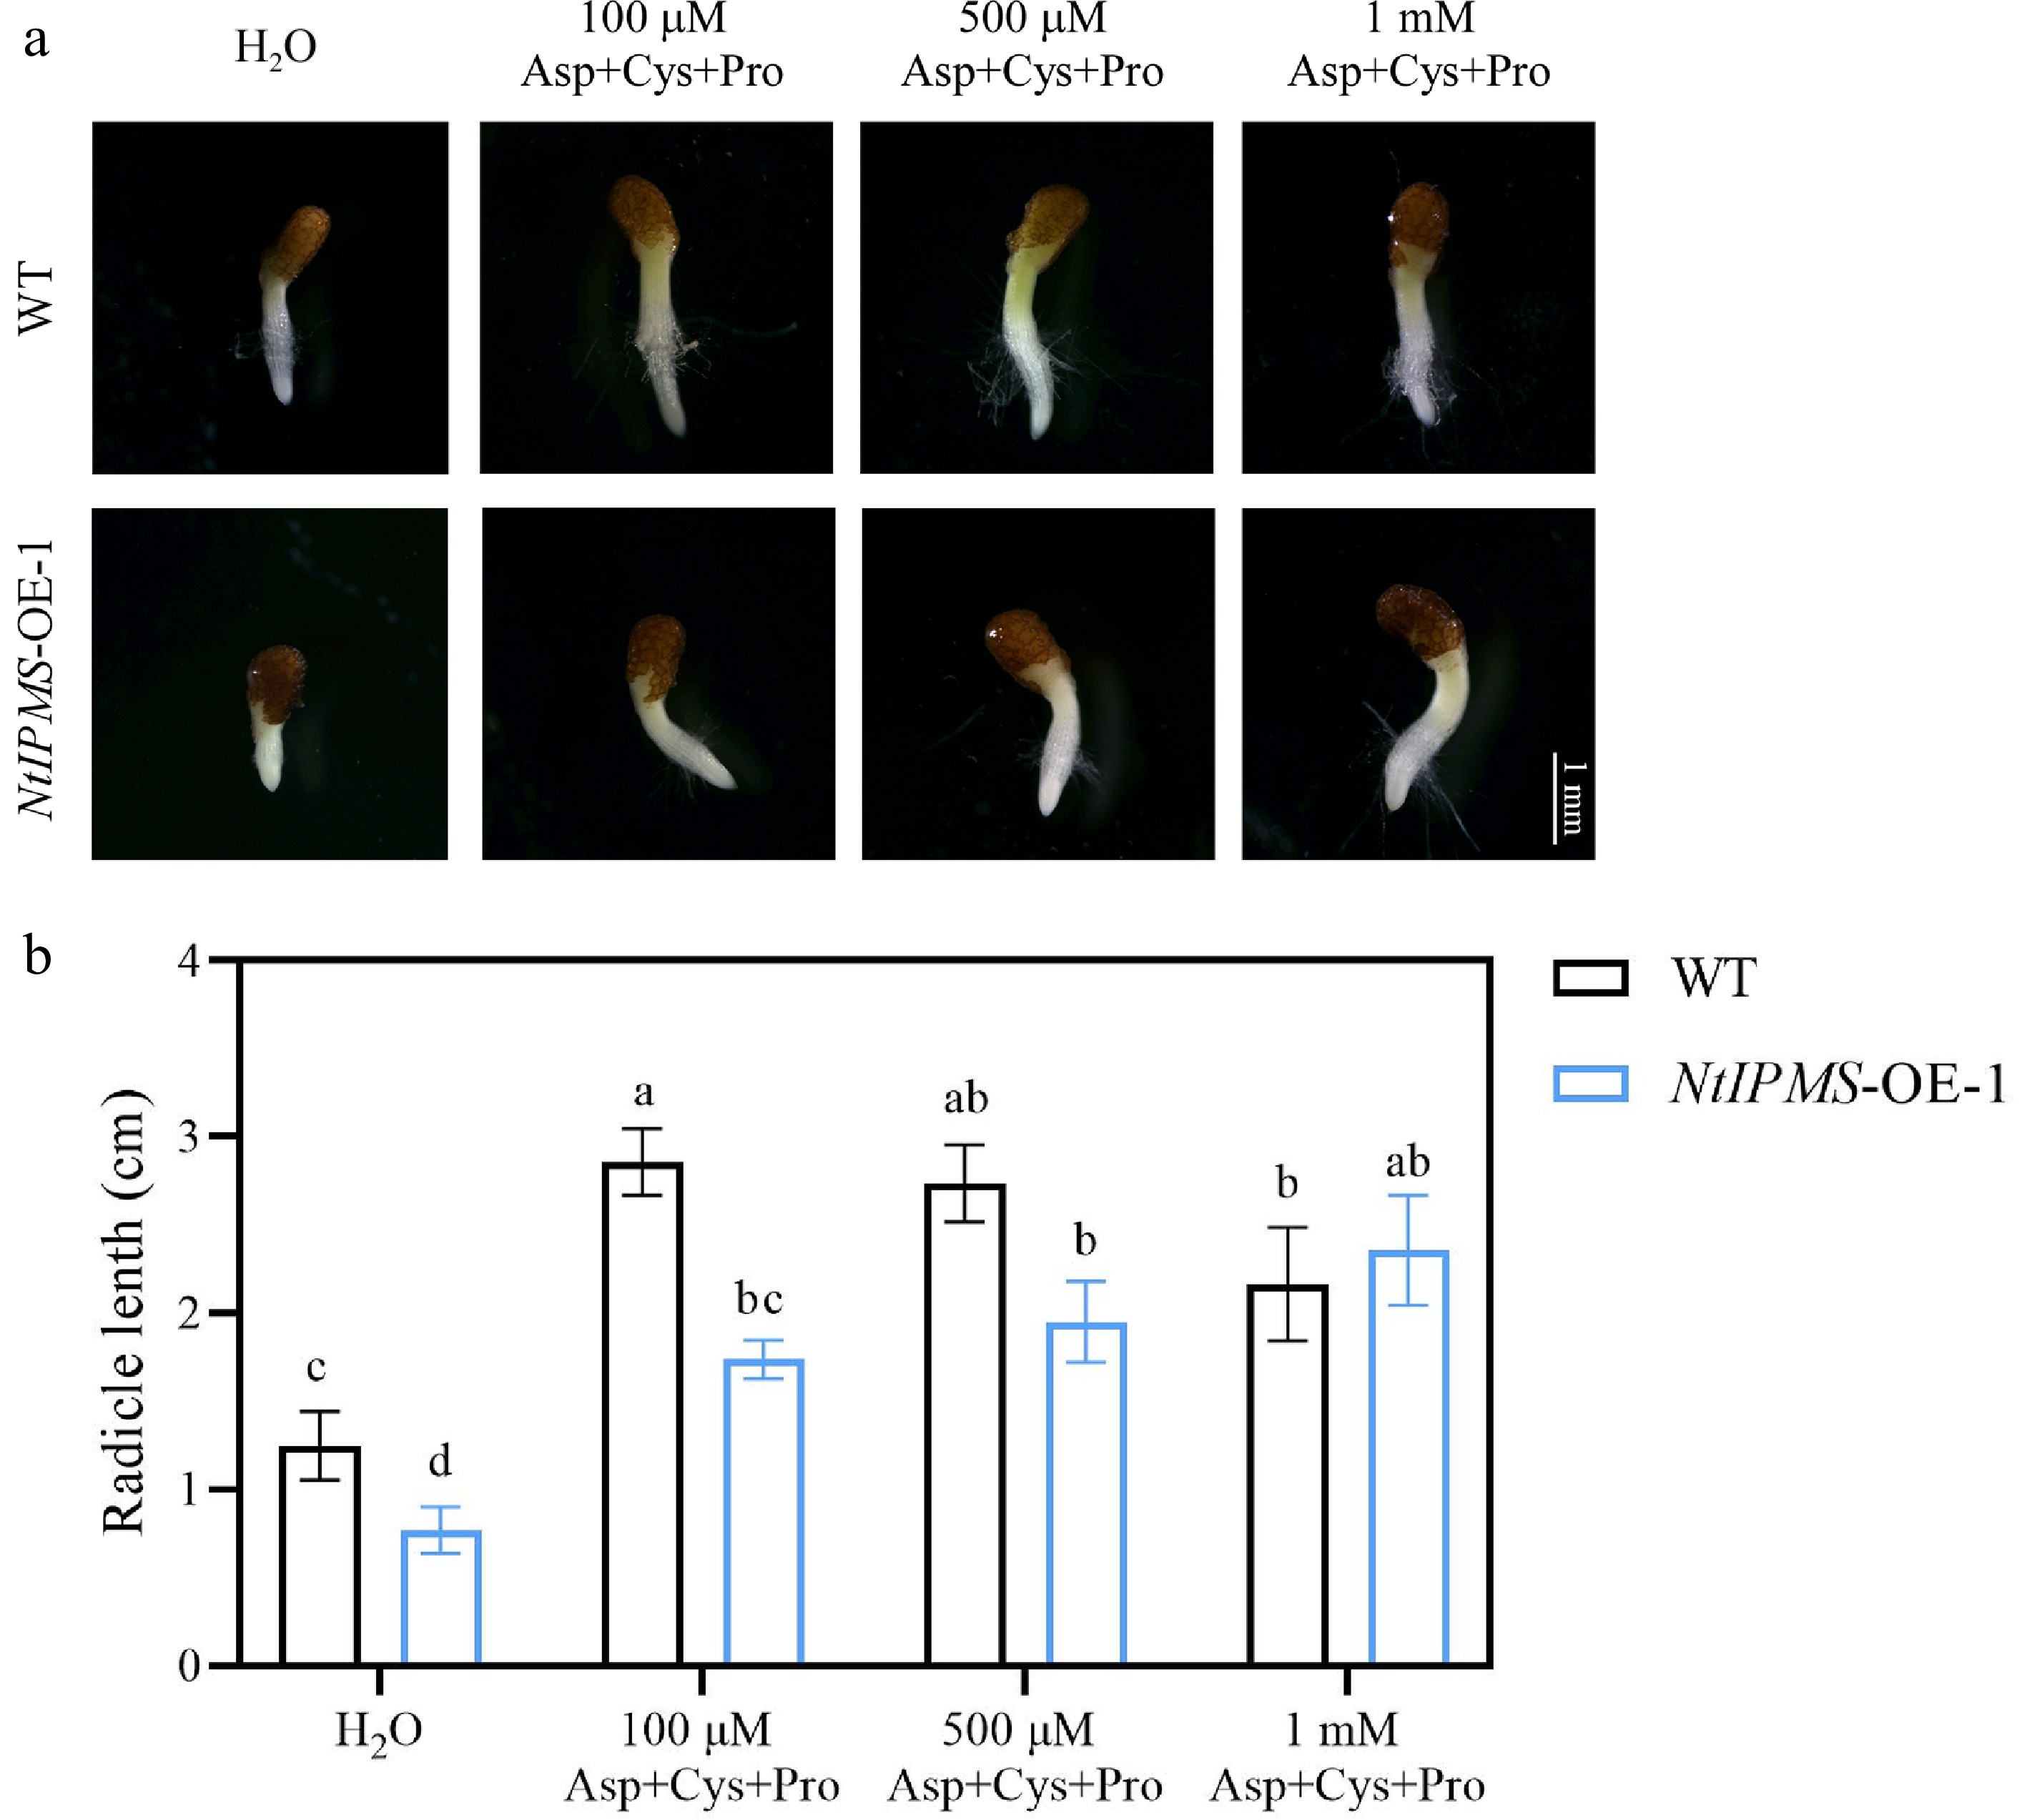
Figure 4.
NtIPMS regulates seed germination involving amino acid pathway under cold stress (15 °C) in tobacco. (a) Representative images of seed germination by exogenous amino acid (Asp, Cys, and Pro) treatment for 10 d in Yunyan 87 (WT) and NtIPMS-OE-1 lines under cold stress. Scale bars = 1 mm. (b) Comparison of radicle length between WT and NtIPMS-OE-1 lines under cold stress after amino acids treatment. Each column represents the mean ± standard deviation. n = 3. Different letters indicate significant differences determined using Duncan's multiple range test: p < 0.05.
-
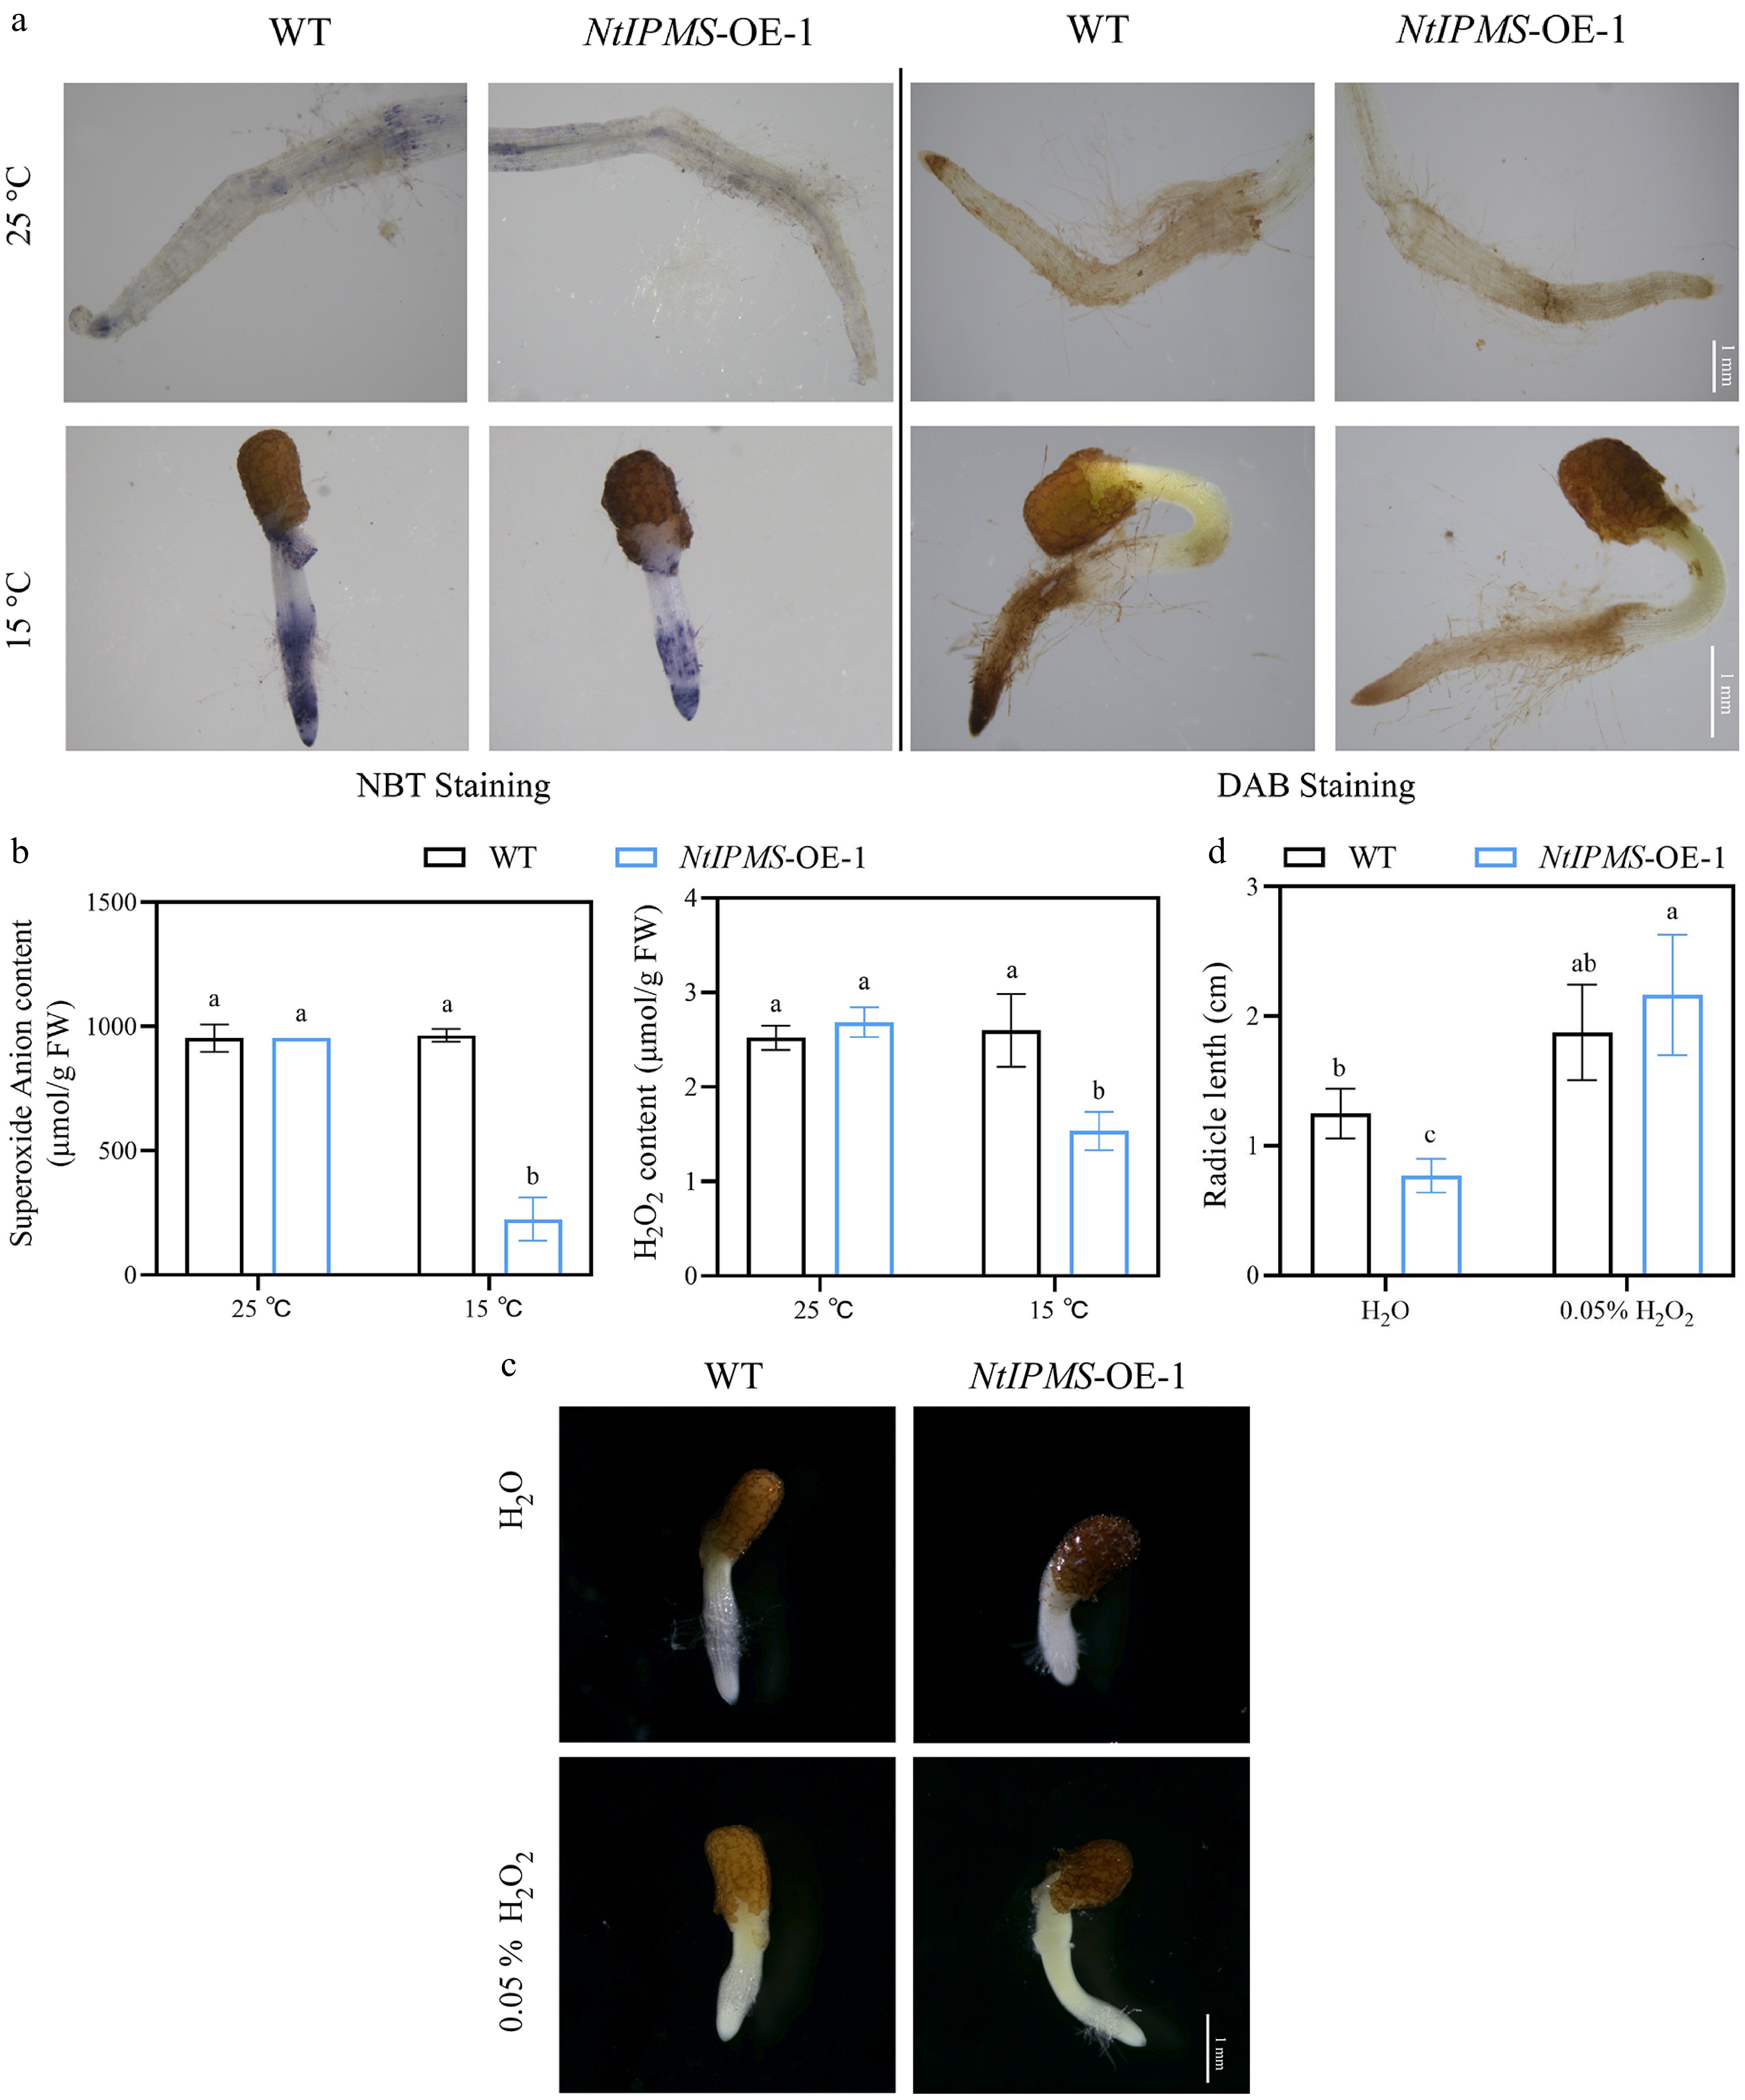
Figure 5.
NtIPMS regulates seed germination involving ROS pathway under cold stress (15 °C) in tobacco. (a) Representative images of NBT staining for O2•− content and DAB staining for H2O2 content. Scale bars = 1 mm. (b) Comparison of O2•− and H2O2 content between Yunyan 87 (WT) and NtIPMS-OE-1 line under normal (25 °C) and cold stress (15 °C) conditions. (c) Representative images of seed germination by exogenous H2O2 treatment for 10 d in Yunyan 87 (WT) and NtIPMS-OE-1 line under cold stress. Scale bars = 1 mm. (d) Comparison of radicle length between WT and NtIPMS-OE-1 lines under cold stress after H2O2 treatment. Each column represents the mean ± standard deviation, n = 3. Different letters indicate significant differences determined using Duncan's multiple range test: p < 0.05.
-
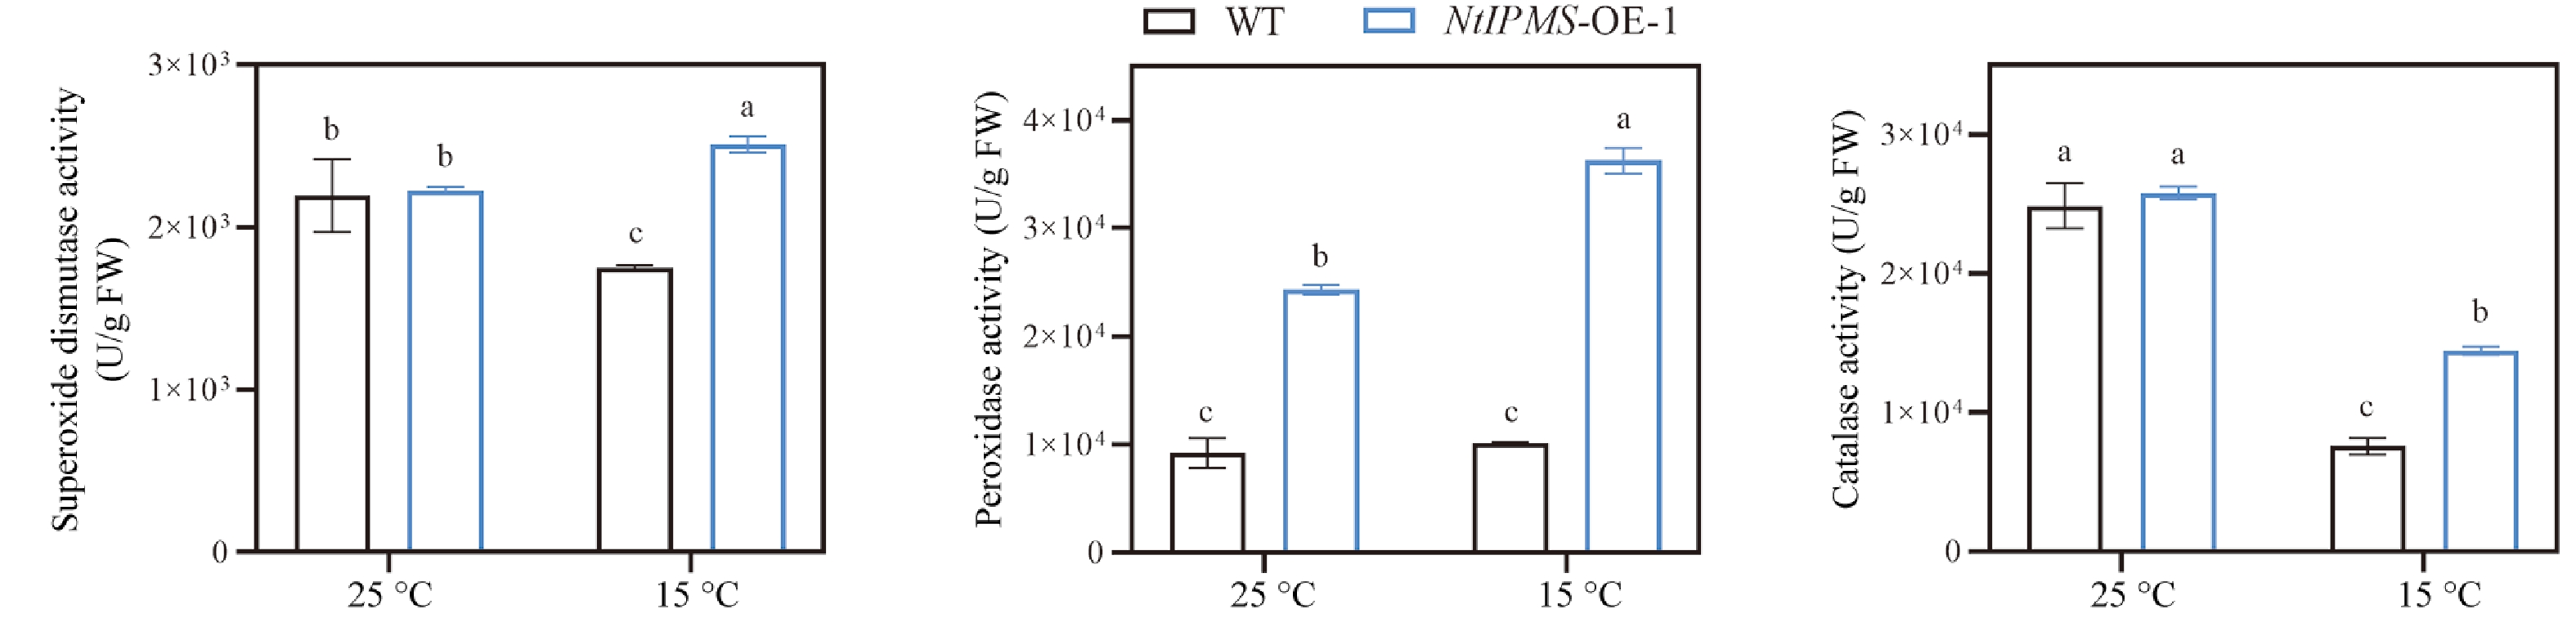
Figure 6.
Comparison of the activities of superoxide dismutase (SOD), peroxidase (POD), and catalase (CAT) between Yunyan 87 (WT) and NtIPMS-OE-1 lines under normal (25 °C) and cold stress (15 °C) conditions. Each column represents the mean ± standard deviation, n = 3. Different letters indicate significant differences determined using Duncan's multiple range test: p < 0.05.
Figures
(6)
Tables
(0)