-
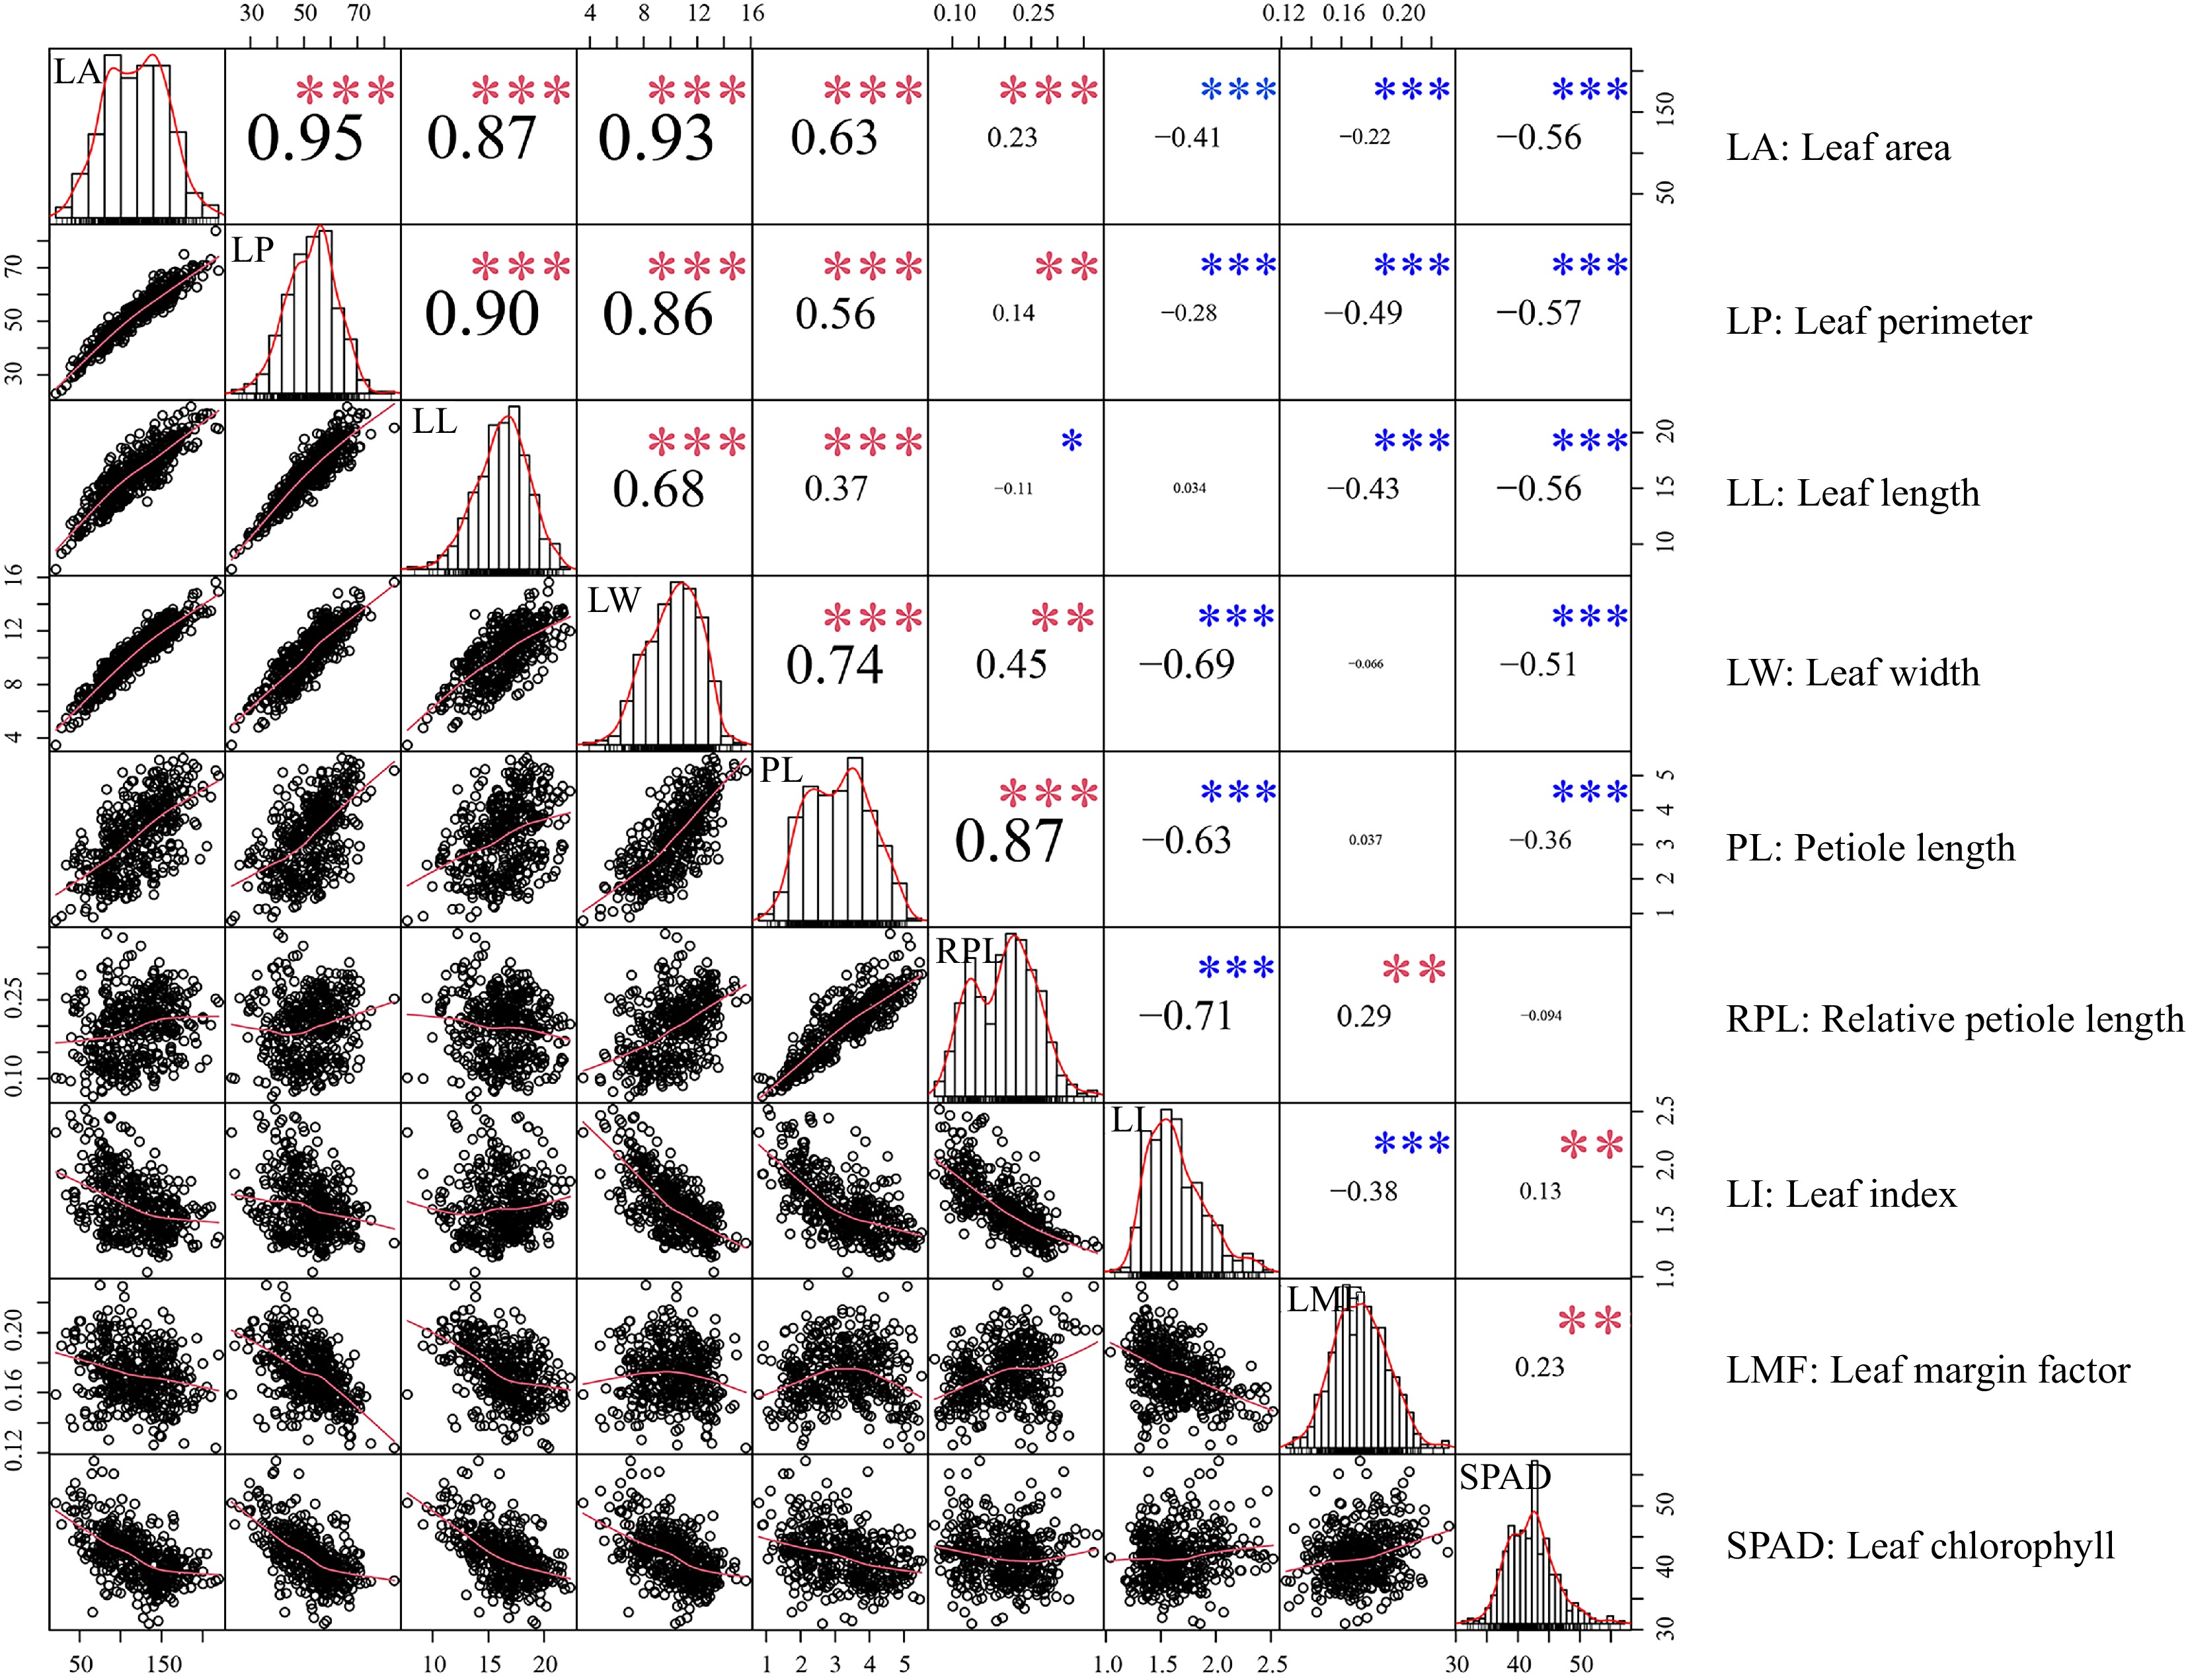
Figure 1.
Relationships between leaf traits. Scatter plots and histograms display the distribution of each trait. The red line overlaid on each histogram represents the density distribution. '*', '**' and '***' denote significant correlations at the 0.05, 0.01, and 0.001 levels, respectively. Red and blue asterisks represent positive and negative correlations, respectively.
-
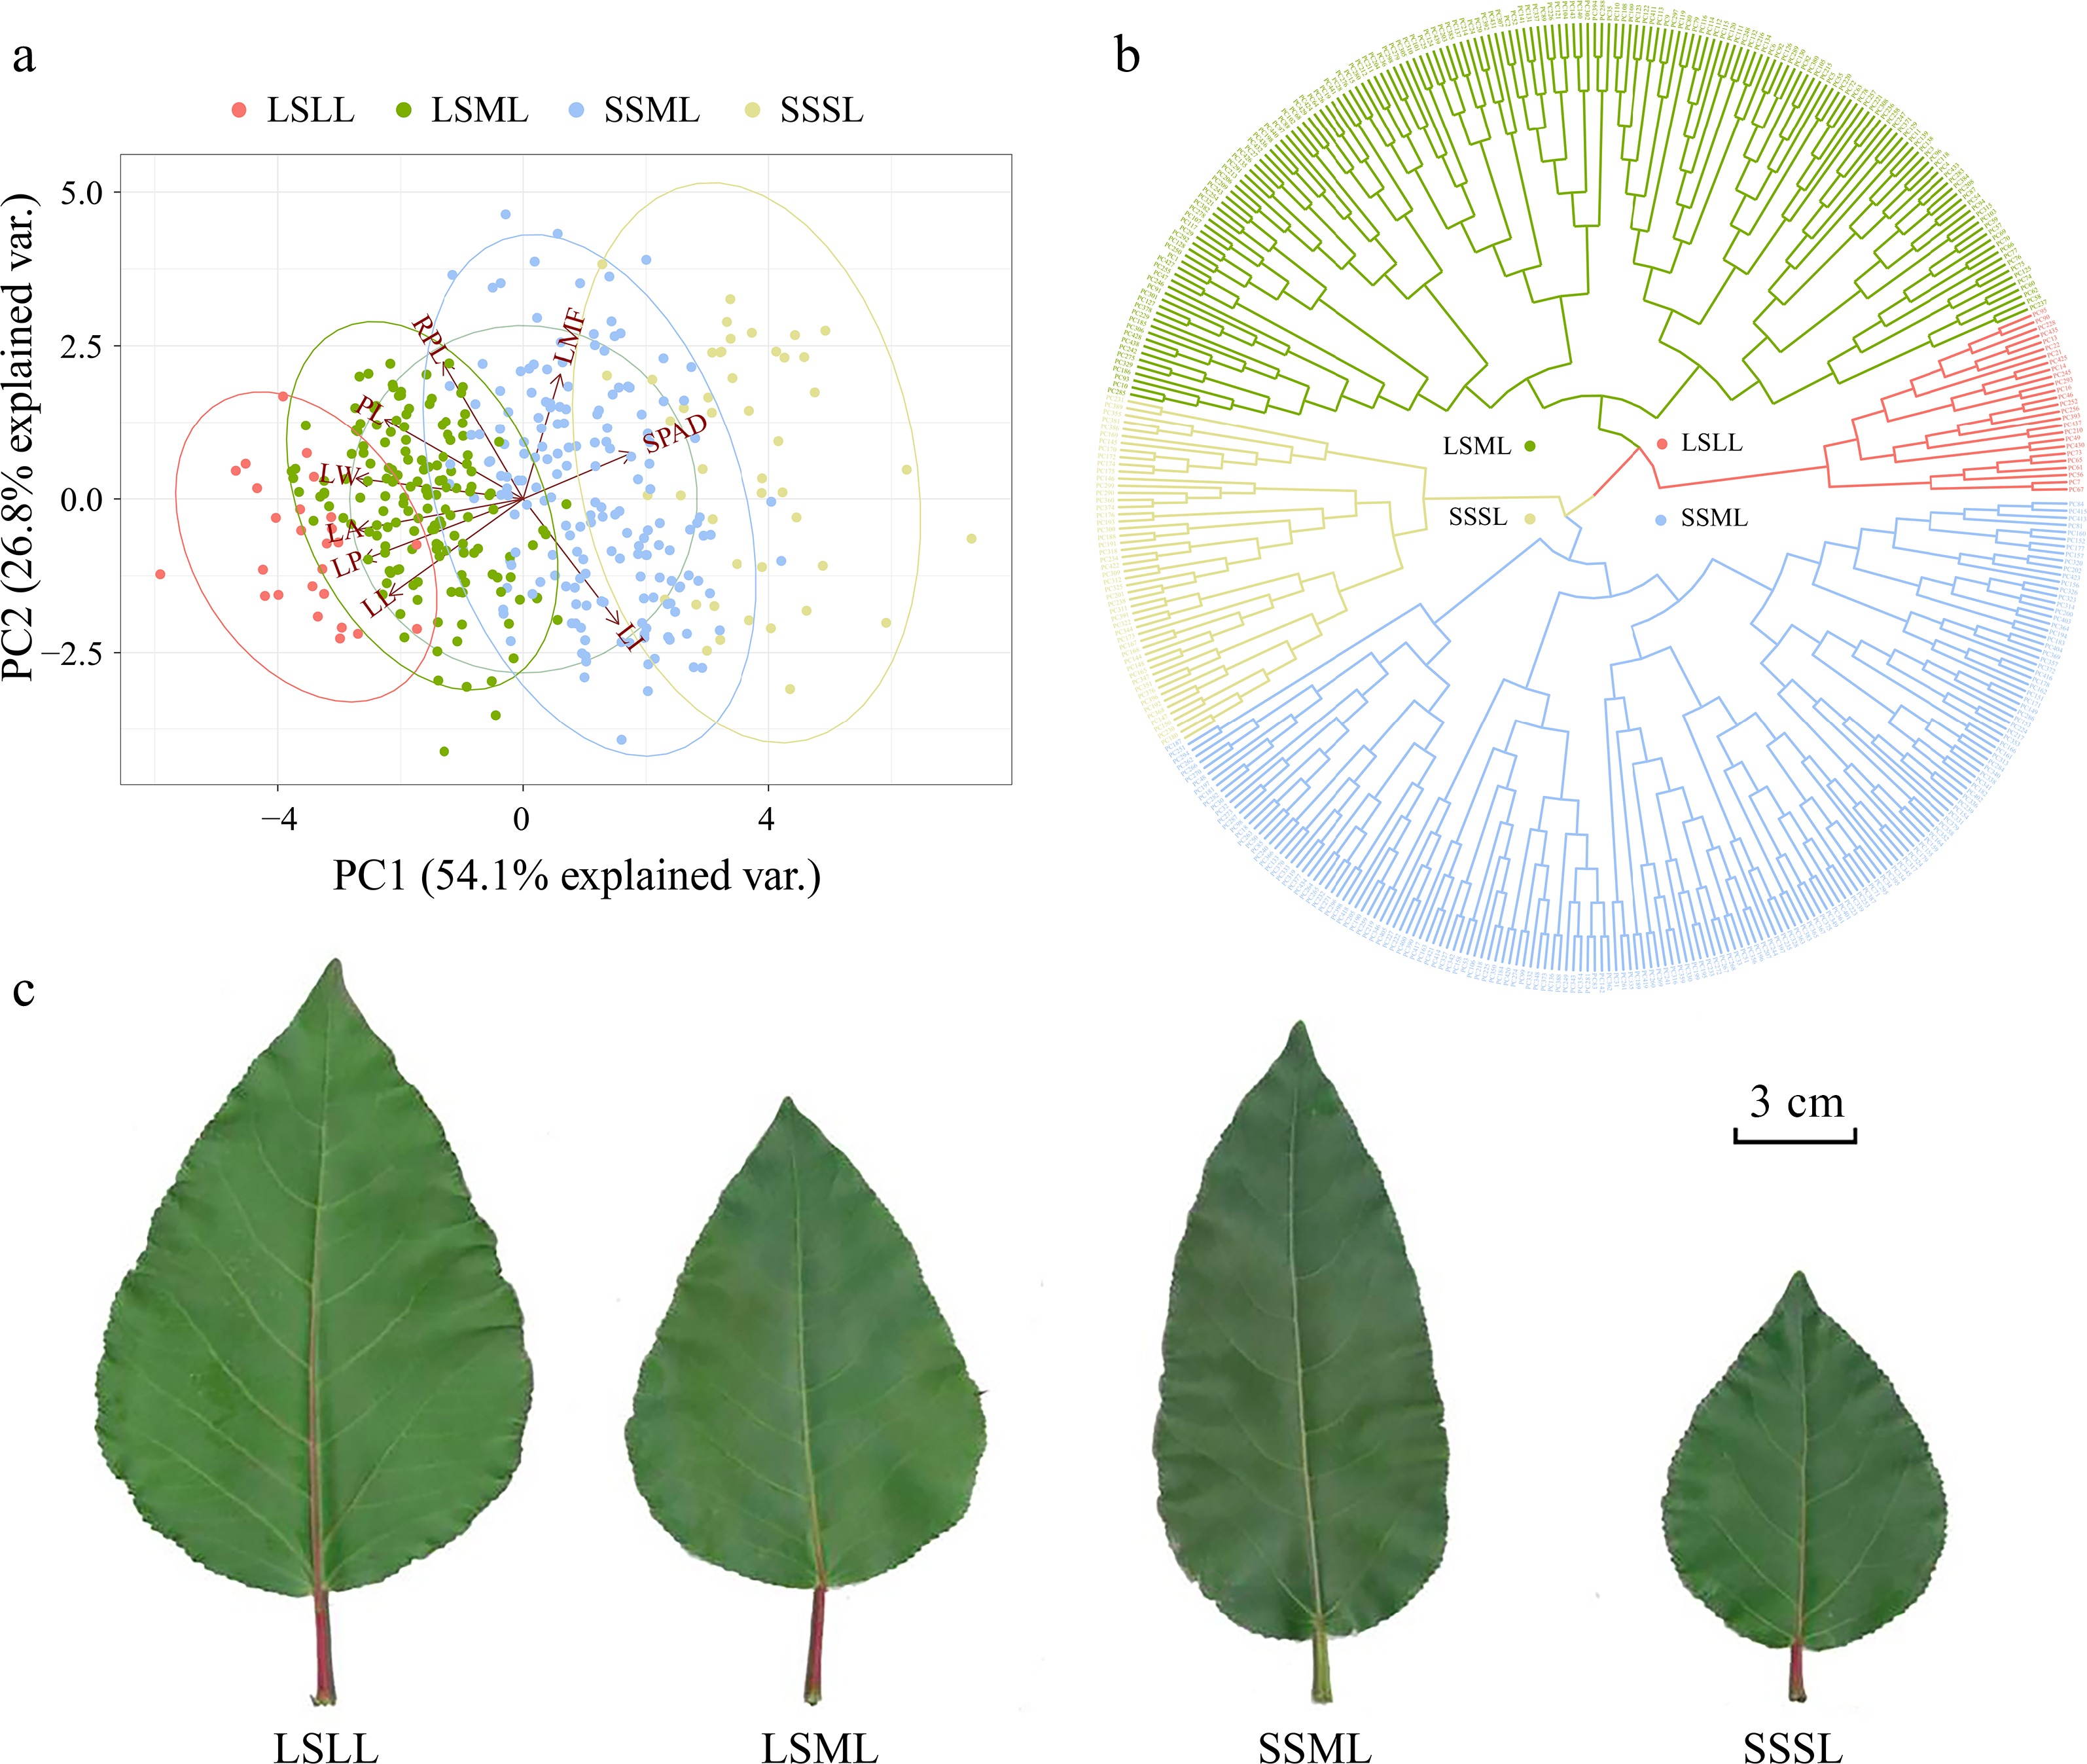
Figure 2.
Principal component analysis (PCA) and hierarchical clustering analysis based on leaf phenotype data. (a) The PCA plot showing the first and second principal components of P. cathayana genotypes, represented by color-coded points, and the relative importance of explanatory variables is indicated by vectors. (b) Clustering of P. cathayana populations into four categories based on leaf traits. (c) Comparison of four leaf shape categories[28].
-
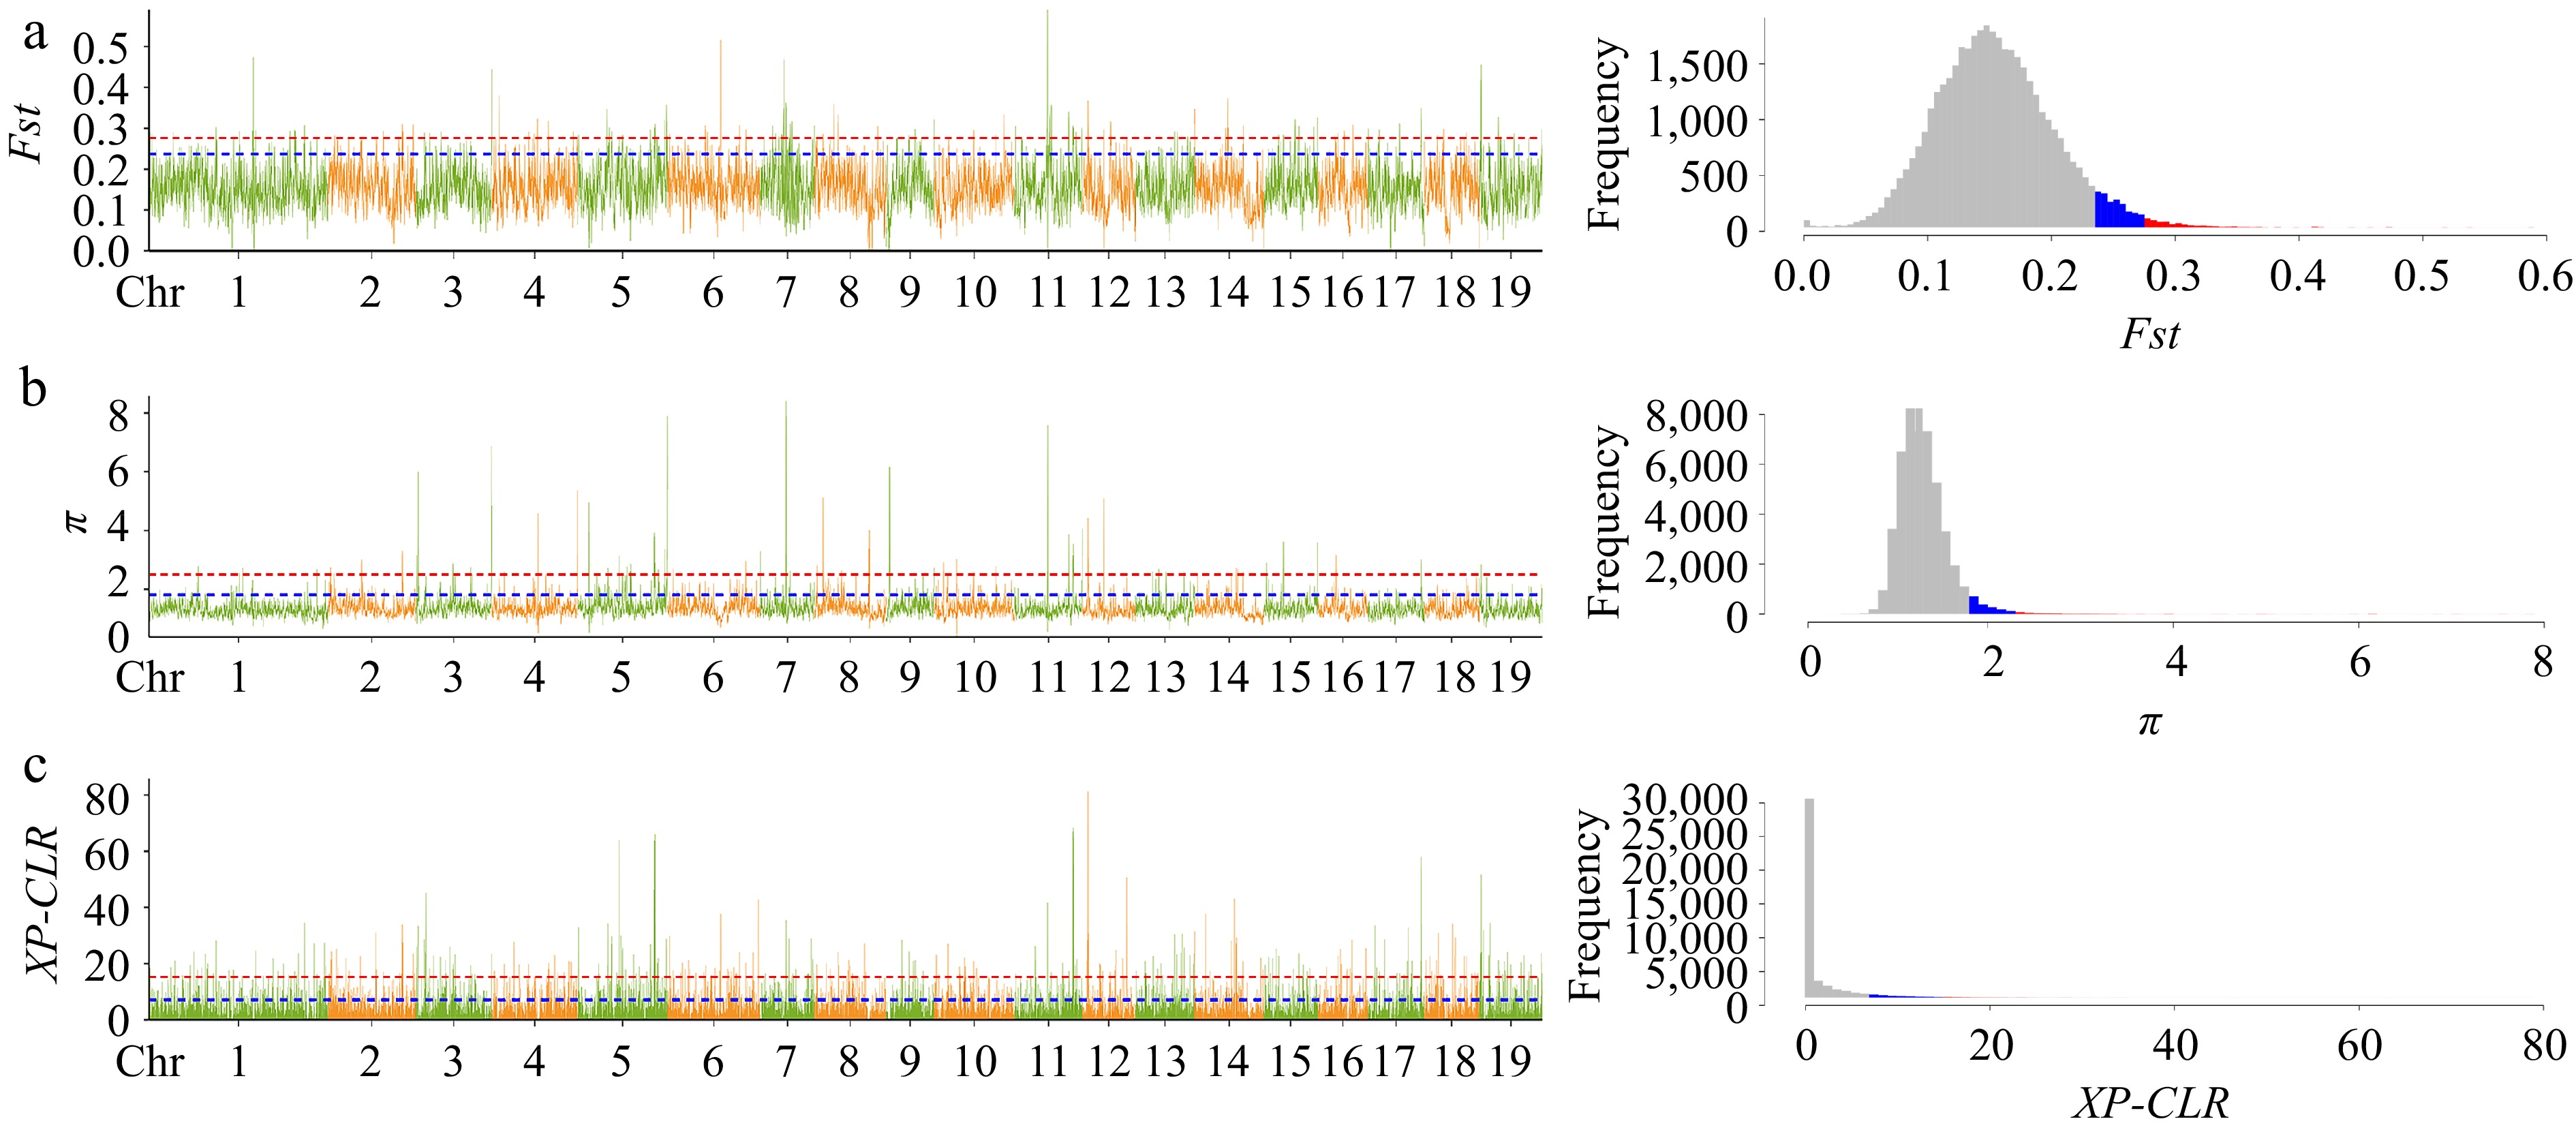
Figure 3.
Selective sweep analysis visual line chart and frequency histogram. Genetic differentiation coefficient (Fst) and nucleotide diversity (π) were calculated by the sliding window method with a window size of 10 kb and a step size of 1 kb; XP-CLR has the same window size as Fst and π. The plots (a), (b) and (c) respectively represent the line graph and frequency histogram of Fst, π, and XP-CLR. In the line plot, the blue line and red line represent the top 5% and top 1% thresholds, respectively, and correspond to the blue and red shaded areas in the frequency histogram. The interval that passes the top 5% threshold lines in three methods is considered as the final candidate region for selective sweep.
-
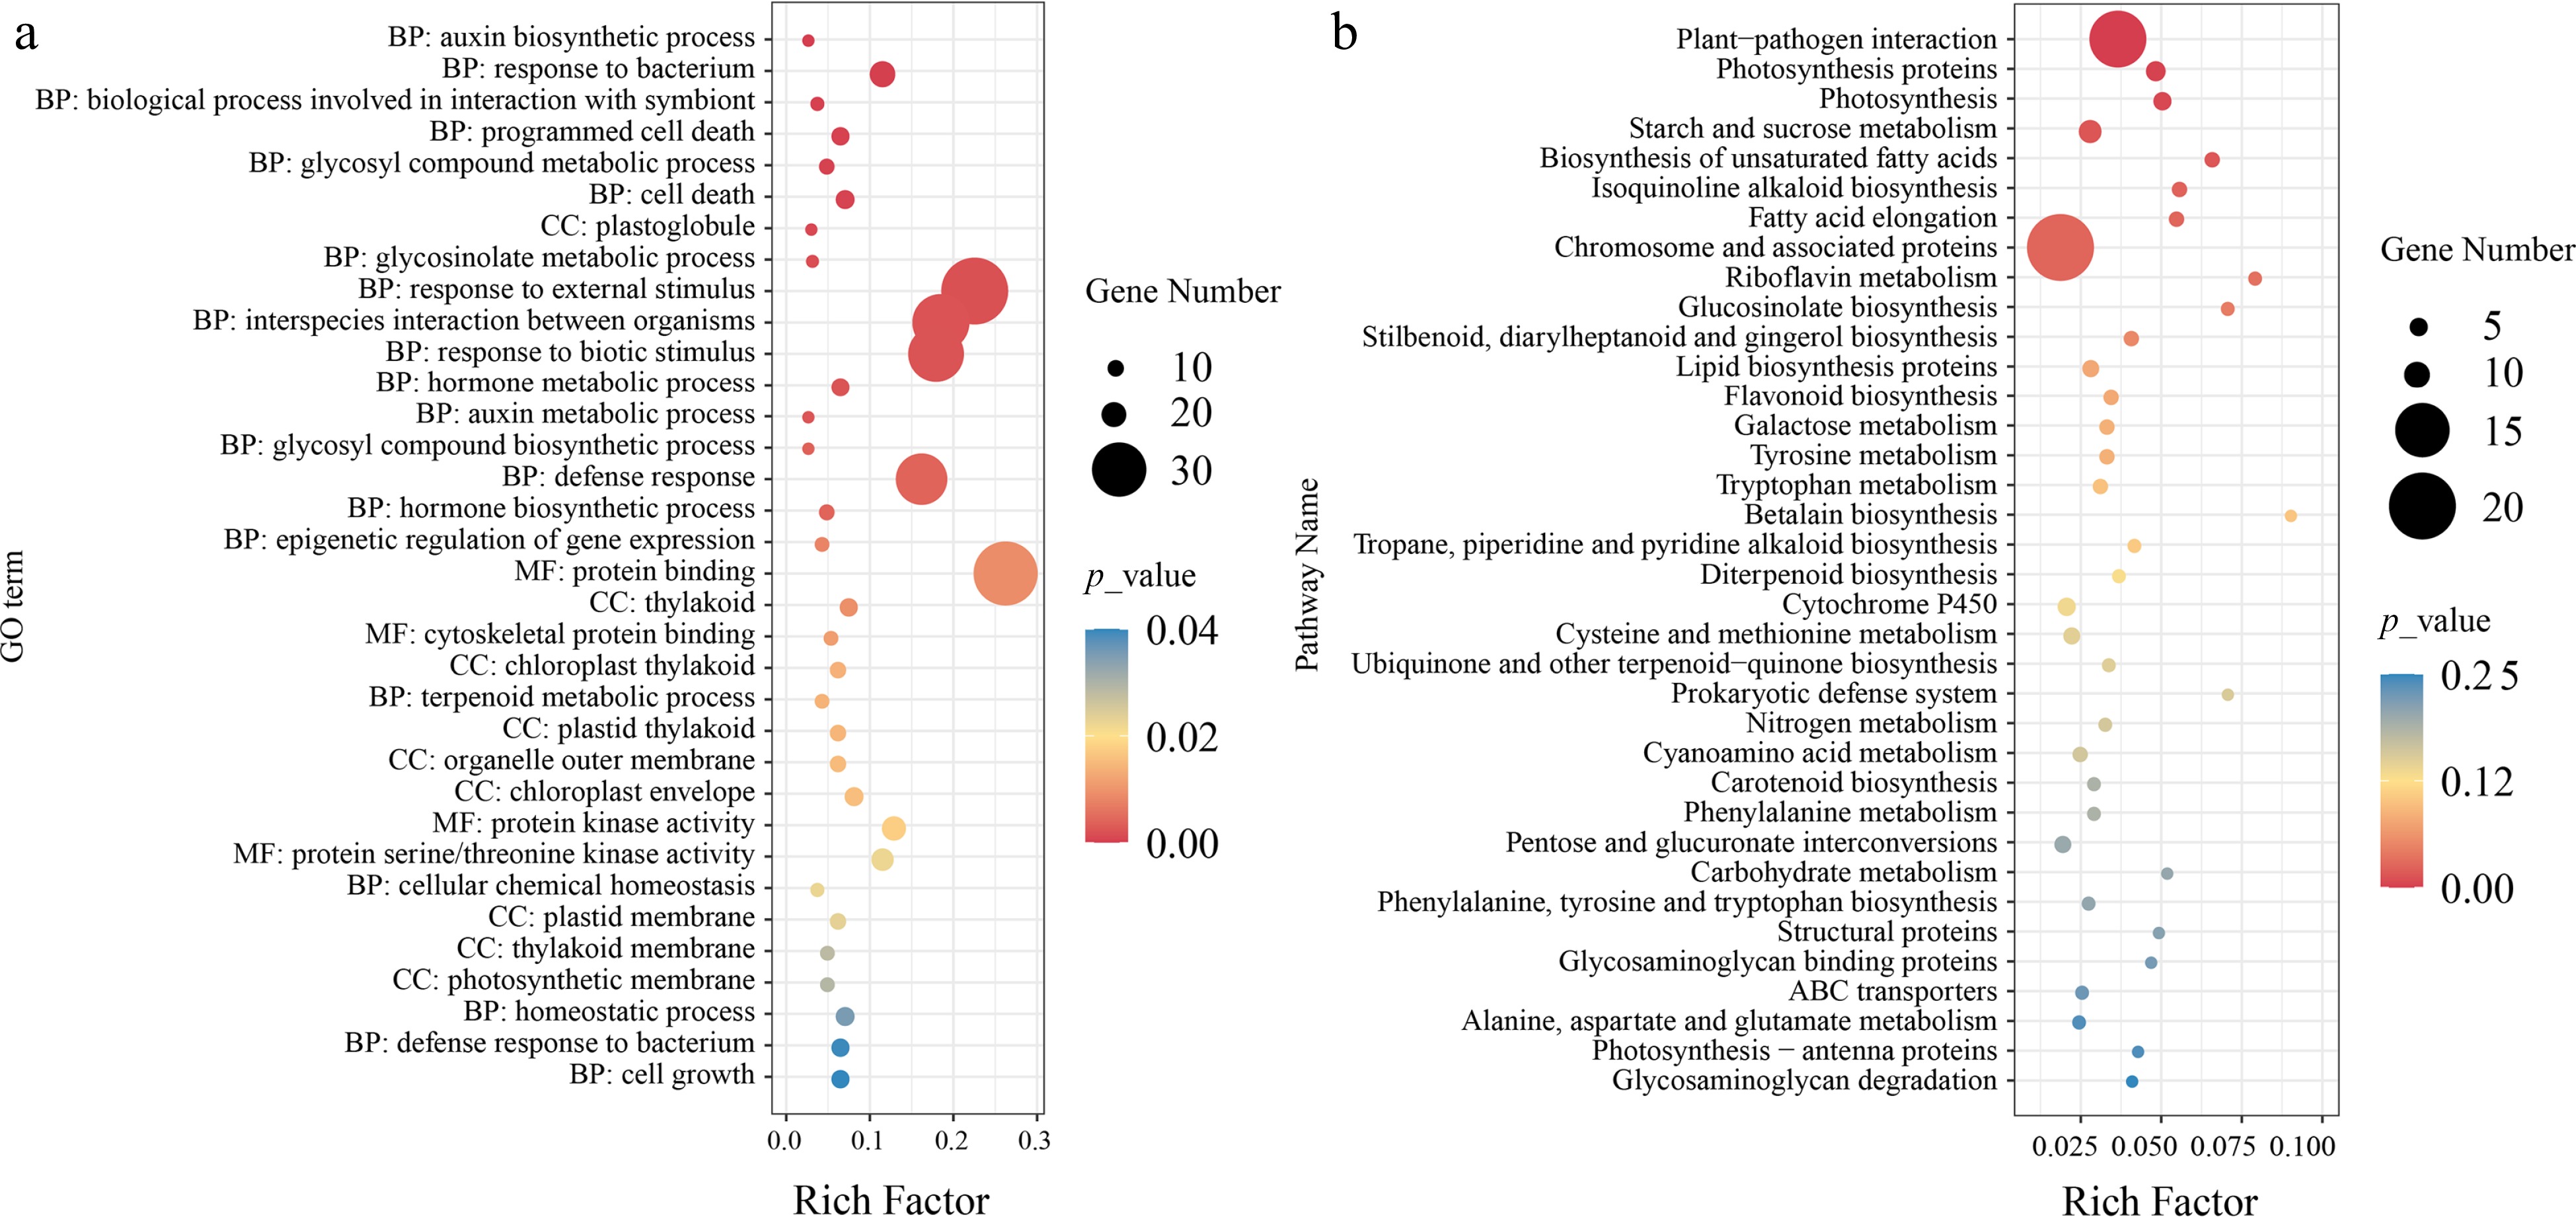
Figure 4.
Functional enrichment analysis of selective sweep candidate genes. (a) GO enrichment analysis of candidate genes, where the size of the points represents the number of genes, and the color of the points indicates significance level. BP, CC, MF respectively represent biological process, cellular component, and molecular function. (b) KEGG enrichment analysis of candidate genes, where the size of the points represents the number of genes, and the color of the points indicates significance level.
-
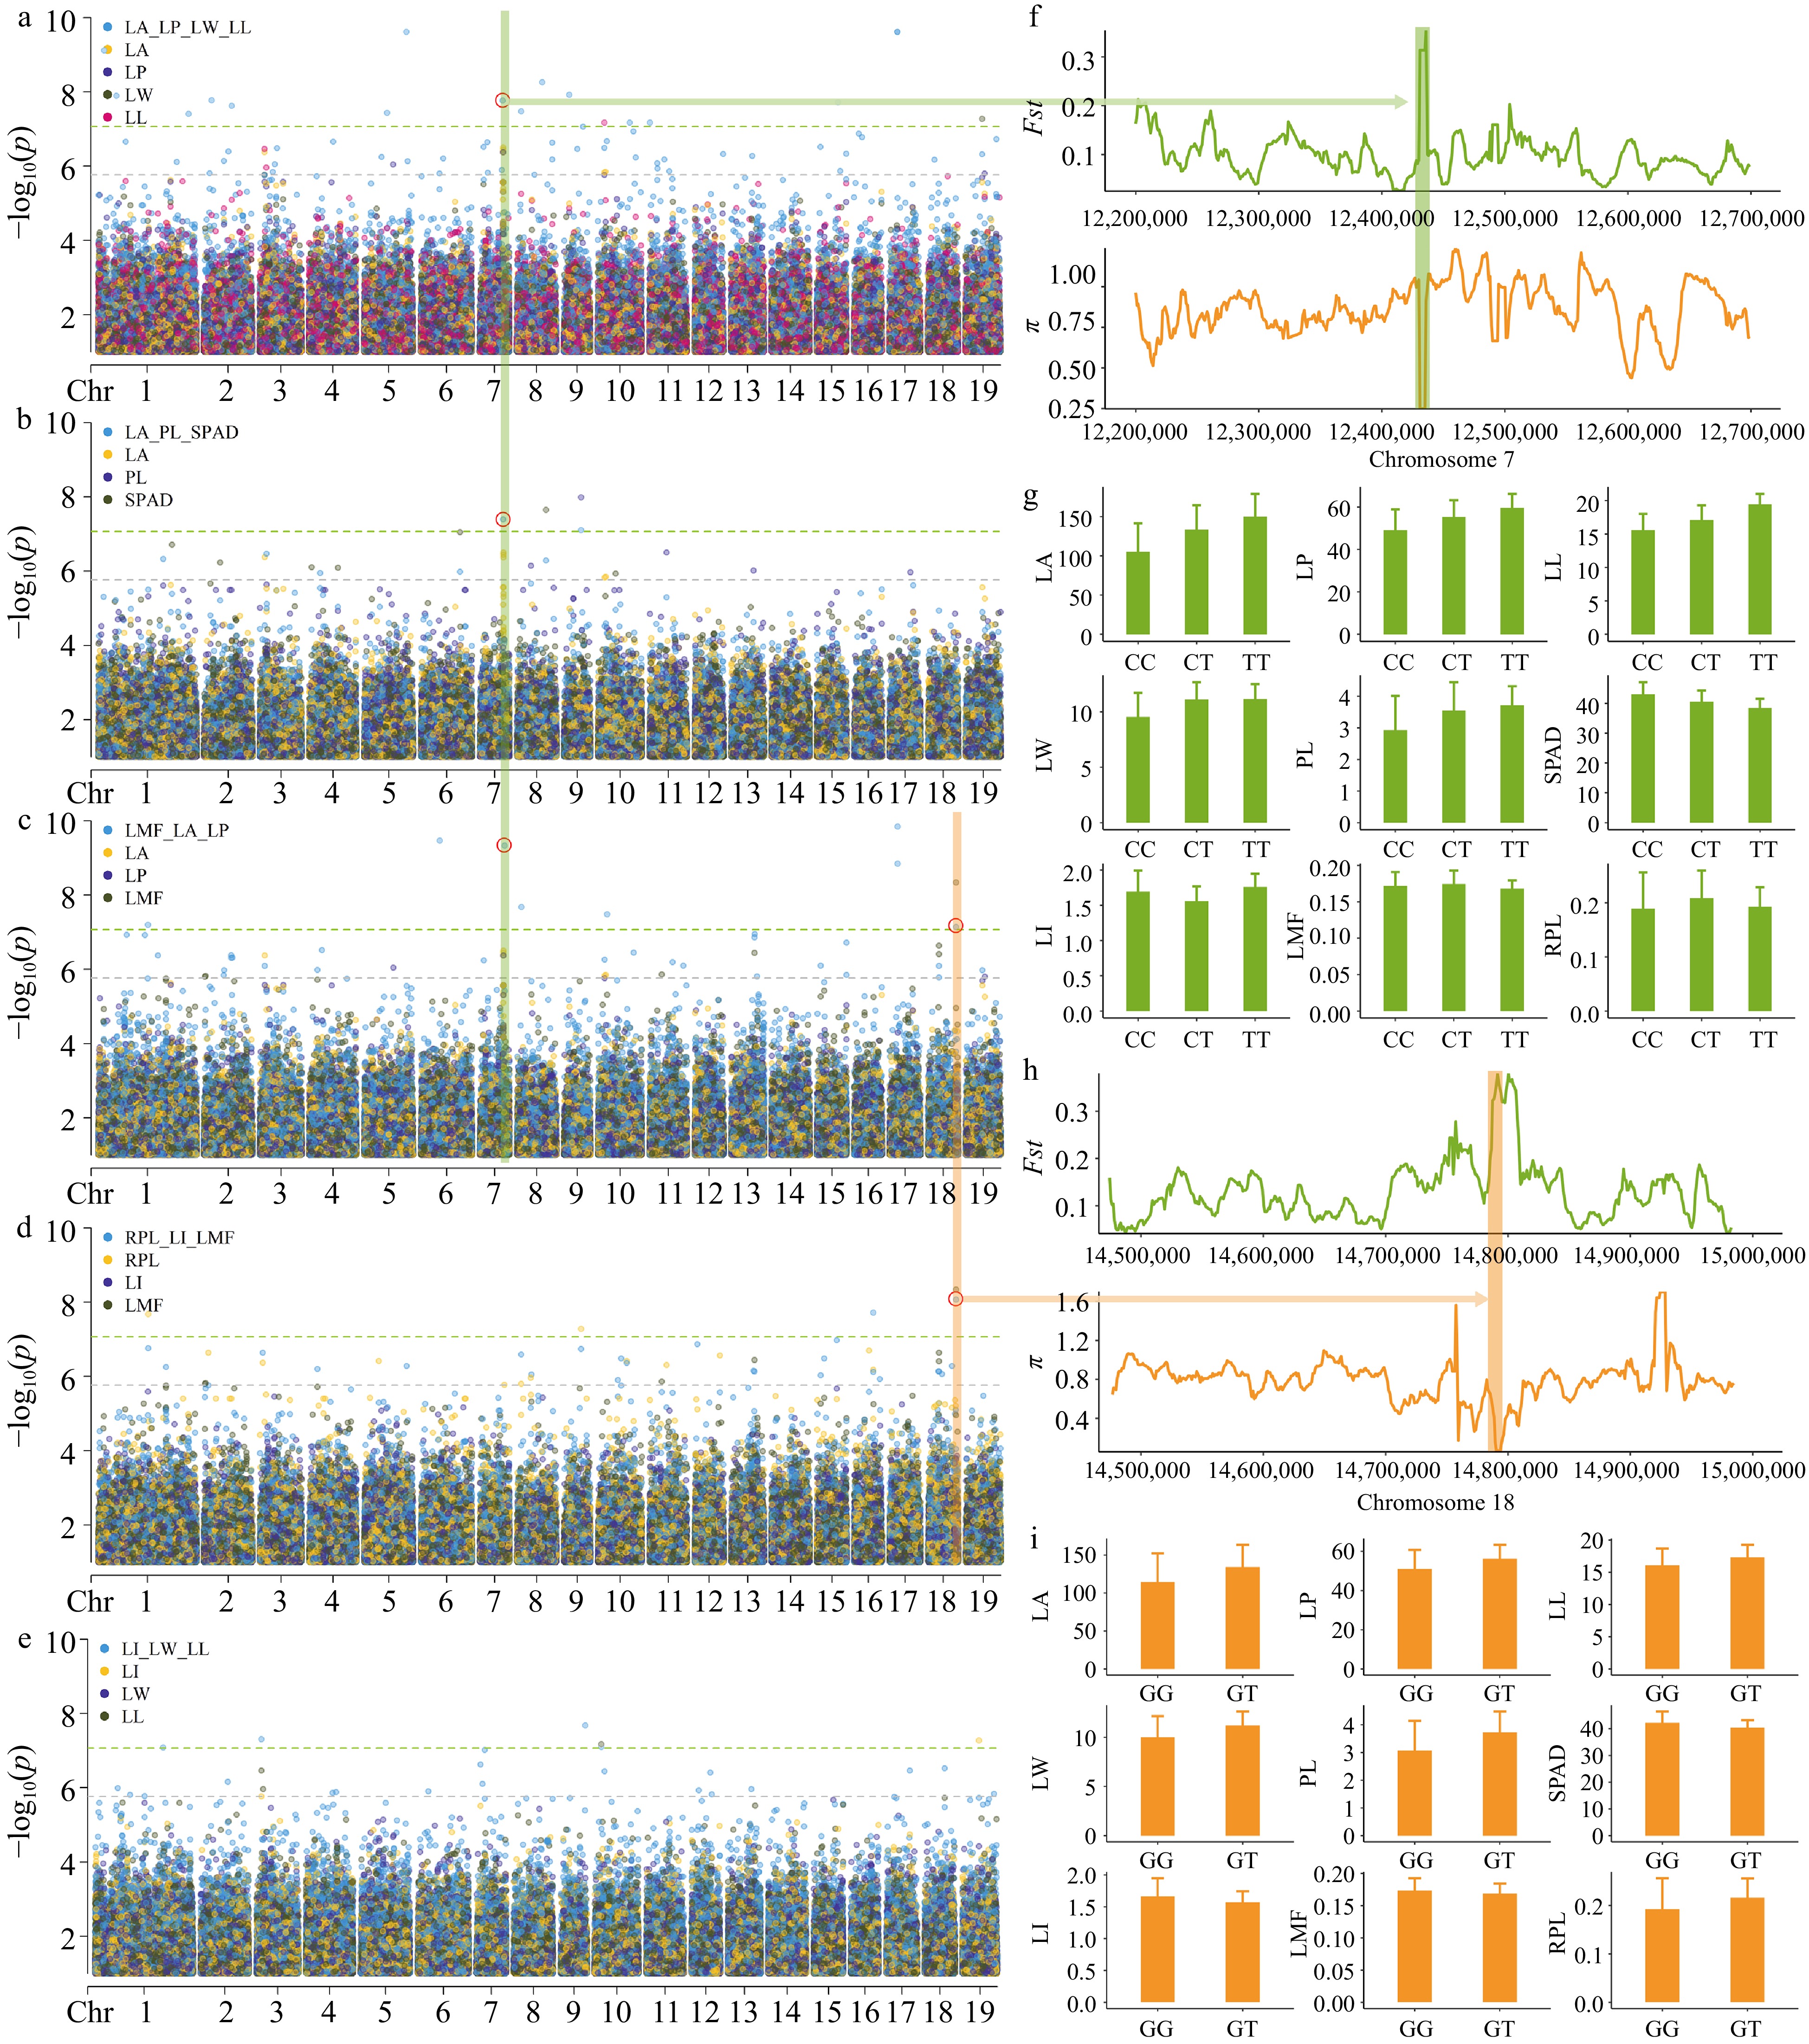
Figure 5.
GEMMA multi-trait GWAS Manhattan plots and significant locus analysis. The plots (a), (b), (c), (d), and (e) correspond to the manhattan plots of LA_LP_LL_LW, LA_PL_SPAD, LI_LW_LL, LMF_LA_LP and RPL_LI_LMF, respectively. For ease of comparison, we have included the single-trait GWAS Manhattan plots of the traits in the figures. Each dot on the plot represents a SNP, with dot colors indicate single-trait or multi-trait associations. p_value were transformed into −log10(p_value). SNPs above green lines passed bonferroni correction test (p ≤ 8.51 × 10⁻⁸). The red circle represents the detected loci in multiple trait combinations. (f) Analysis of genetic differentiation (Fst) and nucleotide diversity (π) near SNP 7__12437614. (g) Comparison of leaf phenotypes corresponding to three haplotypes at SNP 7__12437614, represented by mean values in a bar graph with standard deviation as the error. (h) Analysis of genetic differentiation (Fst) and nucleotide diversity (π) near SNP 18__14798104. (i) Comparison of leaf phenotypes between two haplotypes at SNP 18__14798104, represented by mean values in a bar graph with standard deviation as the error.
-
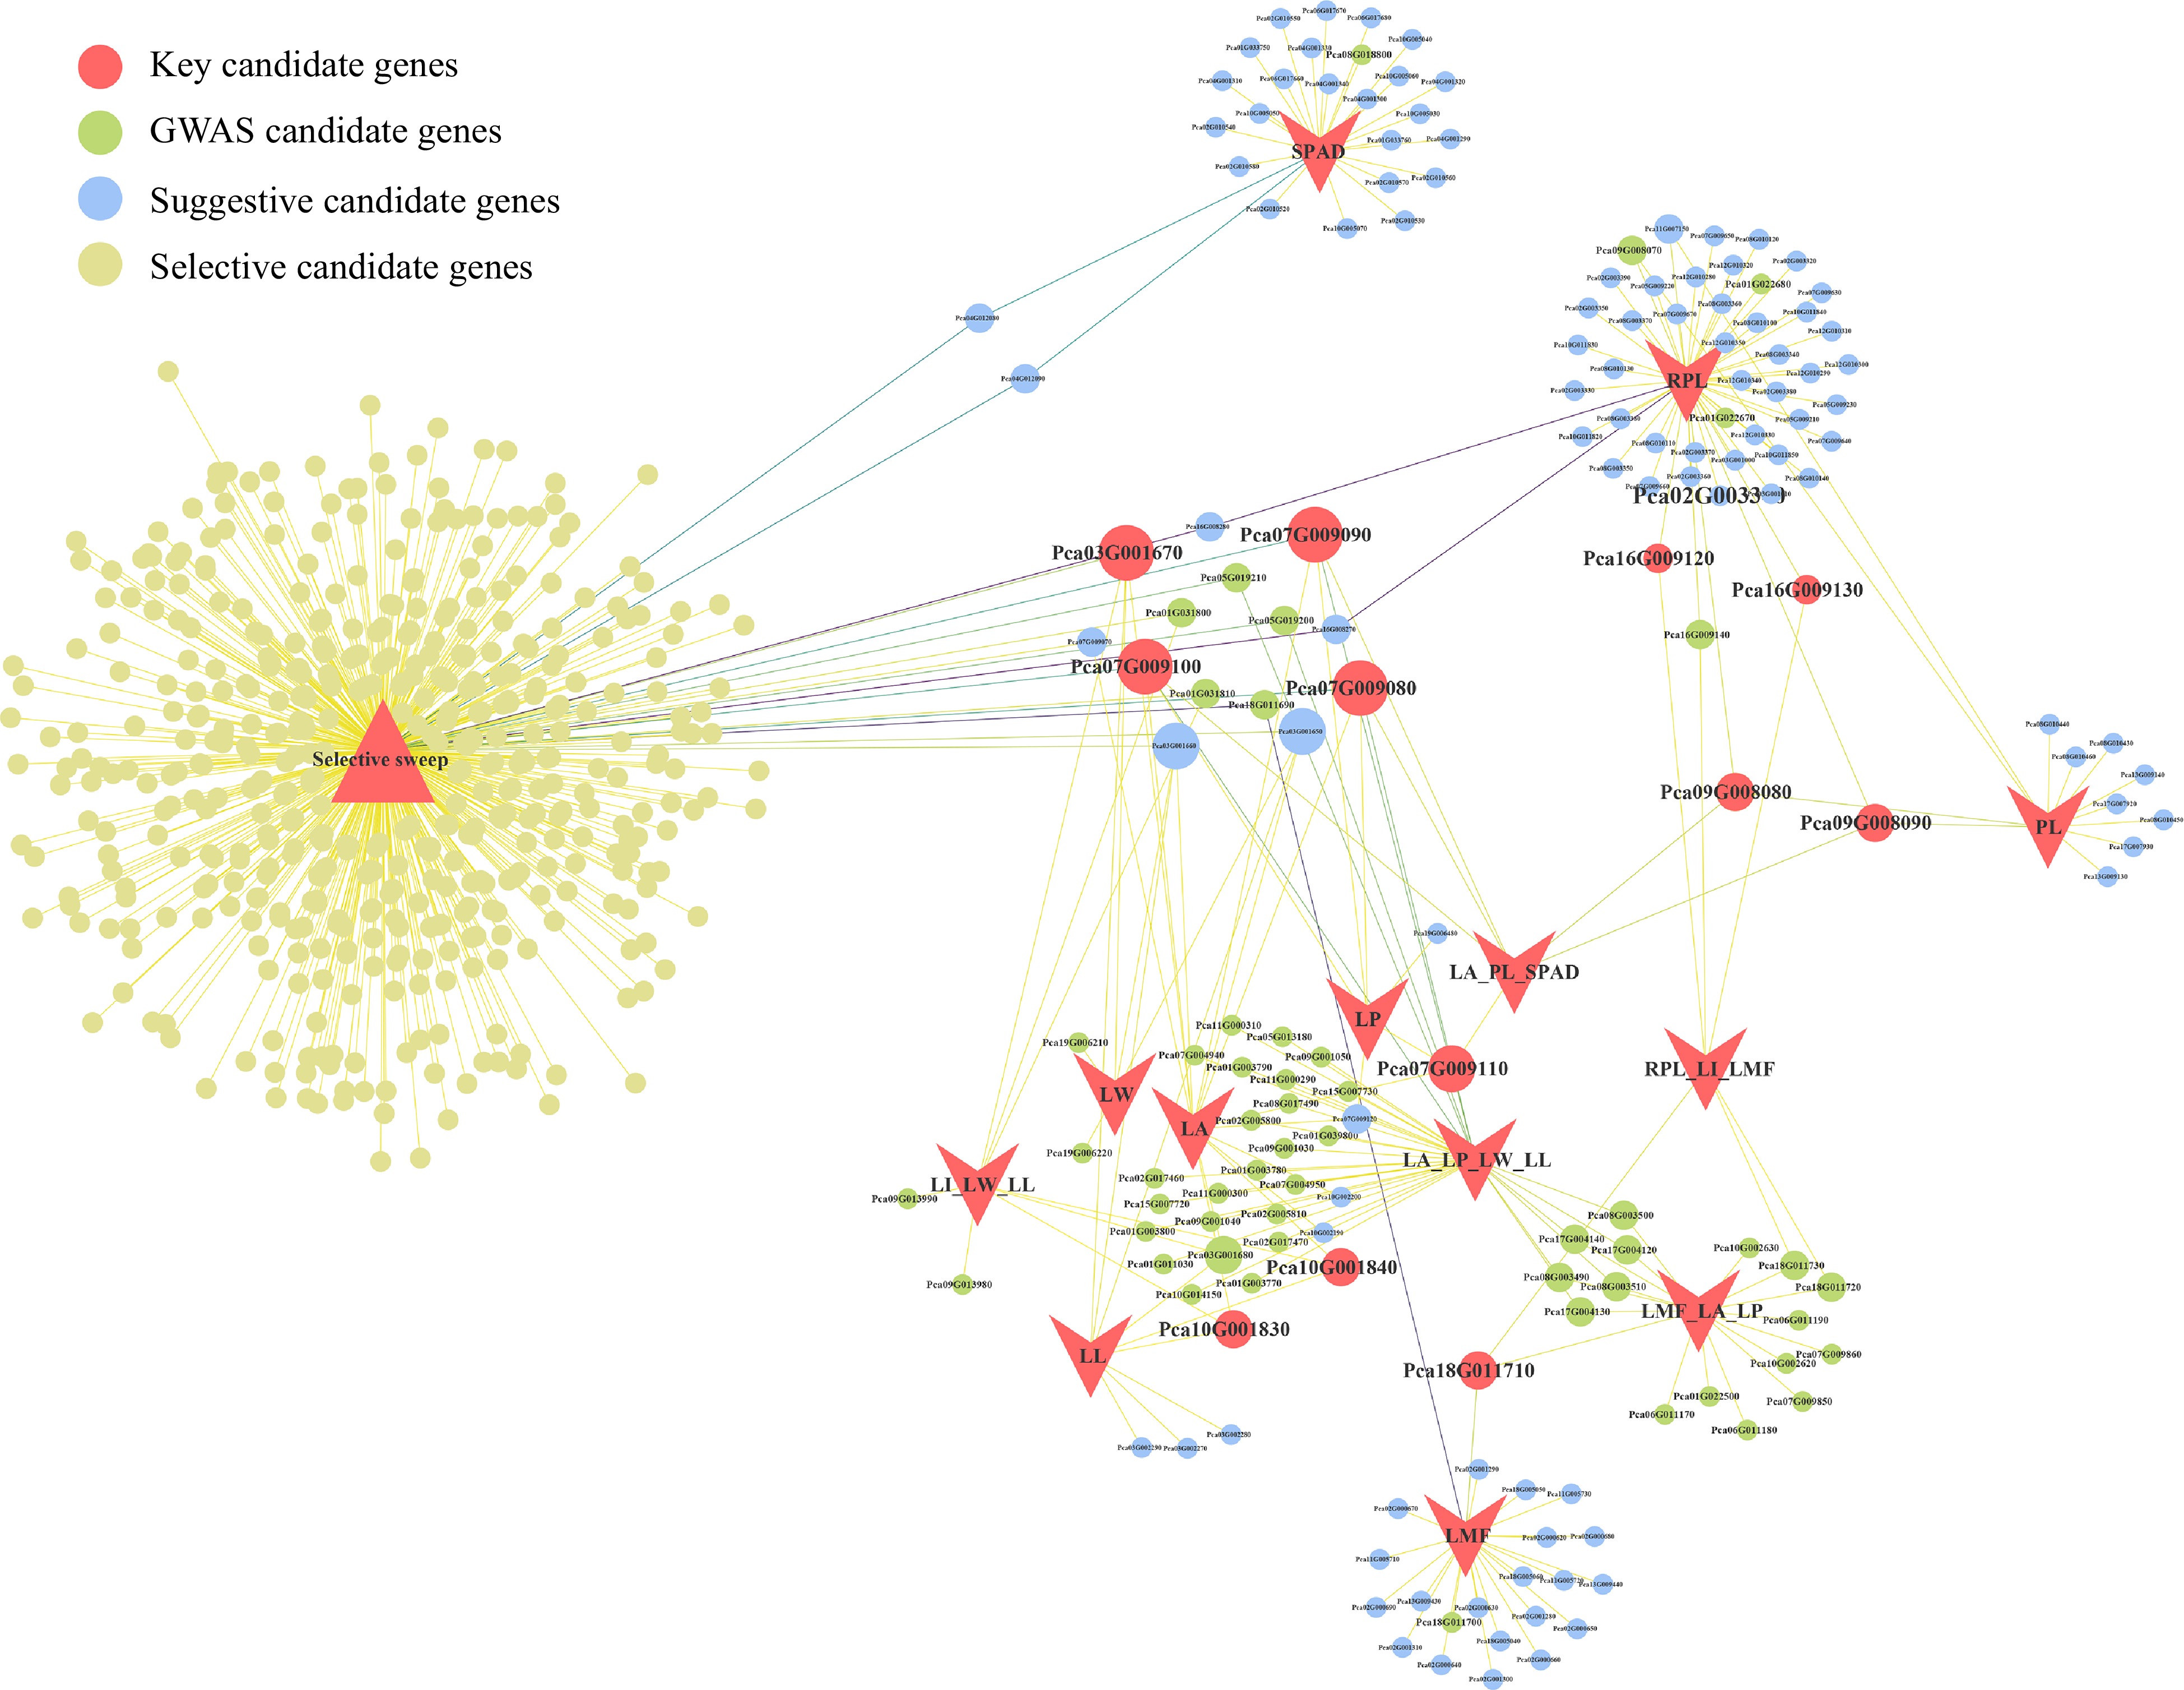
Figure 6.
Candidate gene network visualization. Circles represent candidate genes, and the size of the circles indicates the number of associated traits. The color of the circles corresponds to different types of candidate genes. Lines represent the traits associated with genes and whether they are candidate genes for selective sweep.
-
Trait Abbreviation Mean SD Min Max CVa Vgb Vec H2d Leaf area LA 118.272 37.235 21.034 219.587 0.31 1,143.7214 685.7488 0.6252 Leaf perimeter LP 51.986 9.642 23.017 83.762 0.19 87.9111 66.3378 0.5699 Leaf length LL 16.344 2.511 7.733 22.327 0.15 5.4303 2.7019 0.6678 Leaf width LW 10.242 2.072 3.483 15.633 0.20 3.9290 2.9150 0.5741 Petiole length PL 3.205 1.047 0.786 5.513 0.33 0.9876 0.3814 0.7214 Relative petiole length RPL 0.197 0.061 0.066 0.376 0.31 0.0671 0.0256 0.7234 Leaf index LI 1.645 0.272 1.042 2.520 0.17 0.0003 0.0005 0.3791 Leaf margin factor LMF 0.173 0.019 0.123 0.232 0.11 0.0033 0.0012 0.7375 Leaf chlorophyll SPAD 41.989 4.587 30.993 57.233 0.11 7.0770 4.9680 0.5875 a Coefficient of variation; b genetic variance; c residual variance; d heritability, Table 1.
Results of statistical analysis of leaf traits.
-
rsa Trait p_value PVEb Gene Functional annotation 19__8697977 LW 5.36E-08 3.15 Pca19G006210 Reverse transcriptase Pca19G006220 RNase H-like domain found in reverse transcriptase 10__3487289 LL 6.77E-08 2.97 Pca10G001830 Protein tyrosine and serine/threonine kinase Pca10G001840 D-mannose binding lectin 9__9068032 PL 1.04E-08 3.34 Pca09G008070 WD domain, G-beta repeat Pca09G008080 Clp protease Pca09G008090 C2H2-type zinc finger 8__15332723 SPAD 2.24E-08 3.24 Pca08G018800 5' nucleotidase family 1__26393650 RPL 2.10E-08 1.98 Pca01G022670 NA Pca01G022680 Protein of unknown function (DUF1117) 9__9068032 RPL 5.28E-08 2.20 Pca09G008070 WD domain, G-beta repeat Pca09G008080 Clp protease Pca09G008090 C2H2-type zinc finger 18__14798104 LMF 4.57E-09 1.08 Pca18G011690 Cytochrome P450 Pca18G011700 Protein tyrosine and serine/threonine kinase Pca18G011710 Cytochrome P450 NA, not available. a The name of the SNP. b The proportion of phenotype variance explained by SNP. Table 2.
Statistical information of significant SNPs in single-trait GWAS.
Figures
(6)
Tables
(2)