-
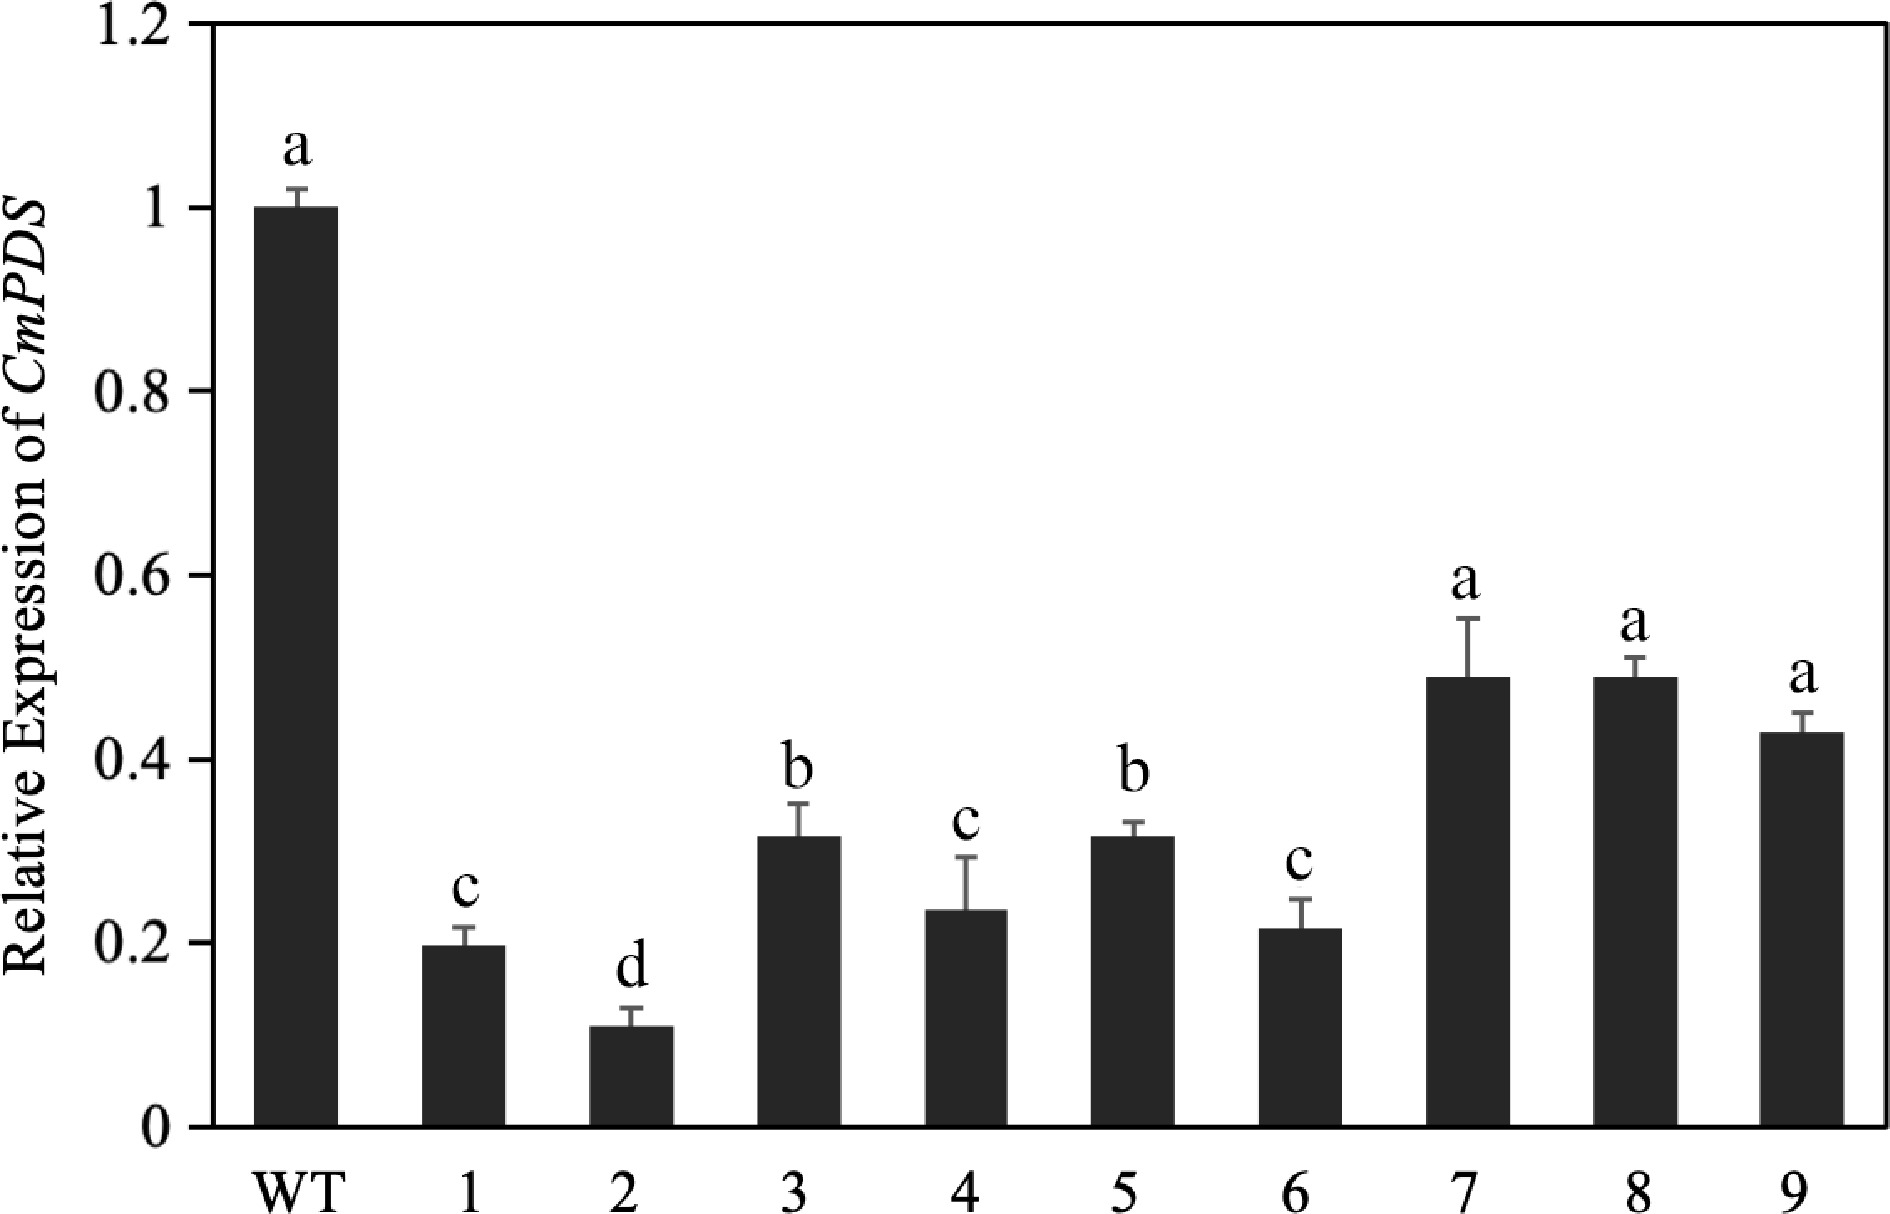
Figure 1.
Relative expression of CmPDS after transient silencing, as determined by RT-qPCR. Different lowercase letters indicate significant differences between different treatments at the same time (p < 0.05).
-
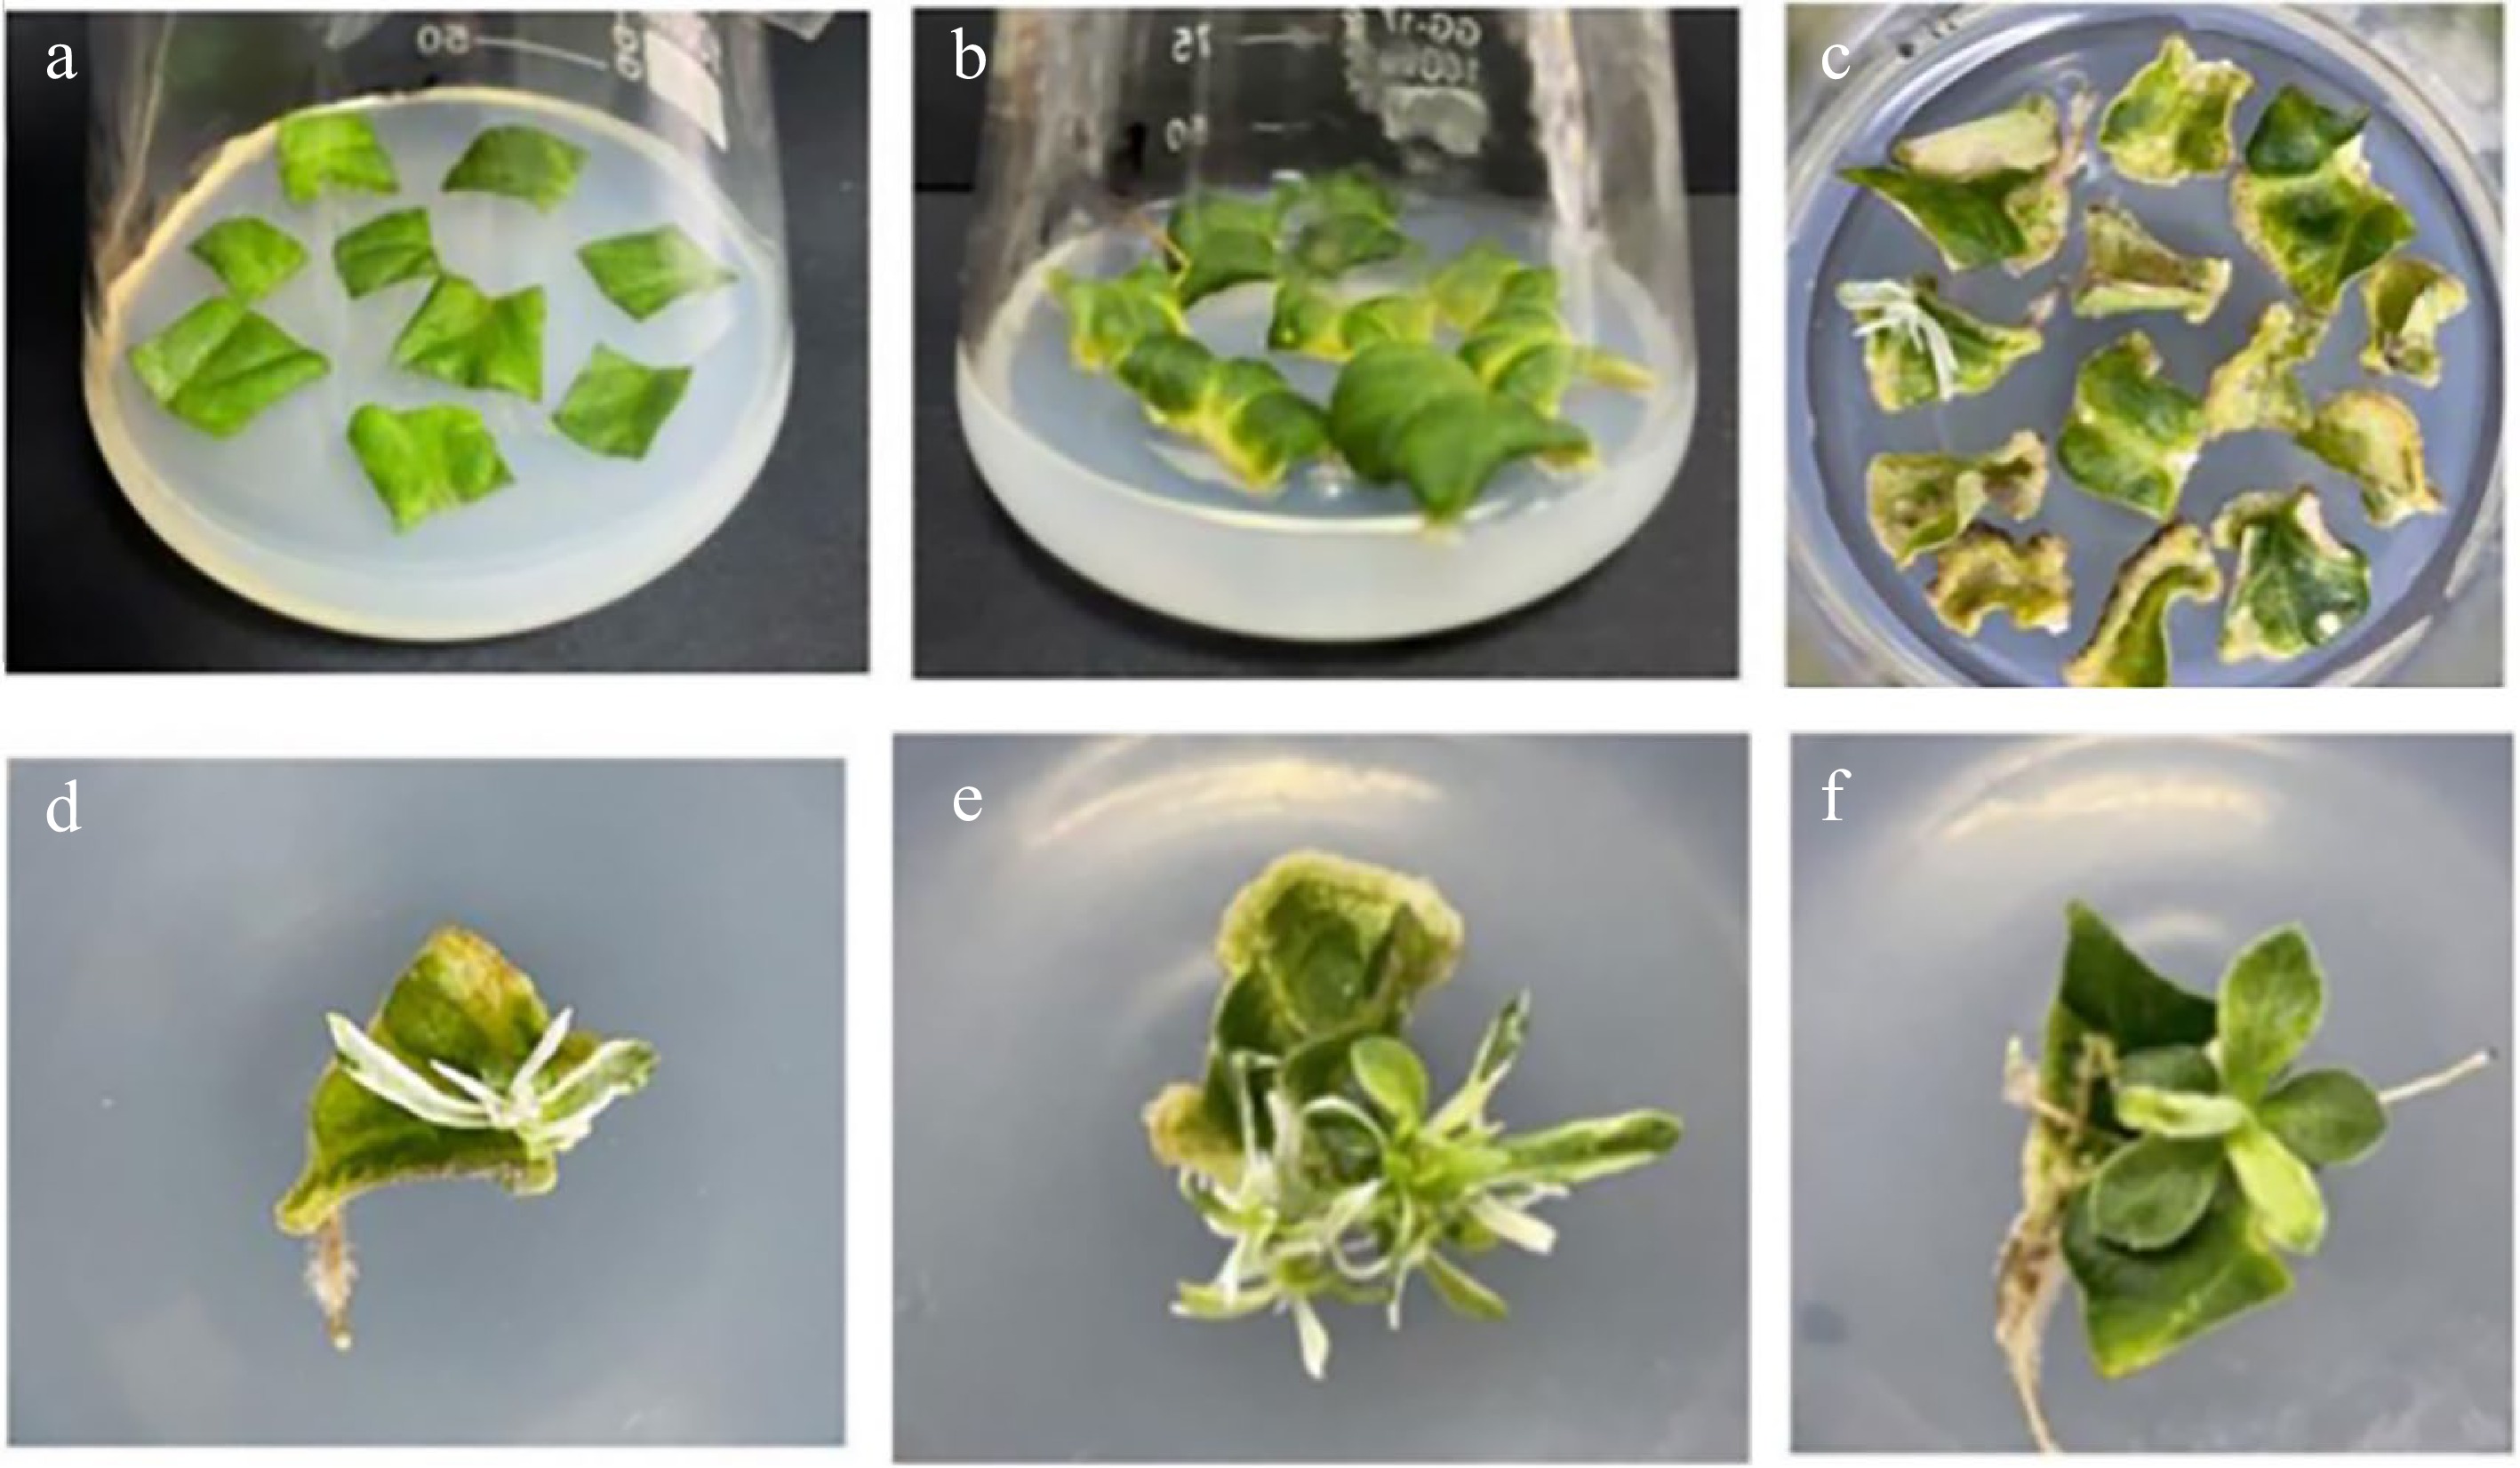
Figure 2.
Process for genetic transformation of C. morifolium. (a) Preculture. (b) Coculture. (c) Screening and cultivation. (d) Albino plant. (e) Interalbino plant. (f) Negative control plant.
-
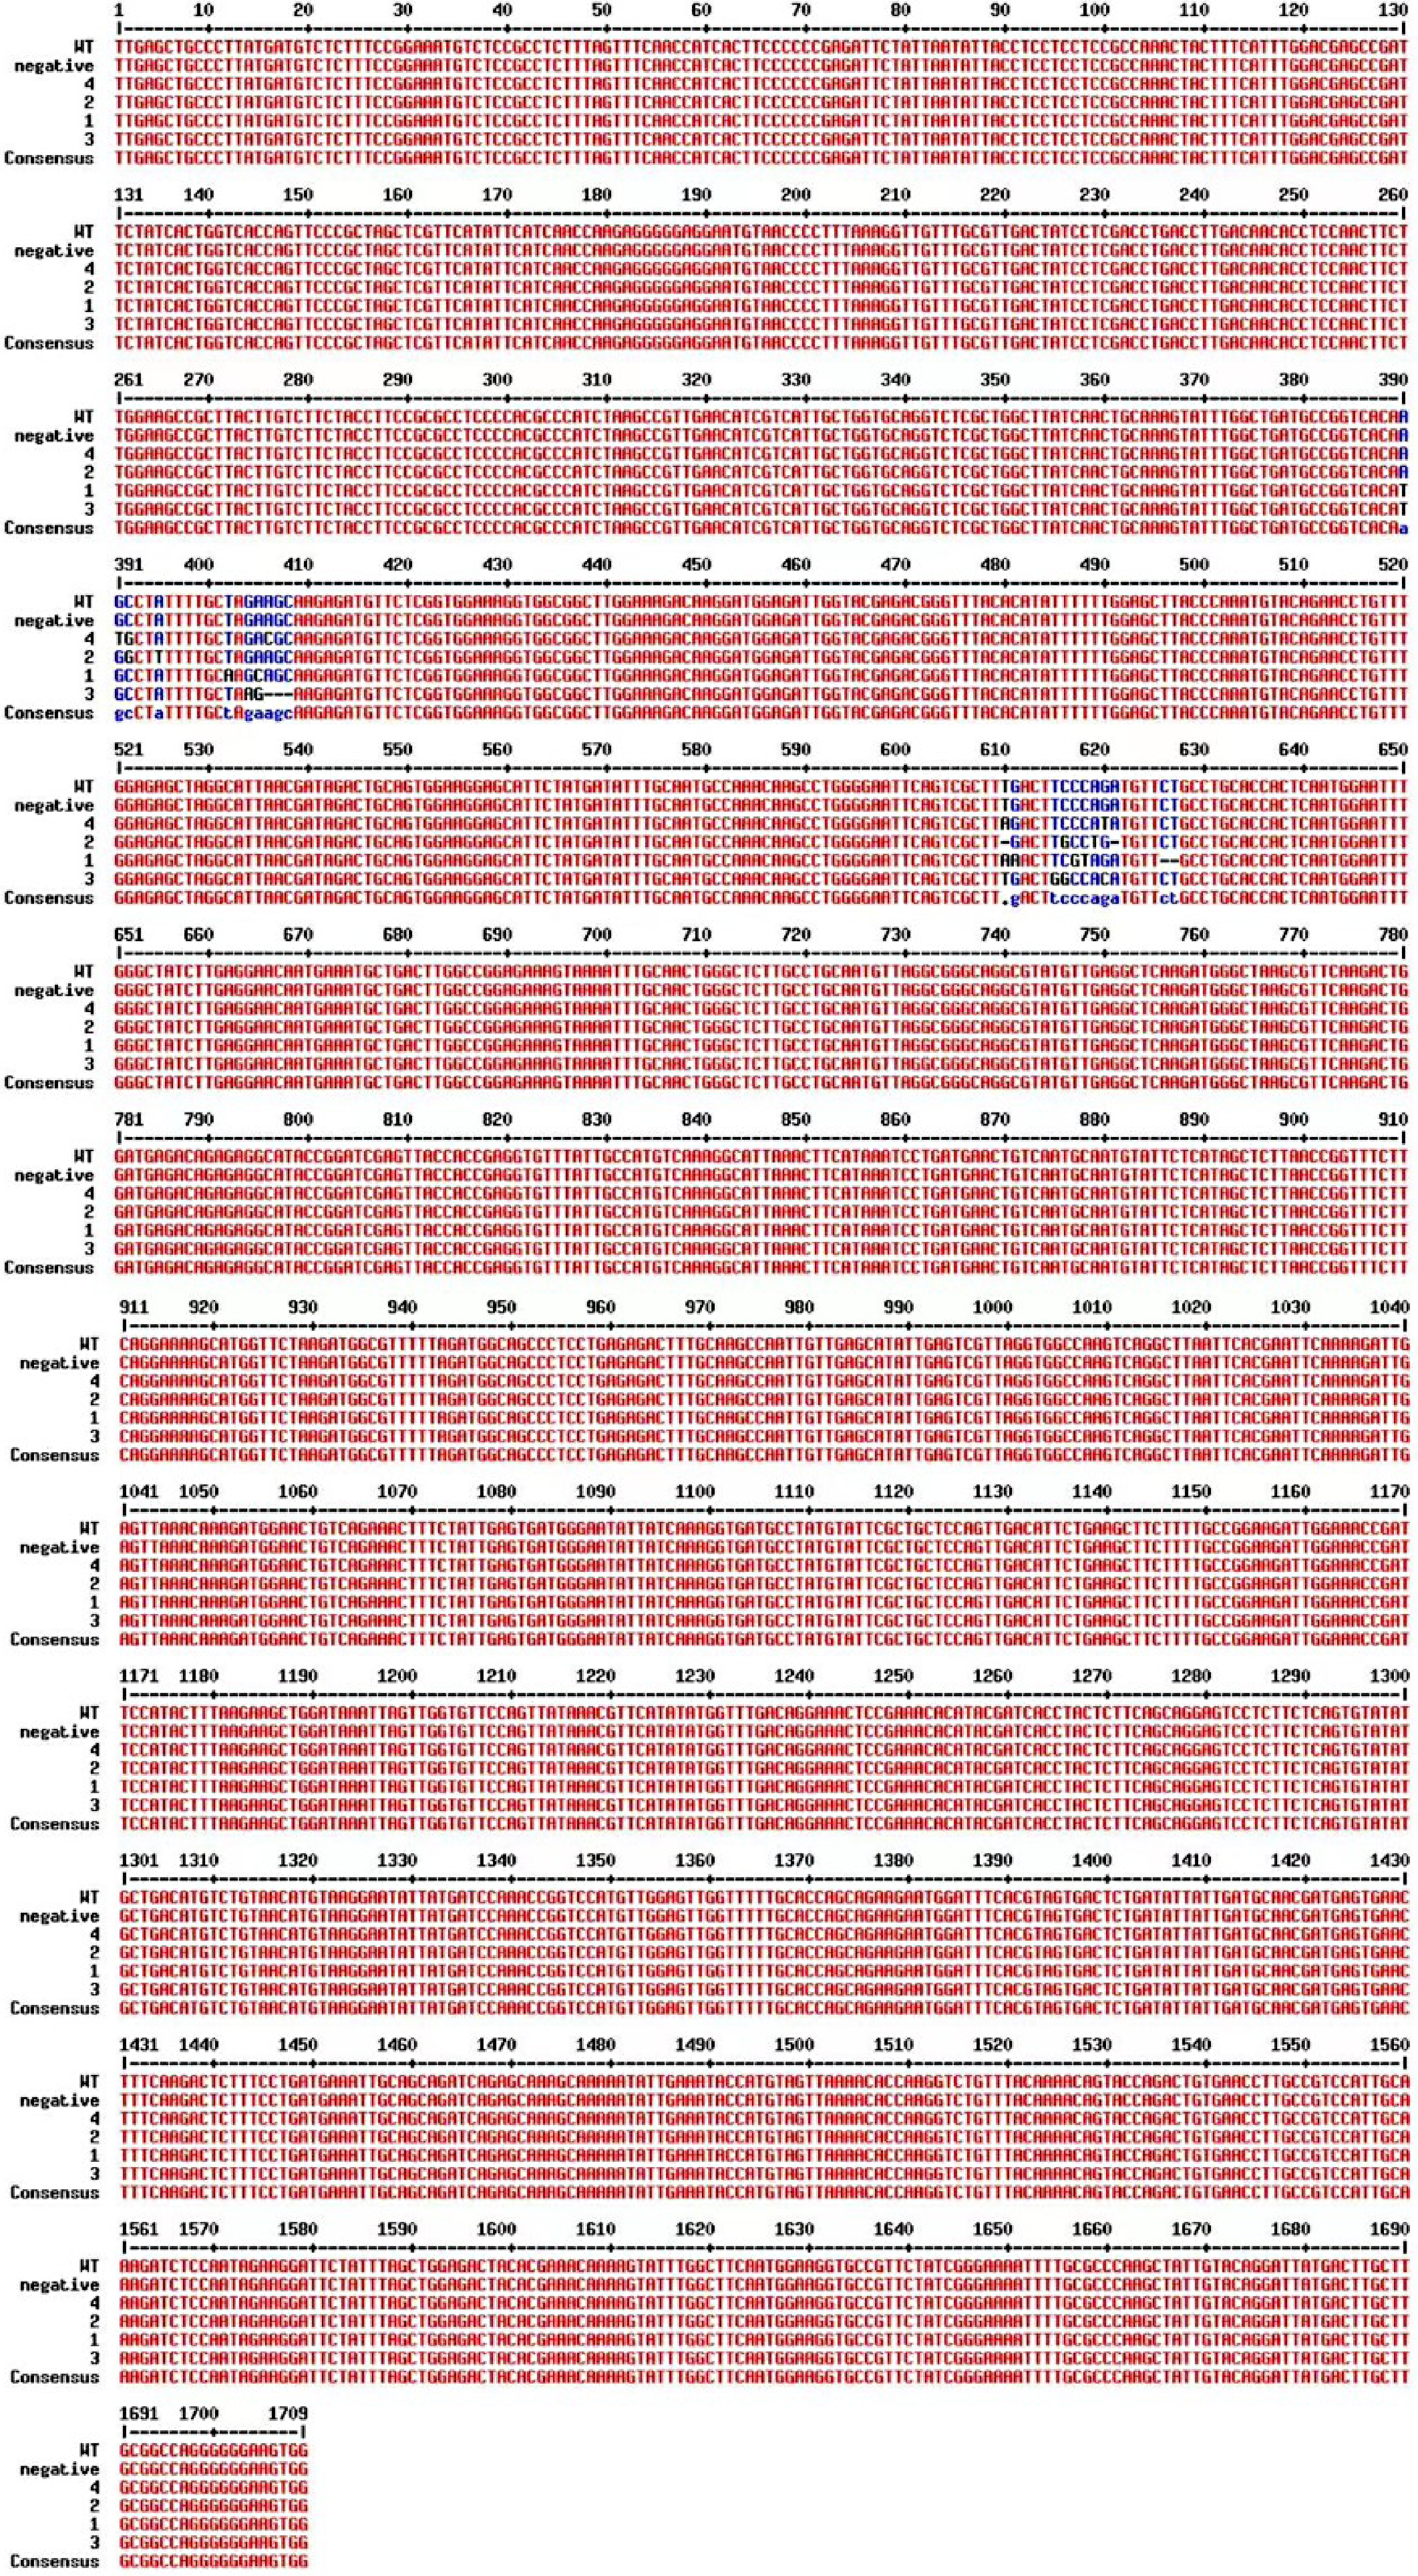
Figure 3.
Sequence alignment of CmPDS from transgenic plants along with the WT and the negative control plants.
-

Figure 4.
Relative expression of CmTGA1 after transient silencing, as determined by RT-qPCR. Different lowercase letters indicate significant differences between different treatments at the same time (p < 0.05).
-
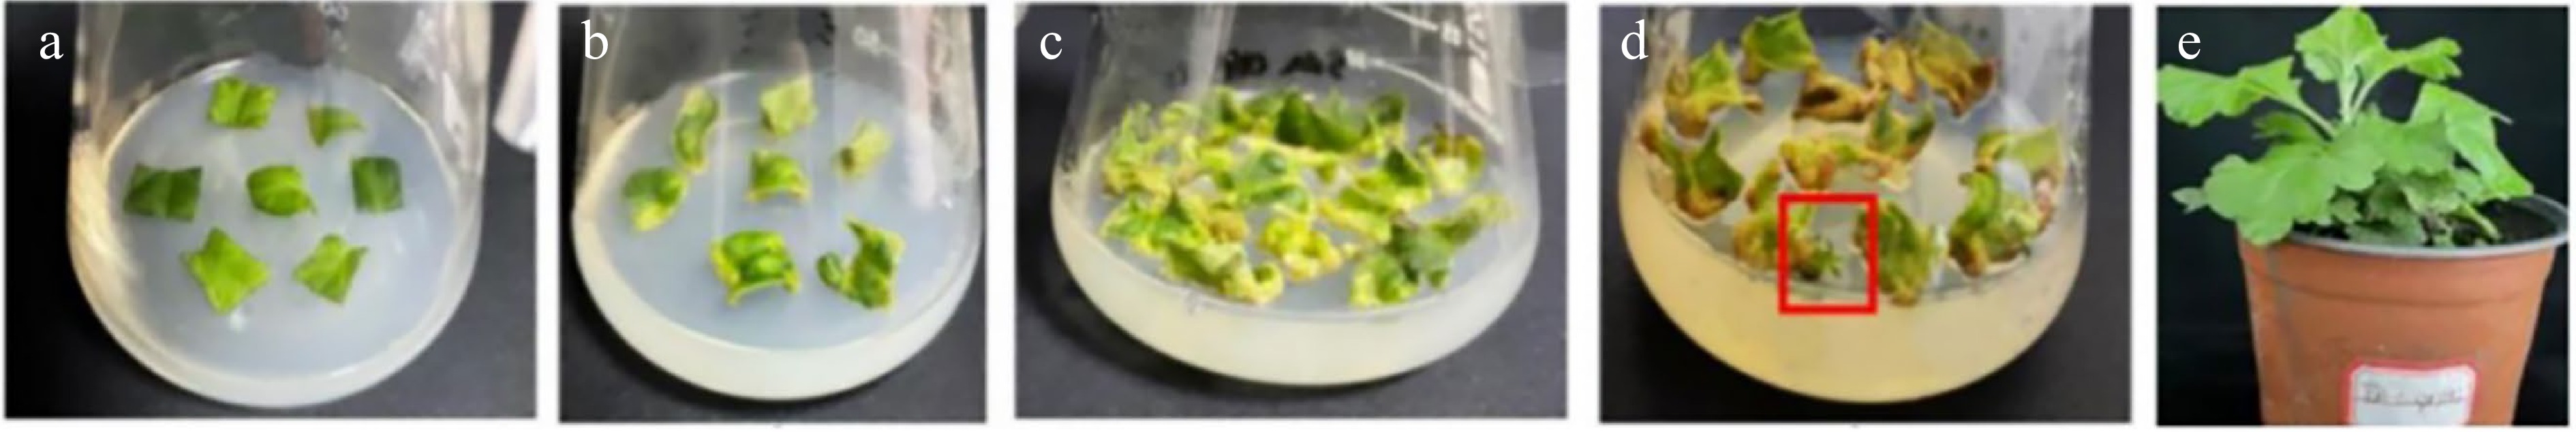
Figure 5.
Process for genetic transformation of C. morifolium. (a) Preculture. (b) Coculture. (c) Delayed cultivation. (d) Screening and cultivation (the red box highlights a resistant bud). (e) Transgenic plant.
-
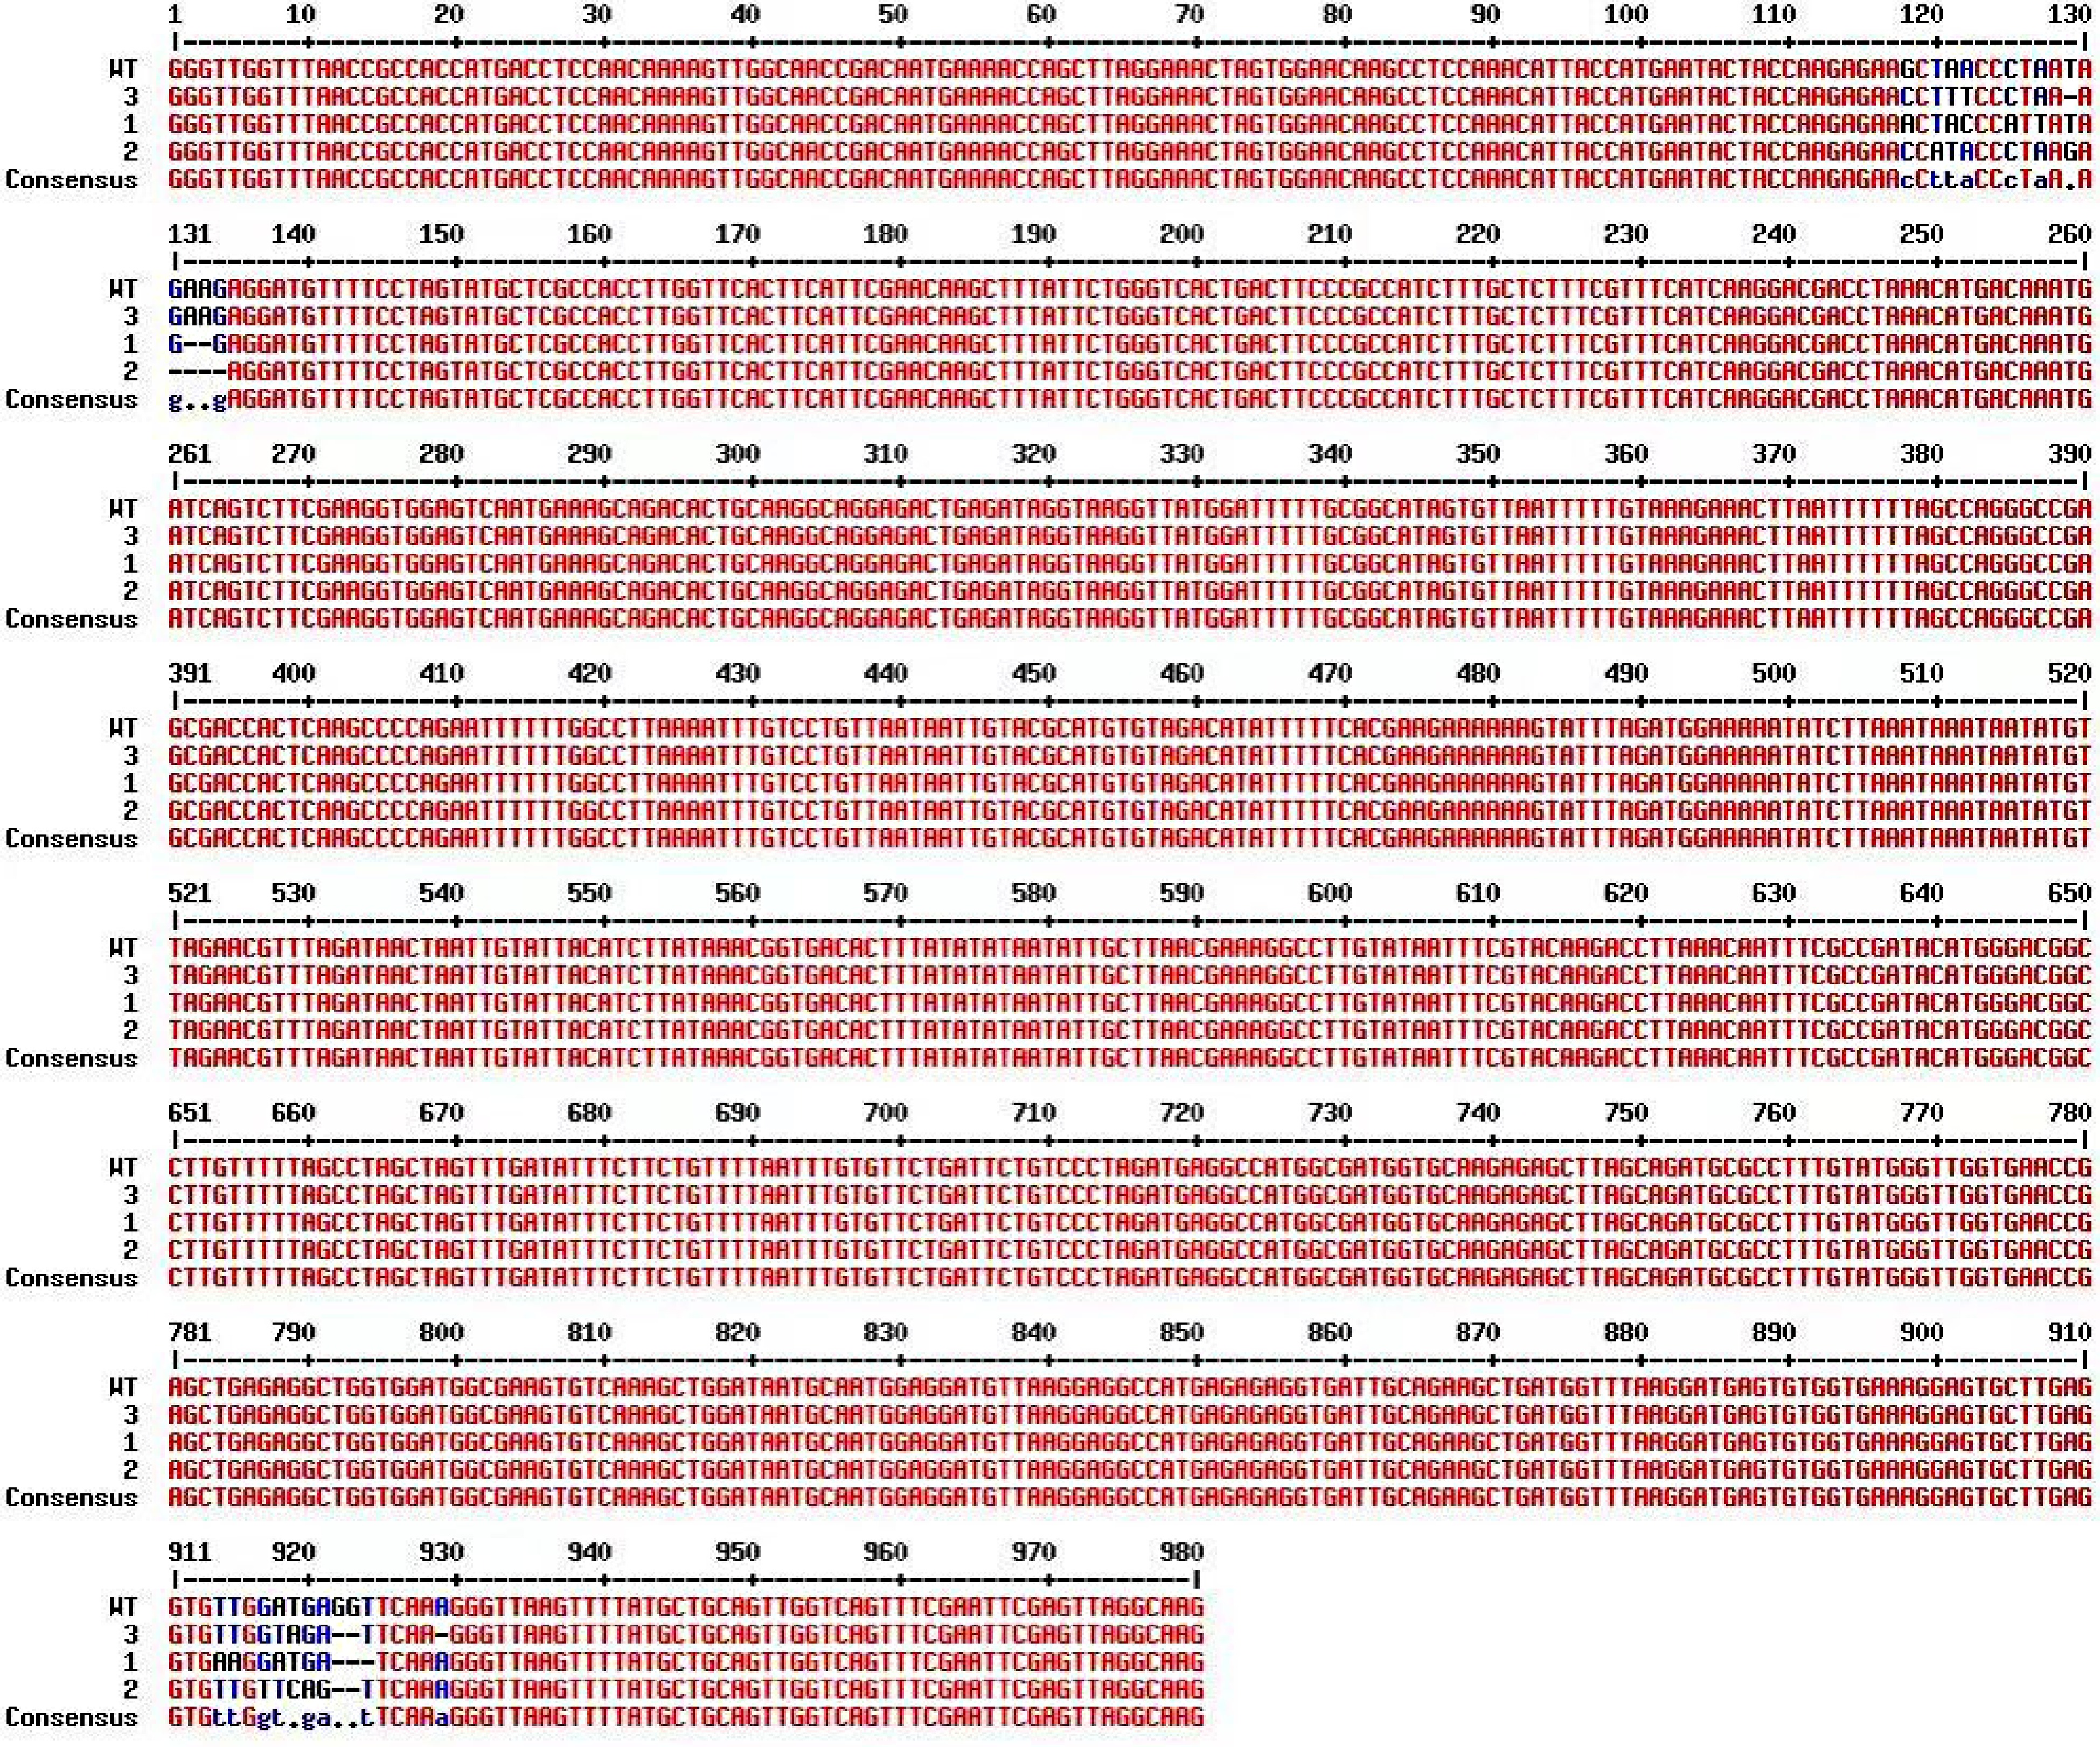
Figure 6.
Sequence alignment of CmTGA1 from transgenic plants compared to the WT.
-
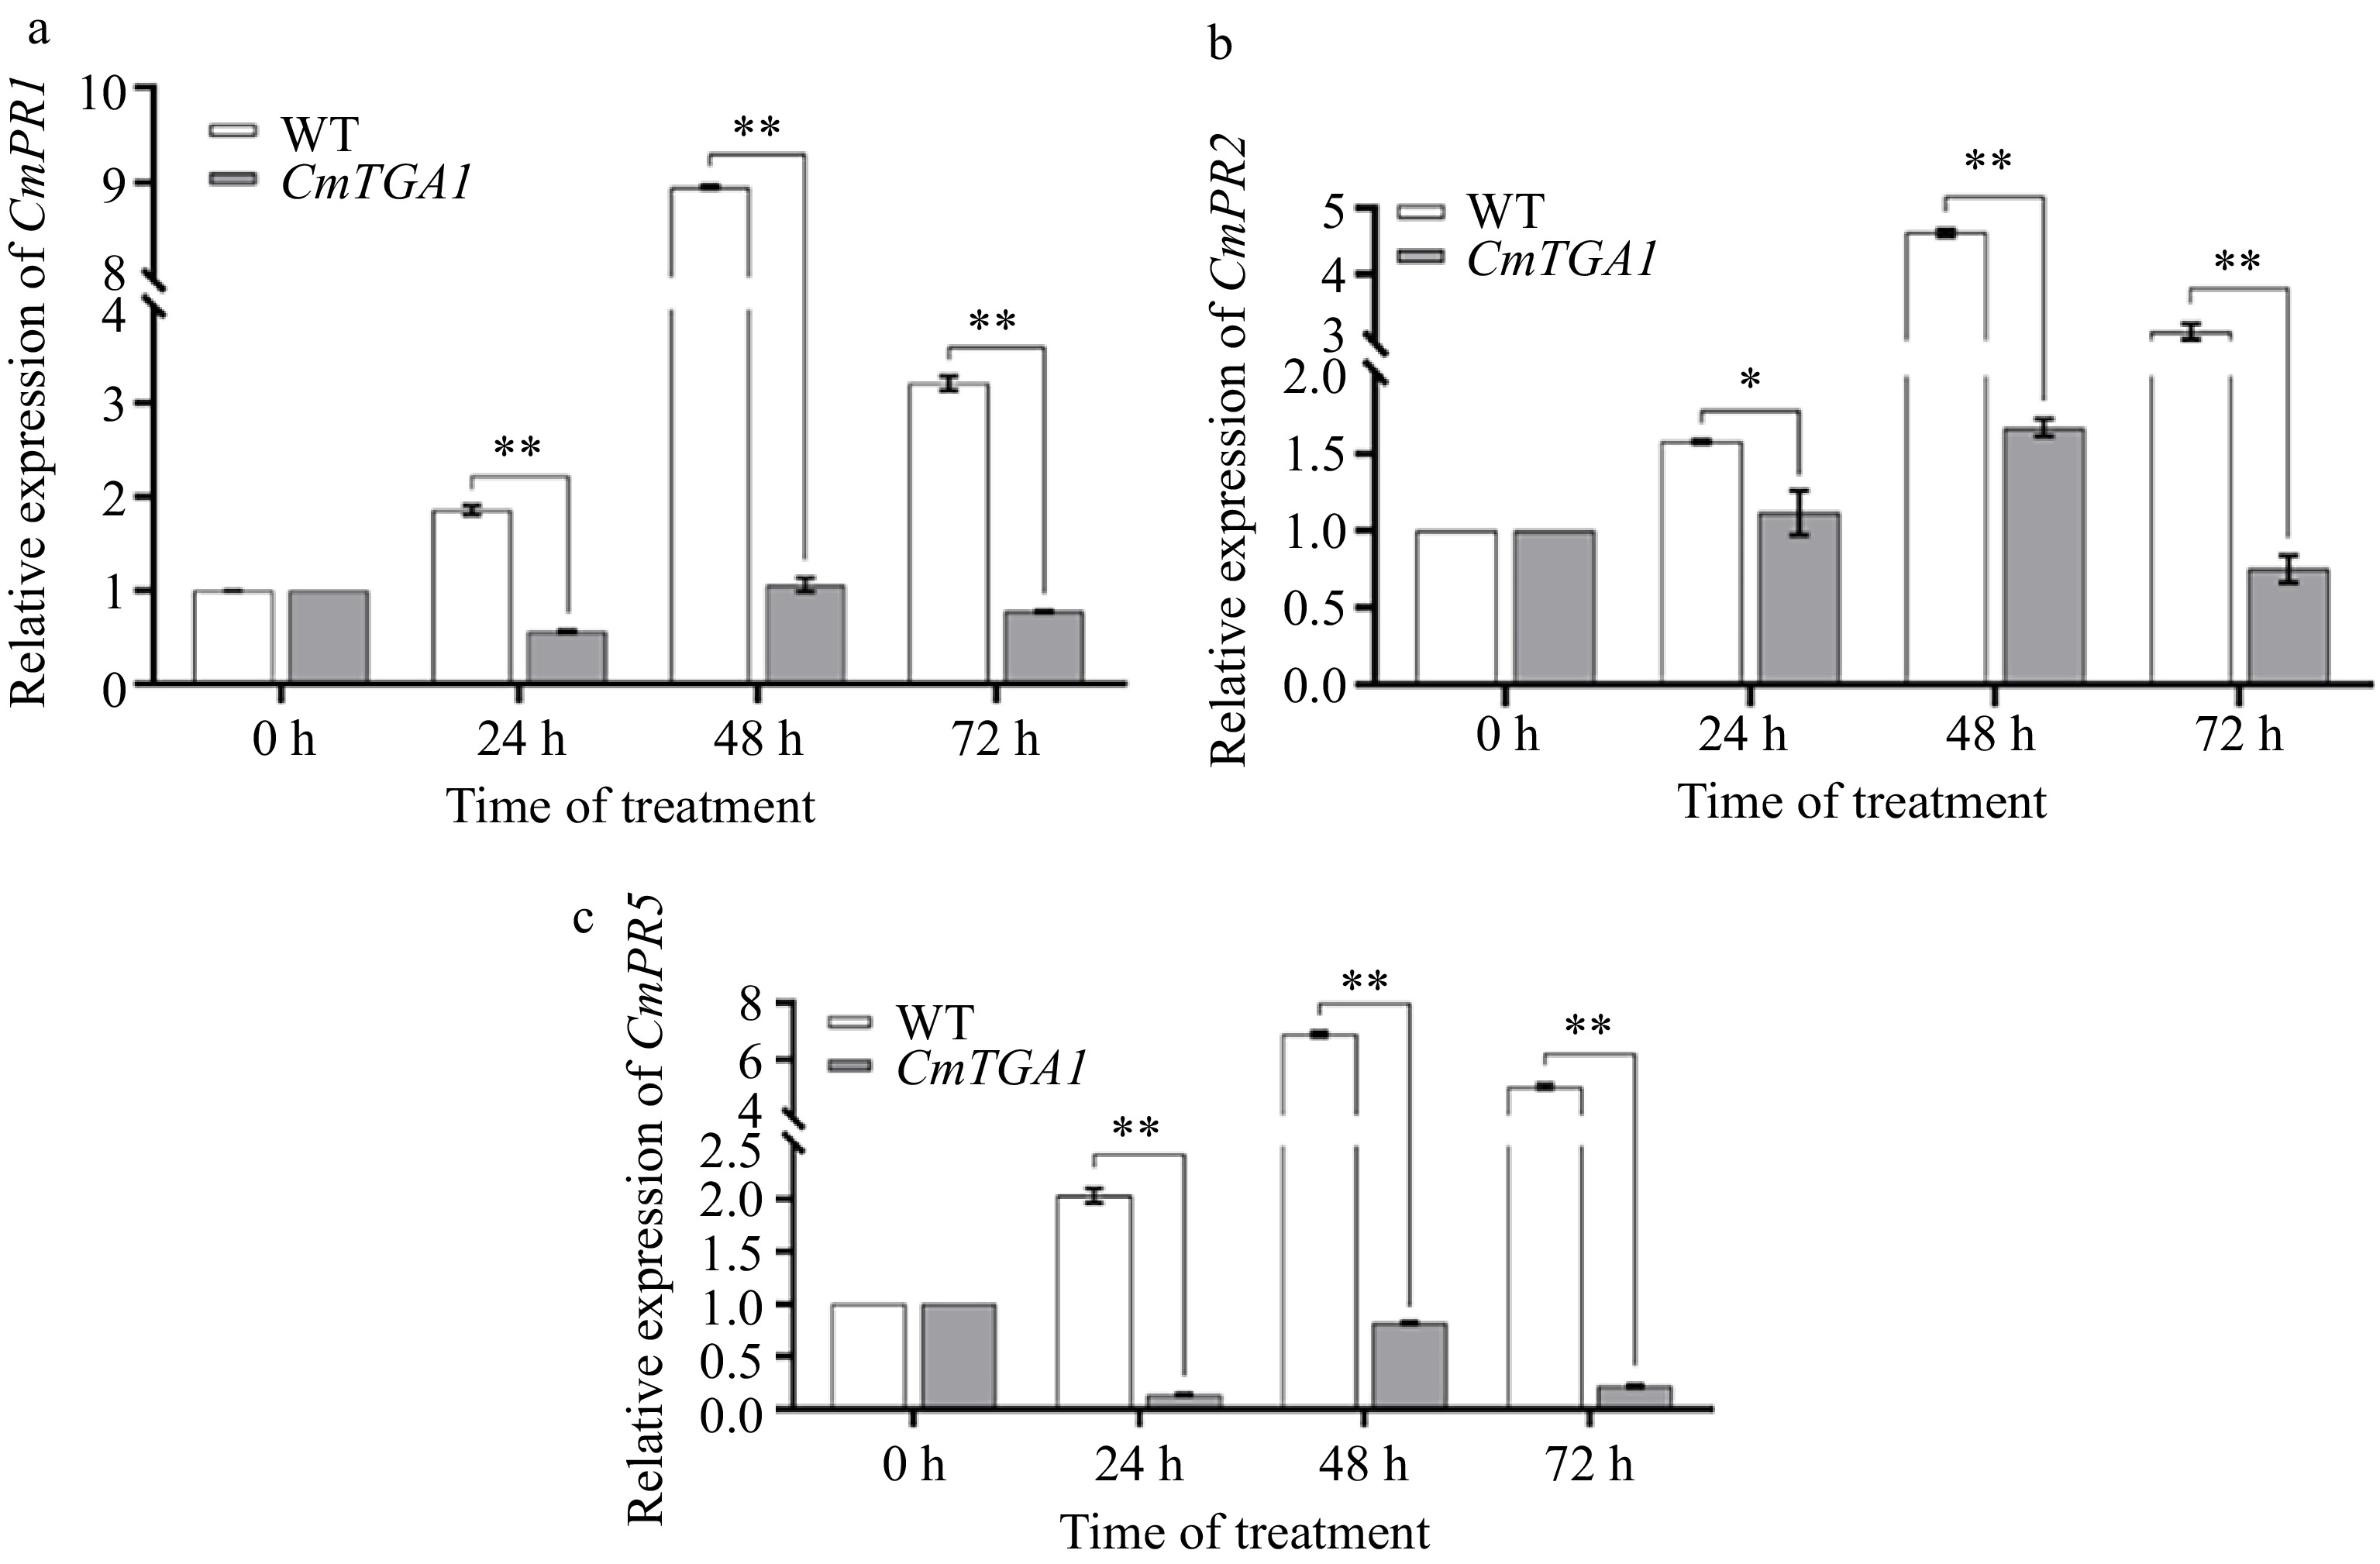
Figure 7.
Expression of CmPR1, CmPR2 and CmPR5 genes in WT and CmTGA1 lines after inoculation with P. horiana. (a) Expression of CmPR1. (b) Expression of CmPR2. (c) Expression of CmPR5. Analysis of significant differences was performed using Student's t-test (**, p < 0.01).
-
Primer
namePrimer sequence PDST1-BsF ATATATGGTCTCGATTGTGCCTGCACCATTGAATGGGTT PDST1-F0 TGTGCCTGCACCATTGAATGGGTTTTAGAGCTAGAAATAGC PDST2-R0 AACTTGGCTTGCAAAGTCTCTCCAATCTCTTAGTCGACTCTAC PDST2-BsR ATTATTGGTCTCGAAACTTGGCTTGCAAAGTCTCTCCAA TGA1T1-BsF ATATATGGTCTCGATTGAAGCTAACCCTAATAGAAGGTT TGA1T1-F0 TGAAGCTAACCCTAATAGAAGGTTTTAGAGCTAGAAATAGC TGA1T2-R0 AACGAATAAAGCTTGTTCGAATCAATCTCTTAGTCGACTCTAC TGA1T2-BsR ATTATTGGTCTCGAAACGAATAAAGCTTGTTCGAATCAA PDS-TF GTACAGAACCTGTTTGGAGAGTTA PDS-TR CTTCCGGCAAAAGAAGCTTCAGAA TGA1-TF ATGAGCATCCTTGAAACAACATTC TGA1-TR TCATAGTGTTTGAGTTGCCATCAT Table 1.
Primers used for mutant identification.
-
Primer name Primer sequence PR1-F CCTTAAACCCAATCTCACAATG PR1-R TGAGTGCGTTGGTGGAGTT PR2-F TCGACTGACATAAGGCACATAACGC PR2-R GCTTCCATAACCTCCATCTCCTTCG PR5-F CCAATGGAGTTTAGCCCCGT PR5-R GTCCACAACTACCACGCTCA Actin-F TCCGTTGCCCTGAGGTTCT Actin-R GATTTCCTTGCTCATCCTGTCA Table 2.
Primers used for RT-PCR.
Figures
(7)
Tables
(2)