-
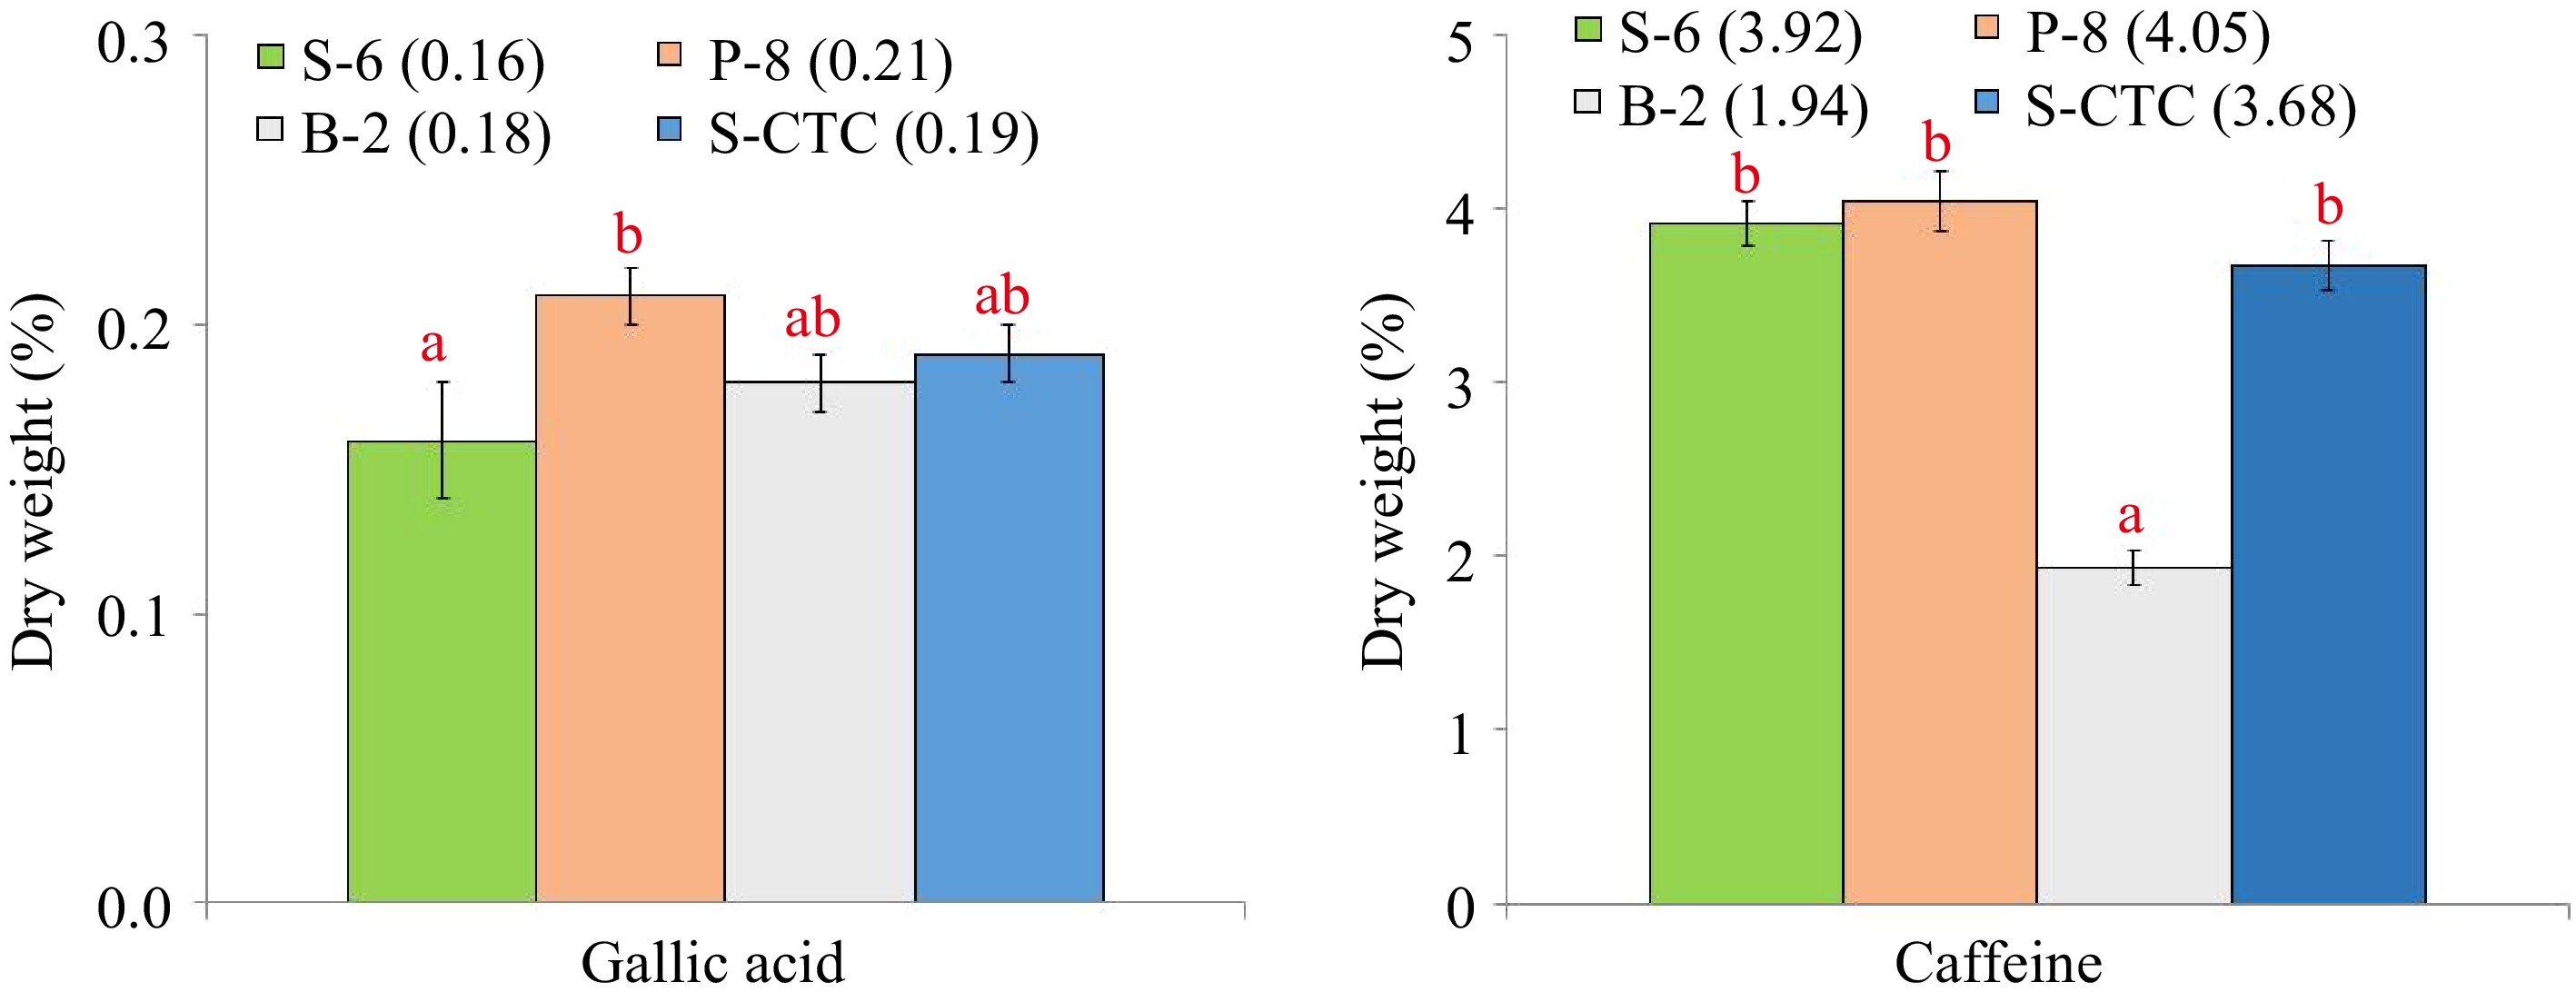
Figure 1.
Content (% dry weight) of gallic acid and caffeine of green tea samples processed by different methods. Values are represented as mean ± SE. Different lowercase letters on top of the bars indicate significant difference by ANOVA with Duncan multiple test range at p < 0.05; S-6, steam-roasting for 6 min; P-8, pan-firing for 8 min; B-2, blanching for 2 min; S-CTC, steam-roasting for 2 min followed by two CTC cuts.
-
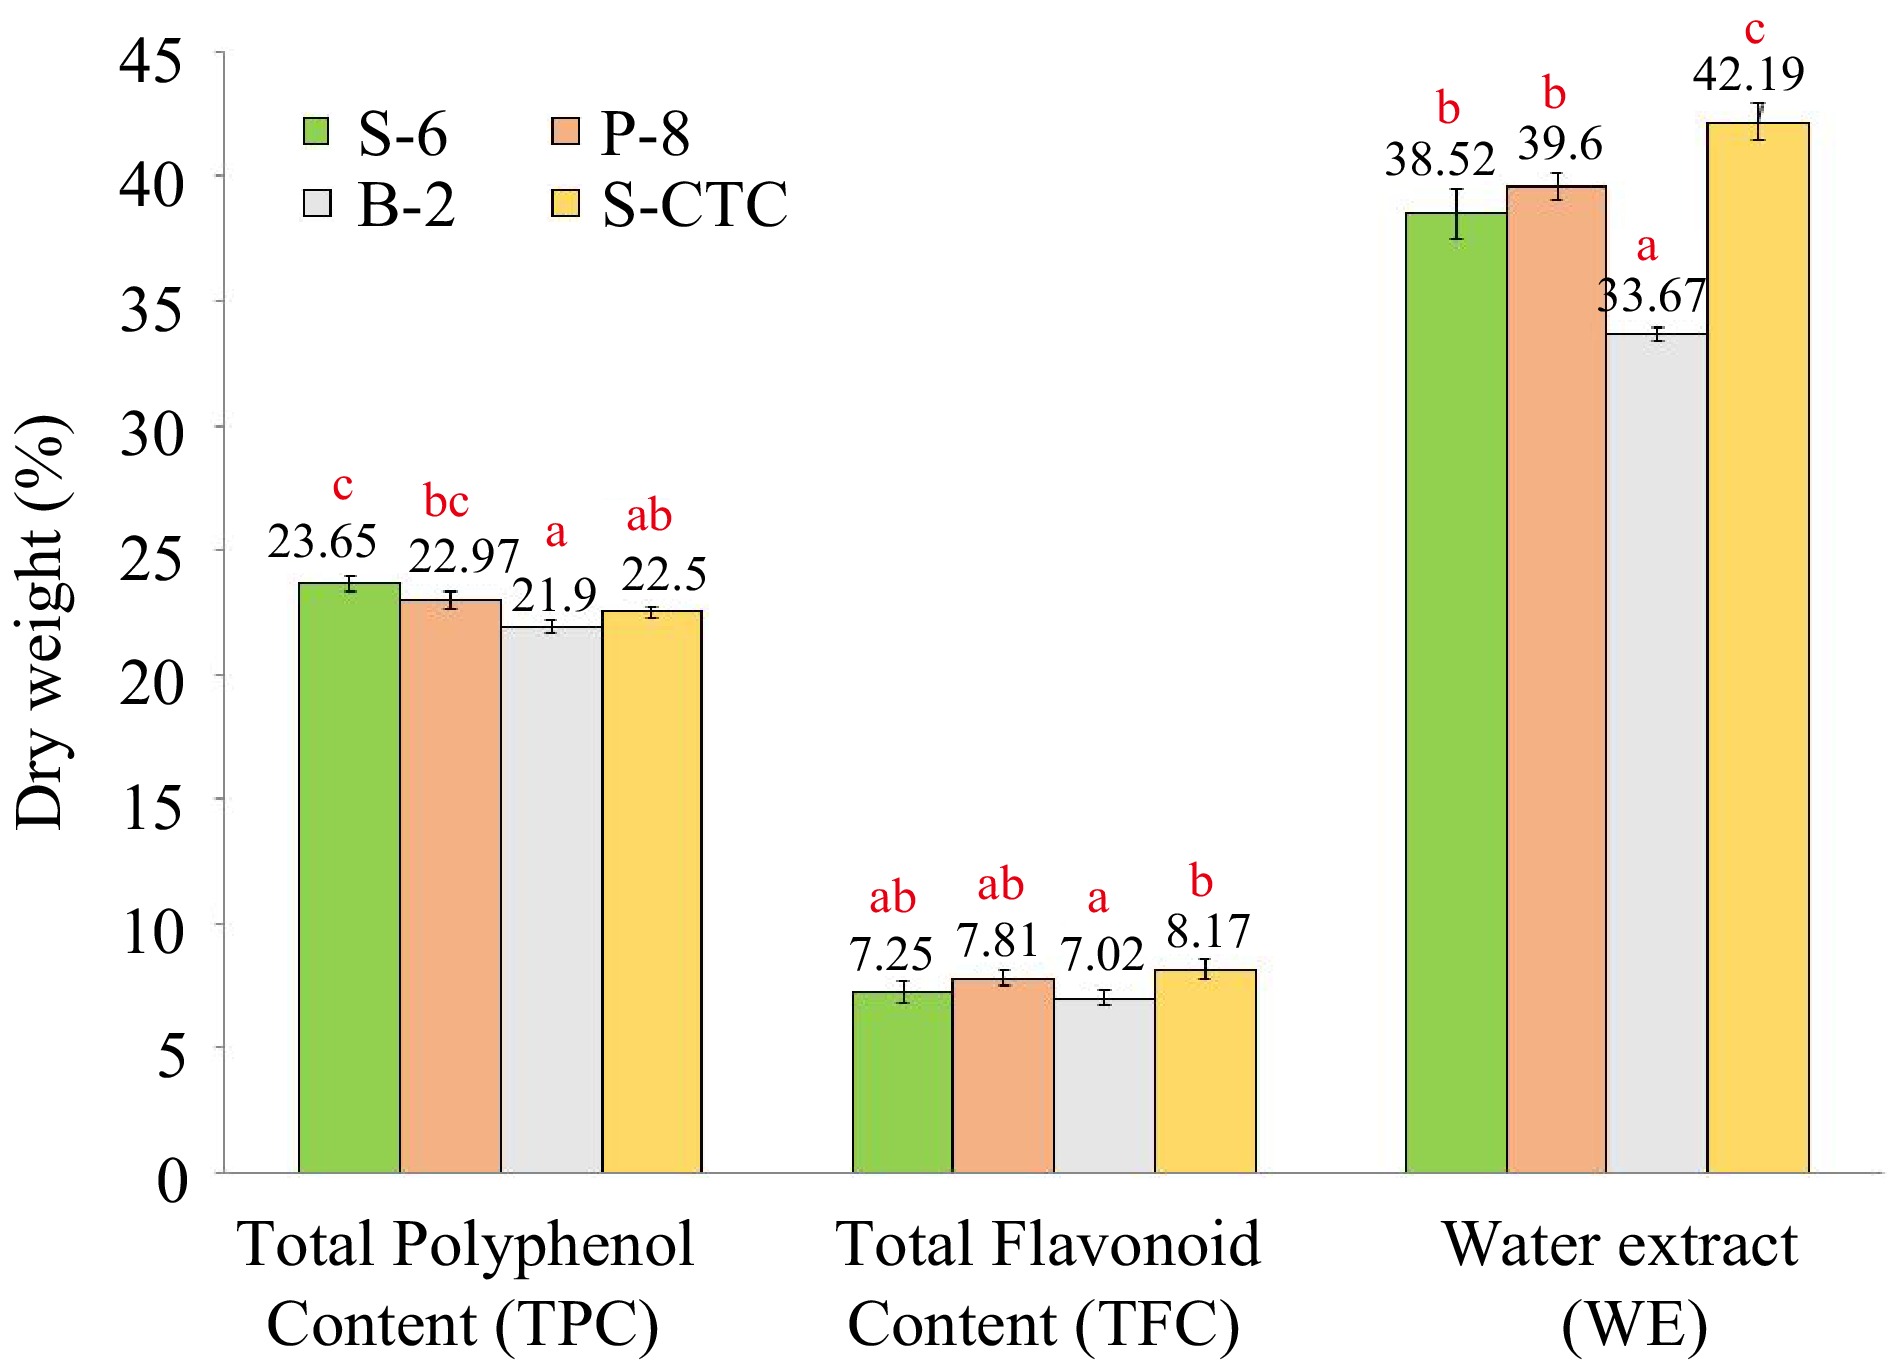
Figure 2.
Content (% dry weight) of total polyphenol, total flavonoid and water extract of green tea samples processed by different methods. Values are represented as mean ± SE. Different lowercase letters on top of the bars indicate significant difference by ANOVA with Duncan multiple test range at p < 0.05; TPC, Total Polyphenol Content; TFC, Total Flavonoid Content; WE, Water Extract; S-6, steam-roasting for 6 min; P-8, pan-firing for 8 min; B-2, blanching for 2 min; S-CTC, steam-roasting for 2 min followed by two CTC cuts.
-
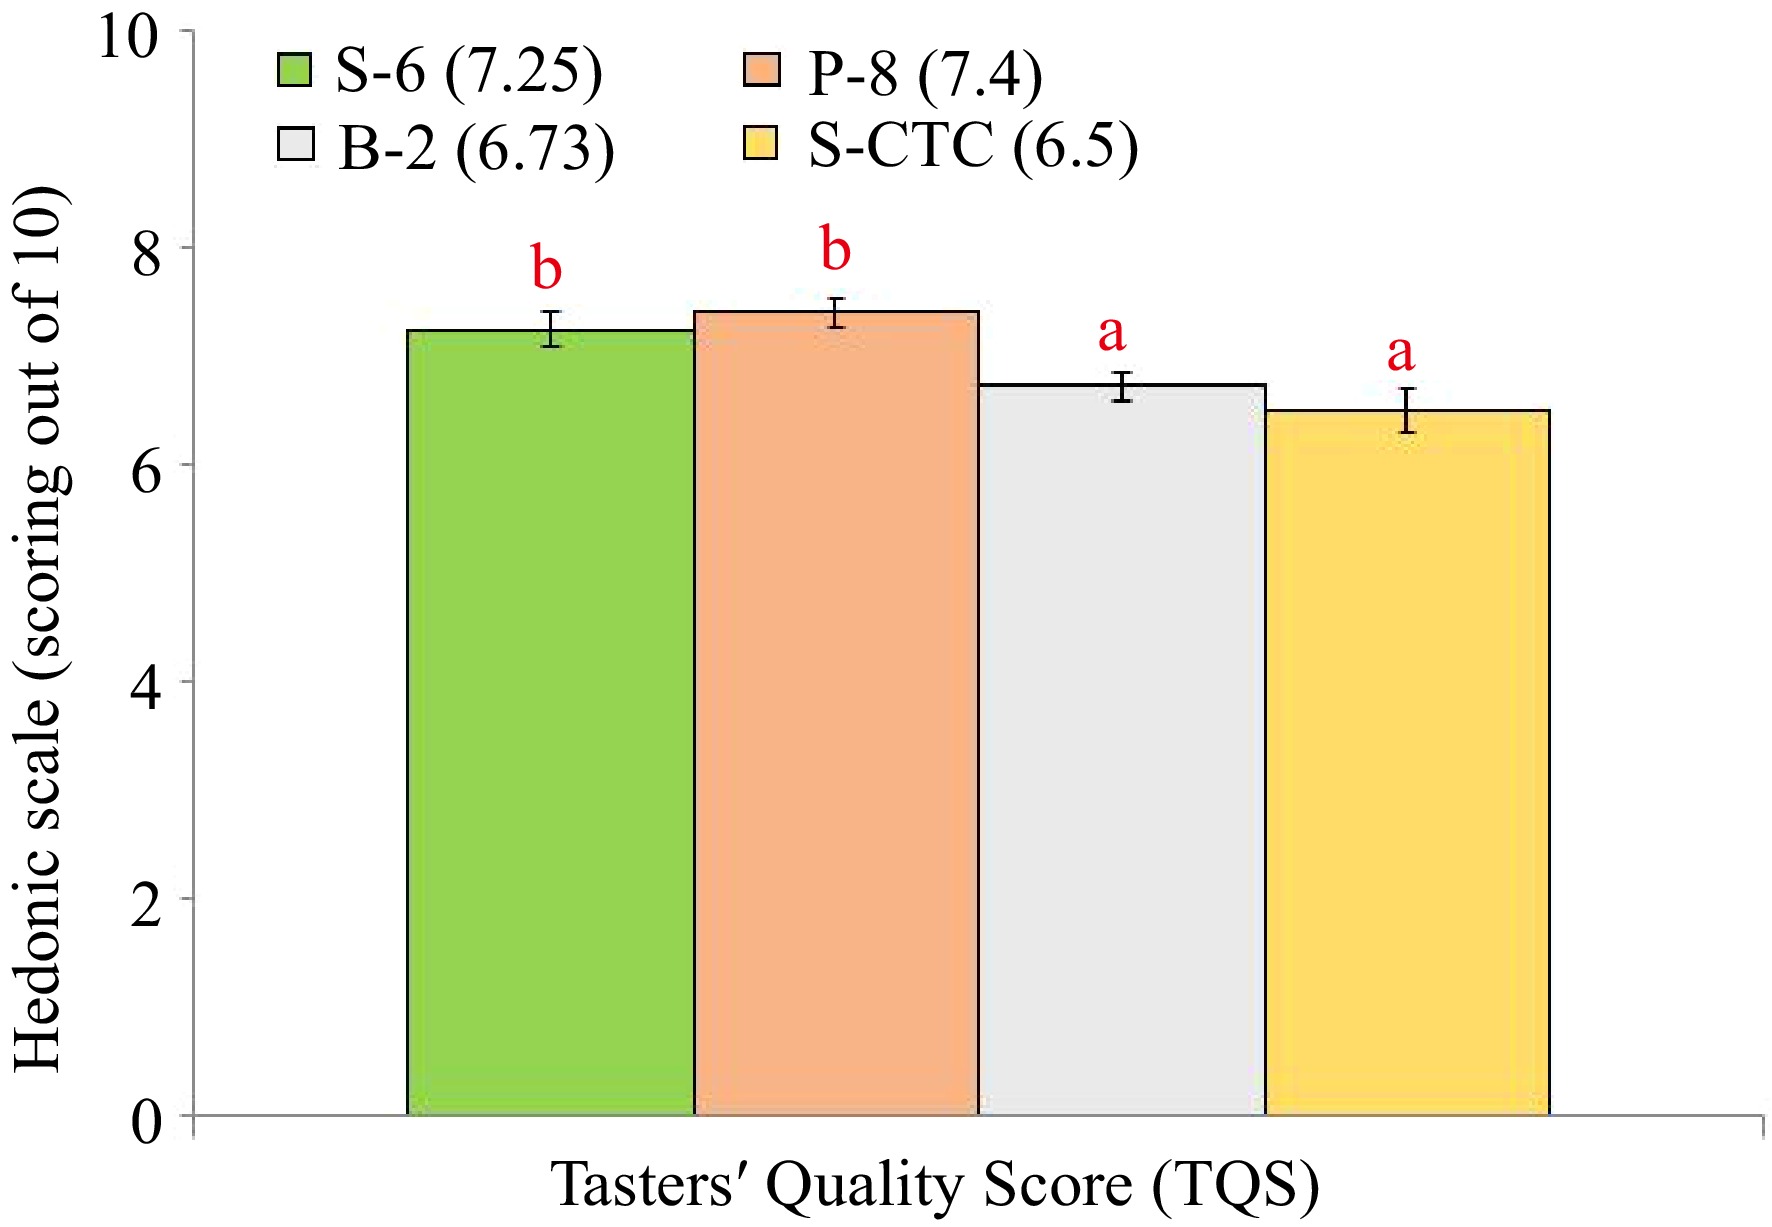
Figure 3.
Taster Quality Score (TQS) of green tea samples processed by different methods. Values are represented as mean ± SE. Different lowercase letters on top of the bars indicate significant difference by ANOVA with Duncan multiple test range at p < 0.05; TQS, Tasters' Quality Scores. S-6, steam-roasting for 6 min; P-8, pan-firing for 8 min; B-2, blanching for 2 min; S-CTC, steam-roasting for 2 min followed by two CTC cuts.
-
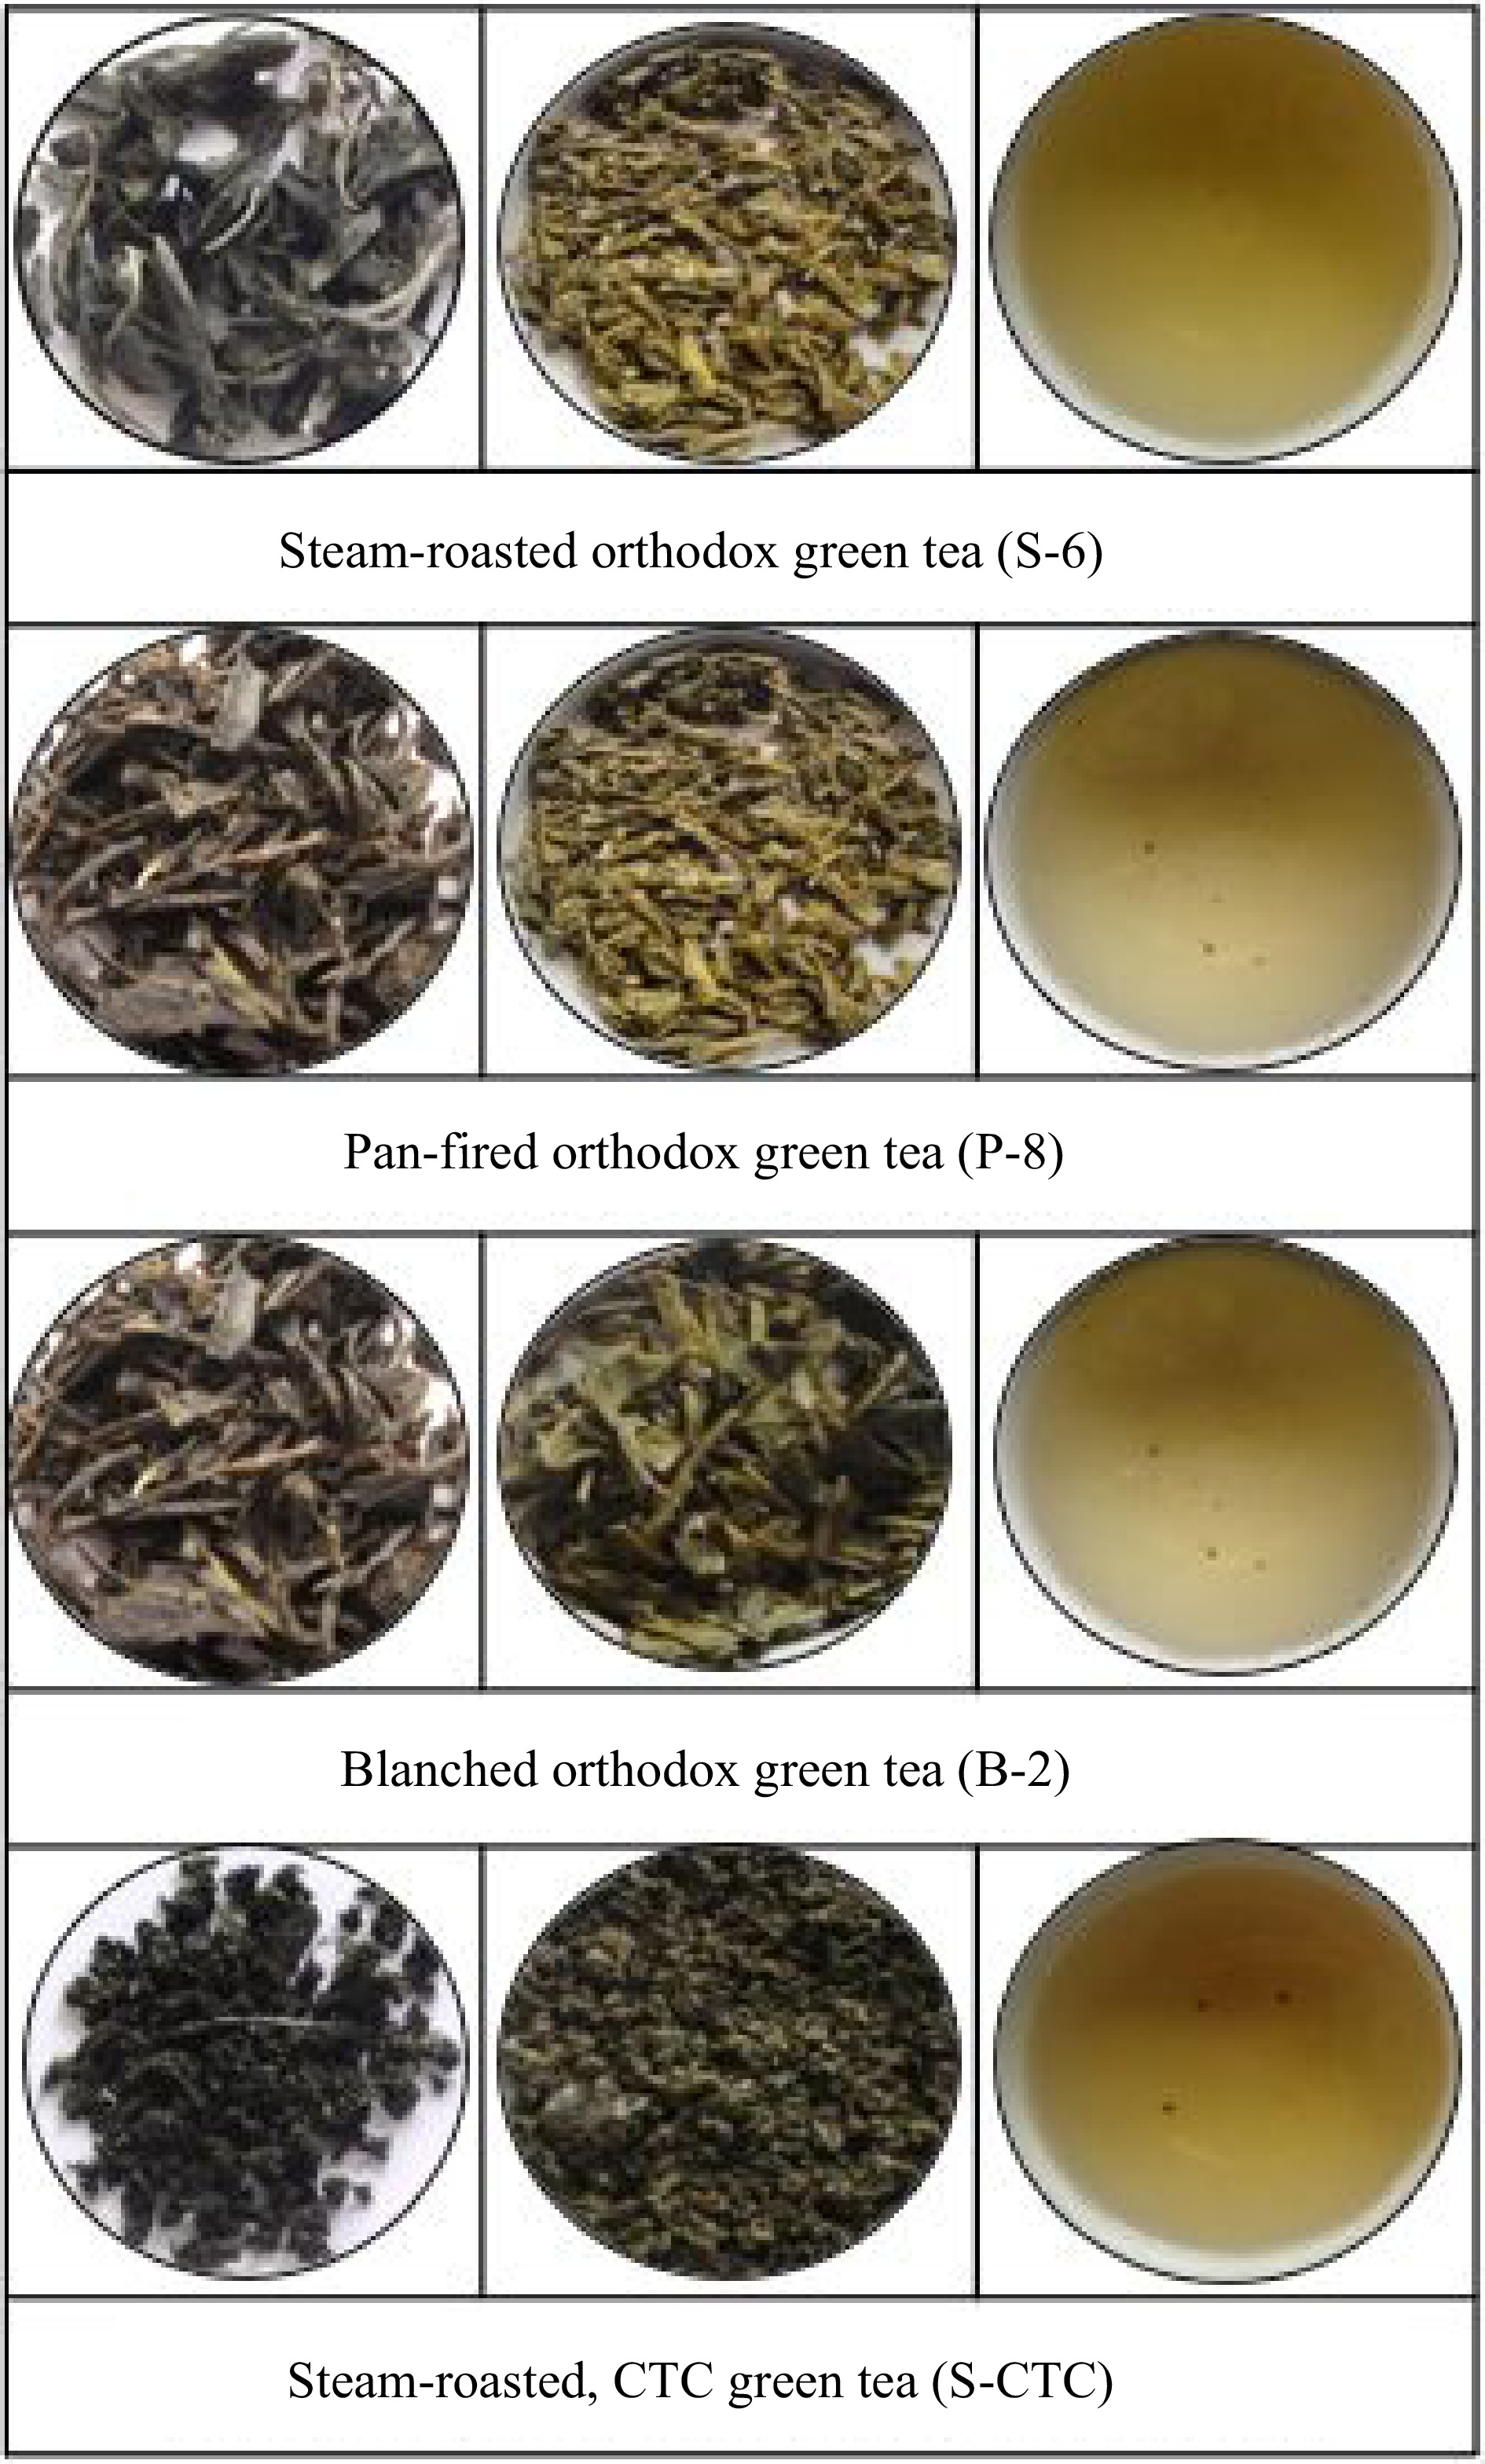
Figure 4.
Representative pictures of dry leaf appearance, infused leaf and liquor colour of green tea processed by different processing methods, used for organoleptic evaluation.
-
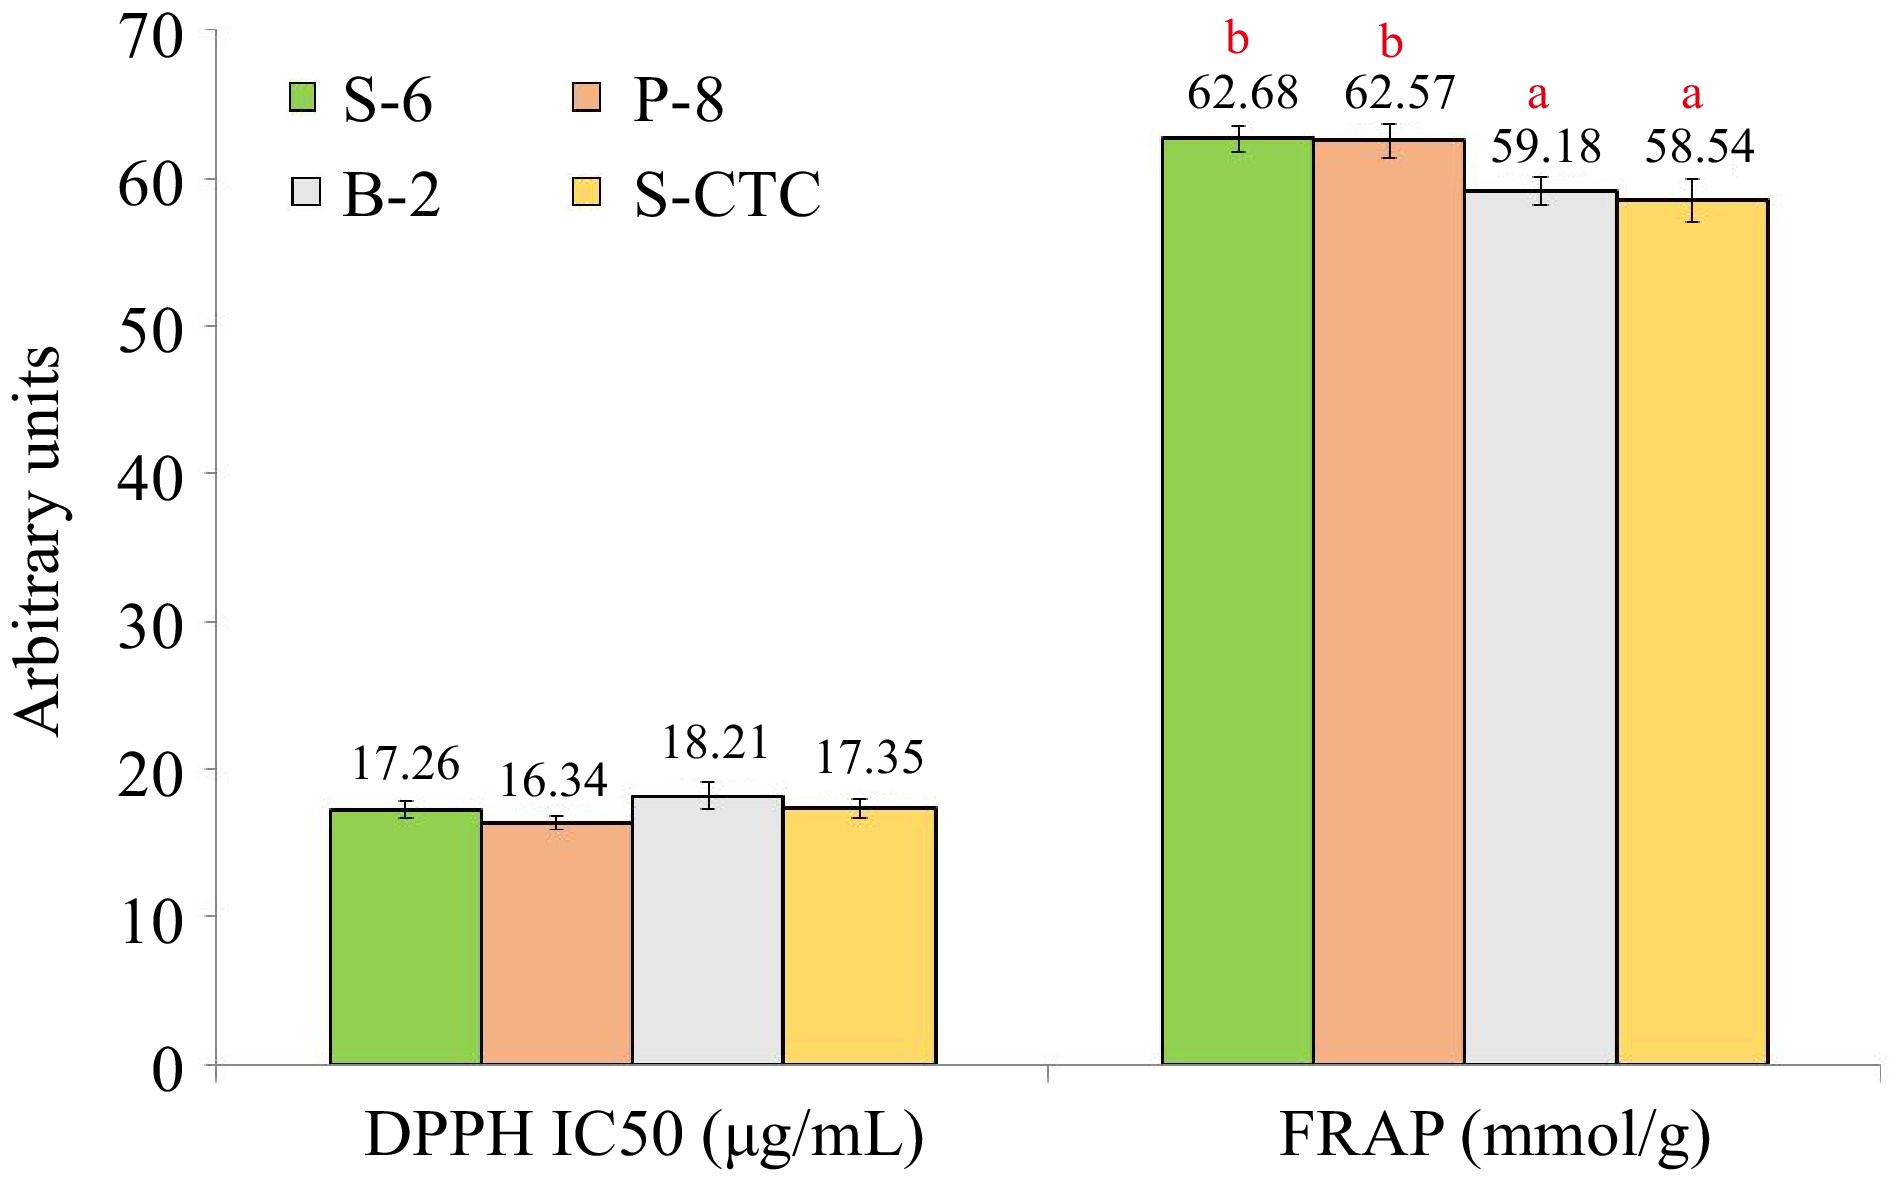
Figure 5.
Anti-oxidant activity in terms of DPPH and FRAP assay values of green tea samples processed by different methods. Values are represented as mean ± SE. Different lowercase letters on top of the bars indicate significant difference by ANOVA with Duncan multiple test range at p < 0.05; DPPH, 1,1-diphenyl-2-picrylhydrazyl (DPPH) free radical-scavenging ability; FRAP, Ferric reducing antioxidant power; S-6, steam-roasting for 6 min; P-8, pan-firing for 8 min; B-2, blanching for 2 min; S-CTC, steam-roasting for 2 min followed by two CTC cuts.
-
Process type Catechin fractions Total catechins (TC) C EC EGC EGCG ECG S-6 0.99 ± 0.07 1.30 ± 0.06 3.87 ± 0.33 10.49 ± 0.57 2.84 ± 0.25 19.48 ± 0.44ab P-8 0.93 ± 0.03 1.46 ± 0.08 4.35 ± 0.31 10.84 ± 0.50 2.70 ± 0.14 20.26 ± 0.47b B-2 0.95 ± 0.05 1.39 ± 0.07 4.47 ± 0.40 10.79 ± 0.34 2.74 ± 0.25 20.33 ± 0.27b S-CTC 0.94 ± 0.05 1.43 ± 0.07 3.91 ± 0.21 9.84 ± 0.53 2.58 ± 0.21 18.69 ± 0.42a All values are represented as mean ± SE. Values within a column with different letters are significantly different by ANOVA with Duncan multiple test range at p < 0.05. C, (+)-catechin; EC, (−)-epicatechin; EGC, (−)-epigallocatechin; EGCG, (−)-epigallocatechin gallate; ECG, (−)-epicatechin gallate; TC, total catechins. S-6, steam-roasting for 6 min; P-8, panning for 8 min; B-2, blanching for 2 min; S-CTC, steam-roasting for 2 min followed by two CTC cuts. Table 1.
Content (% dry weight) of non-gallated catechins viz. catechin +(C), epicatechin (EC) and epigallocatechin (EGC), gallated catechins viz. epicatechin gallate (ECG) and epigallocatechin gallate (EGCG), in green tea samples processed by different methods.
-
GA EGC C CAFF EC EGCG ECG TC TPC TFC WE TQS GA 1 EGC 0.018 1 C 0.099 −0.529** 1 CAFF 0.090 −0.170 −0.118 1 EC 0.035 0.510** 0.073 −0.186 1 EGCG −0.021 0.093 −0.669** 0.269* −0.514** 1 ECG 0.030 −0.679** 0.767** −0.100 −0.044 −0.430** 1 TC 0.021 0.523** −0.630** 0.084 −0.051 0.809** −0.409** 1 TPC −0.167 −0.073 −0.067 0.514** −0.088 0.175 0.035 0.137 1 TFC 0.158 0.241* 0.437** −0.034 0.612** −0.755** 0.147 −0.443** −0.097 1 WE 0.141 −0.495** 0.273* 0.514** −0.072 −0.326* 0.302* −0.556** 0.149 0.272* 1 TQS 0.126 −0.483** 0.243* 0.399** −0.079 −0.216 0.364** −0.400** 0.173 0.137 0.856** 1 **, Correlation is significant at the 0.01 level (1-tailed). *, Correlation is significant at the 0.05 level (1-tailed). GA, gallic acid; EGC, (−)-epigallocatechin; C, (+)-catechin; CAFF, caffeine; EC, (−)-epicatechin; EGCG, (−)-epigallocatechin gallate; ECG, (−)-epicatechin gallate; TC, total catechins; TPC, total polyphenol content; FC, flavonoid content; WE, eater extract; TQS, Tasters' Quality Score. The direction and magnitude of correlation between variables was quantified by the correlation coefficient r. One-tailed p value: *, p < 0.05; **, p < 0.01. Table 2.
Correlations between gallic acid (GA), epigallocatechin (EGC), catechin (C), caffeine (CFF), epicatechin (EC), epigallocatechin gallate (EGCG), epicatechin gallate (ECG), total catechin (TC), total polyphenol content (TPC), total flavonoid content (TFC), water extract (WE) and tasters' quality score (TQS) in green tea samples processed by different methods.
Figures
(5)
Tables
(2)