-
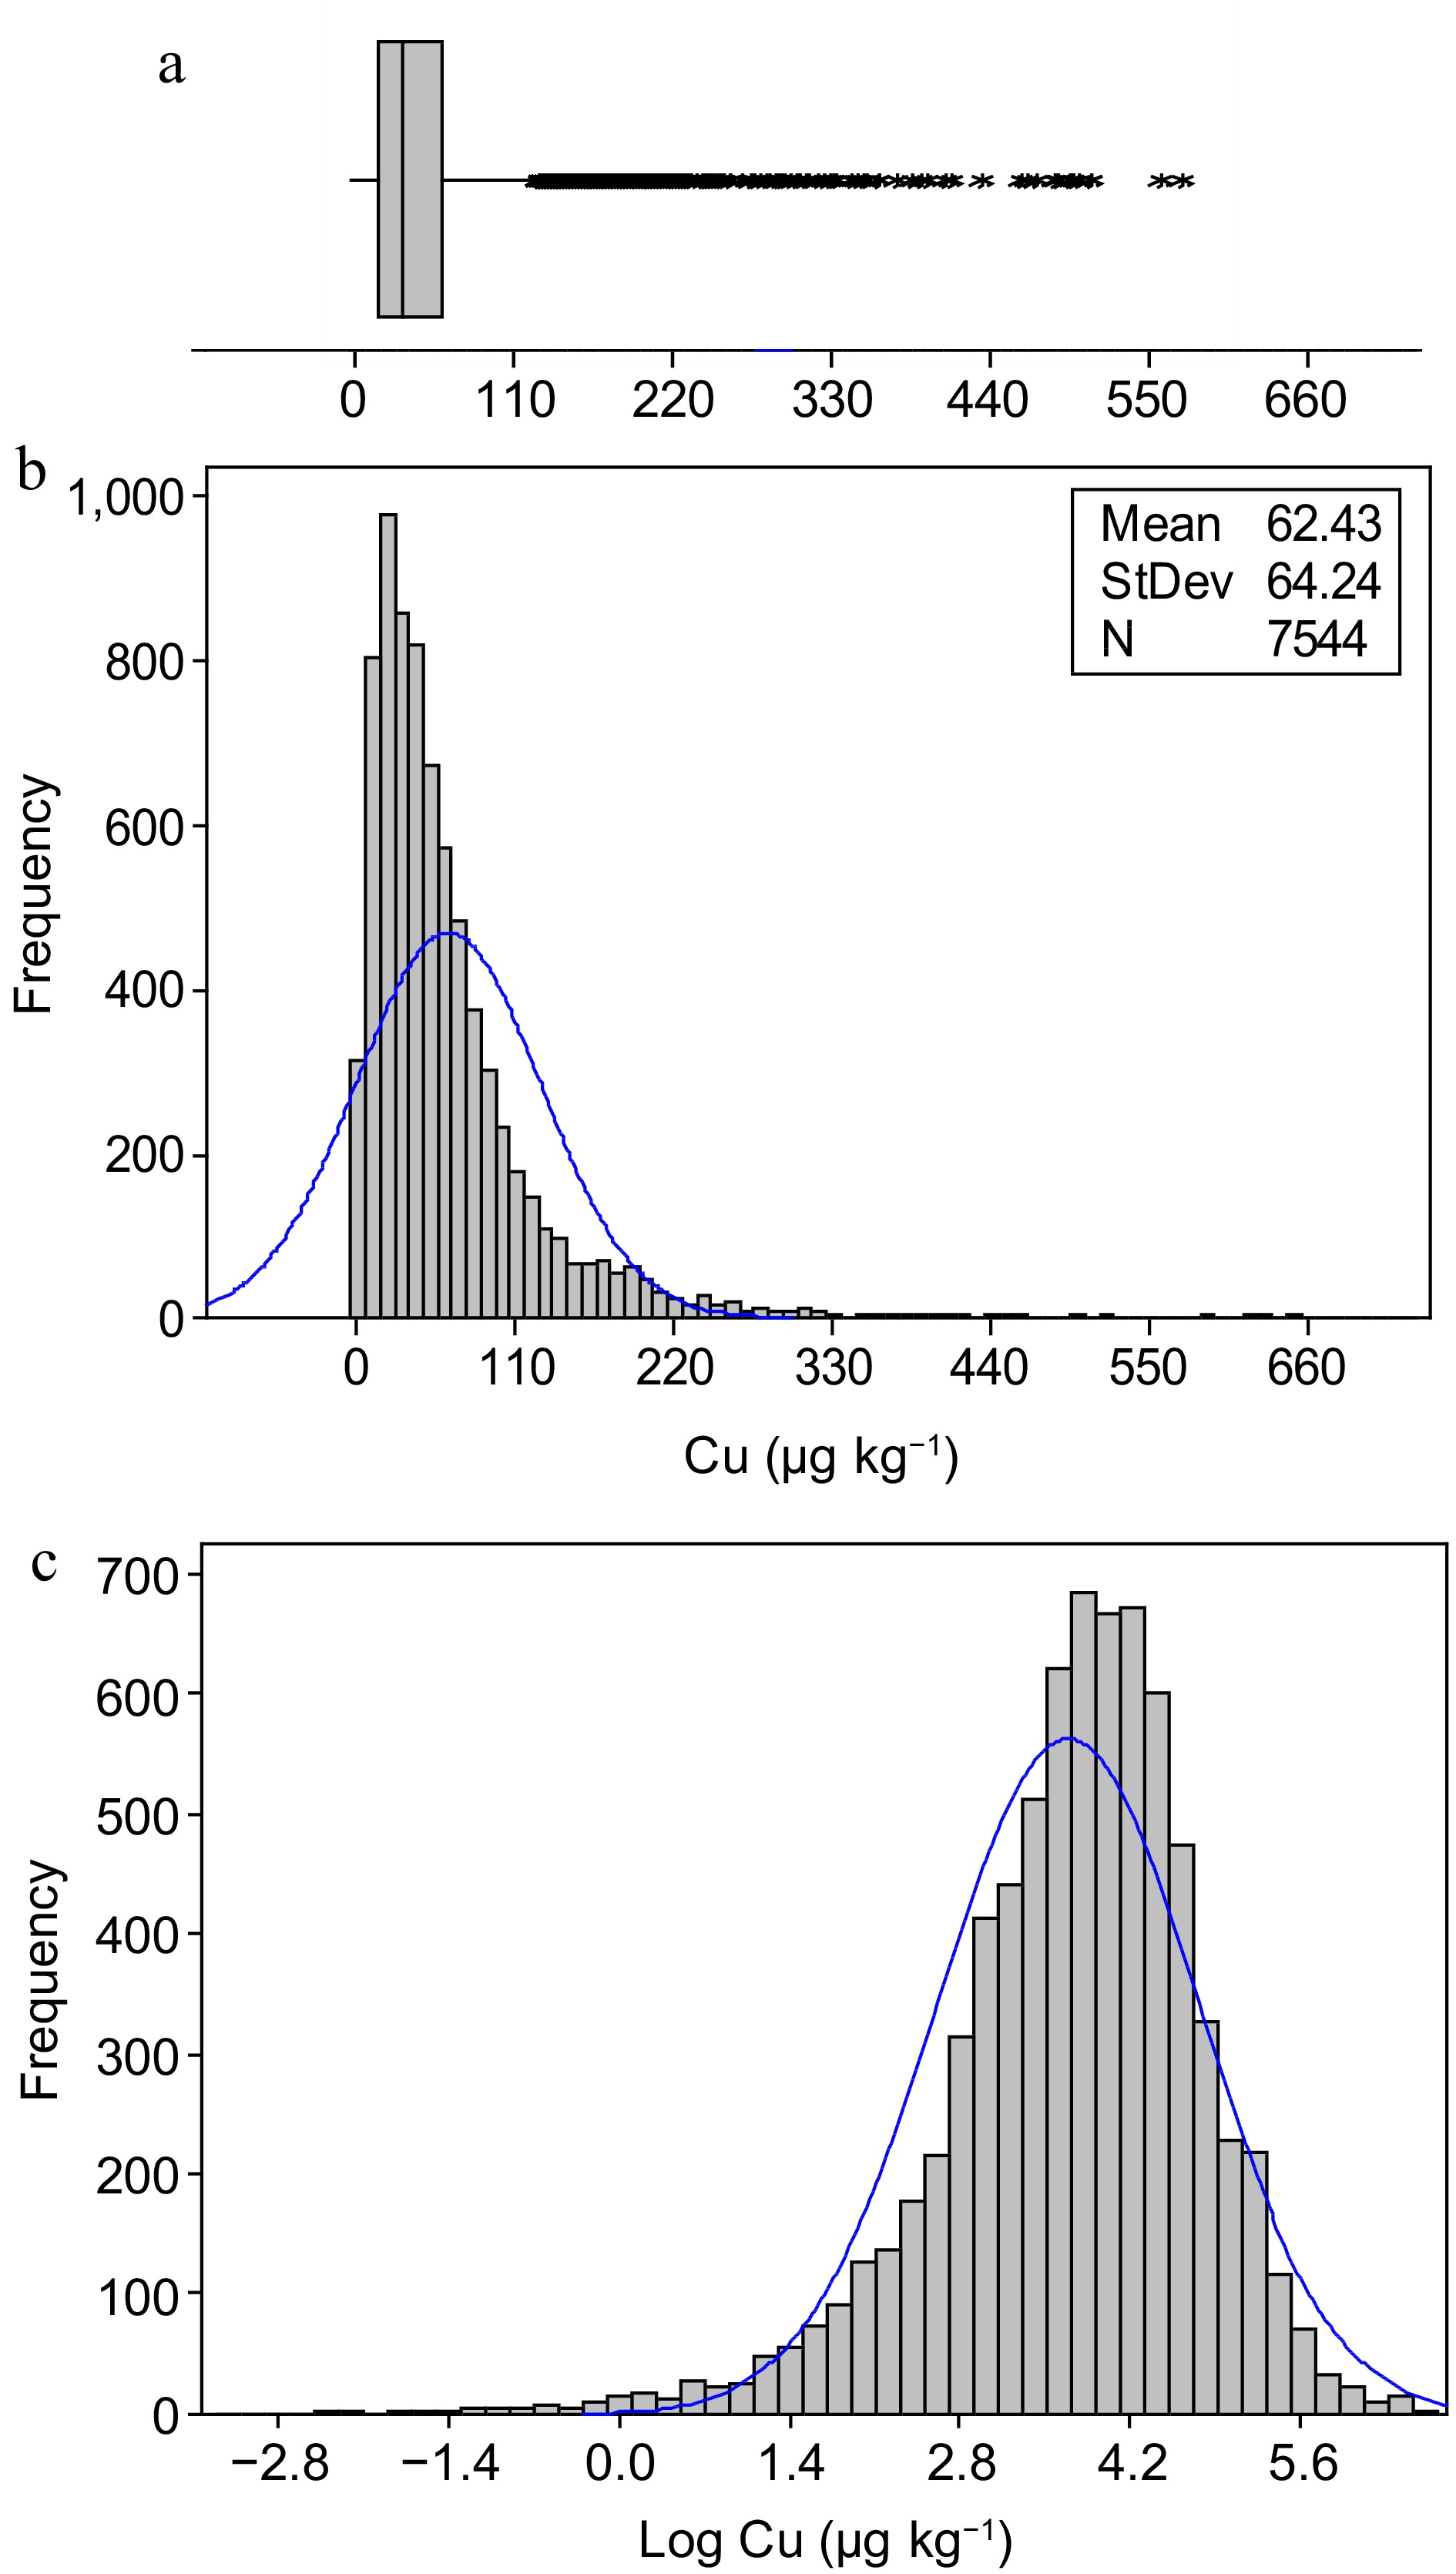
Figure 1.
(a) Box plot, (b) histogram, and (c) log transformed values of Cu concentration of paddy soil samples collected from Sri Lanka.
-
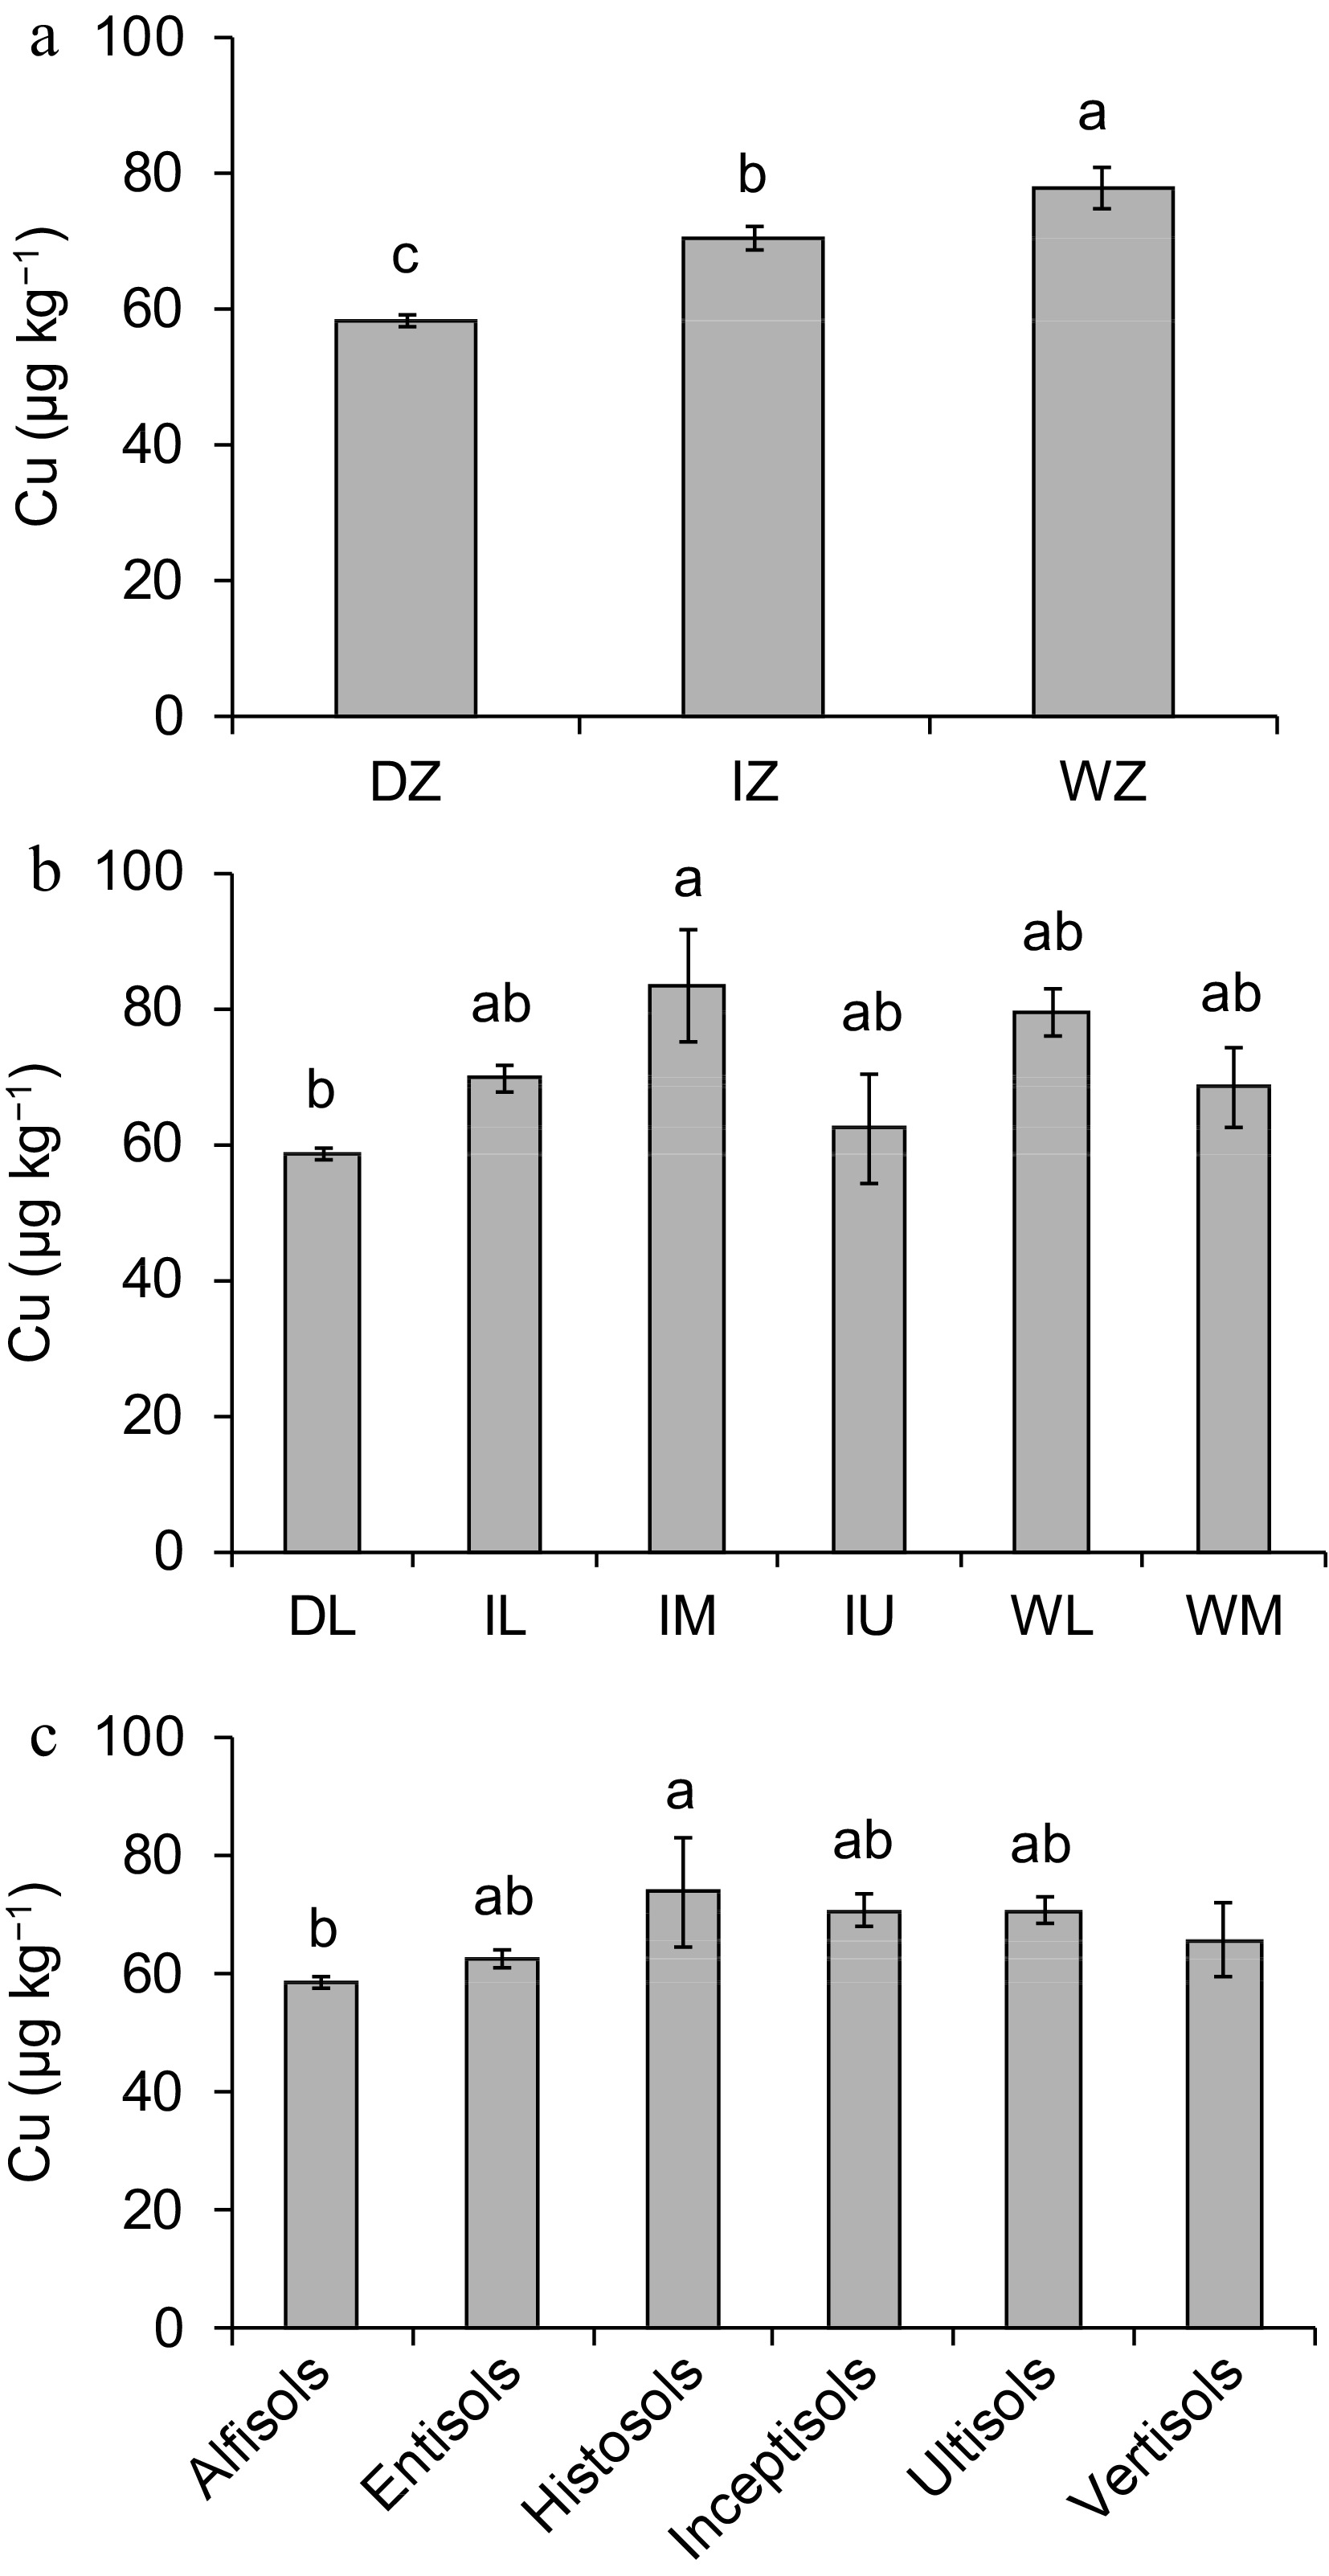
Figure 2.
(a) Concentration of copper (Cu) in the paddy fields used to cultivate rice in different climatic zones of Sri Lanka (Note: DZ, Dry Zone; IZ, Intermediate Zone; WZ, Wet Zone), (b) agro-climatic zones of Sri Lanka (Note: DL, Dry zone Low country; IL, Intermediate zone Low country; IM, Intermediate zone Mid country; IU, Intermediate zone Up country; WL, Wet zone Low country; WM, Wet zone Mid country), and (c) different soil orders of Sri Lanka (mean ± SE).
-
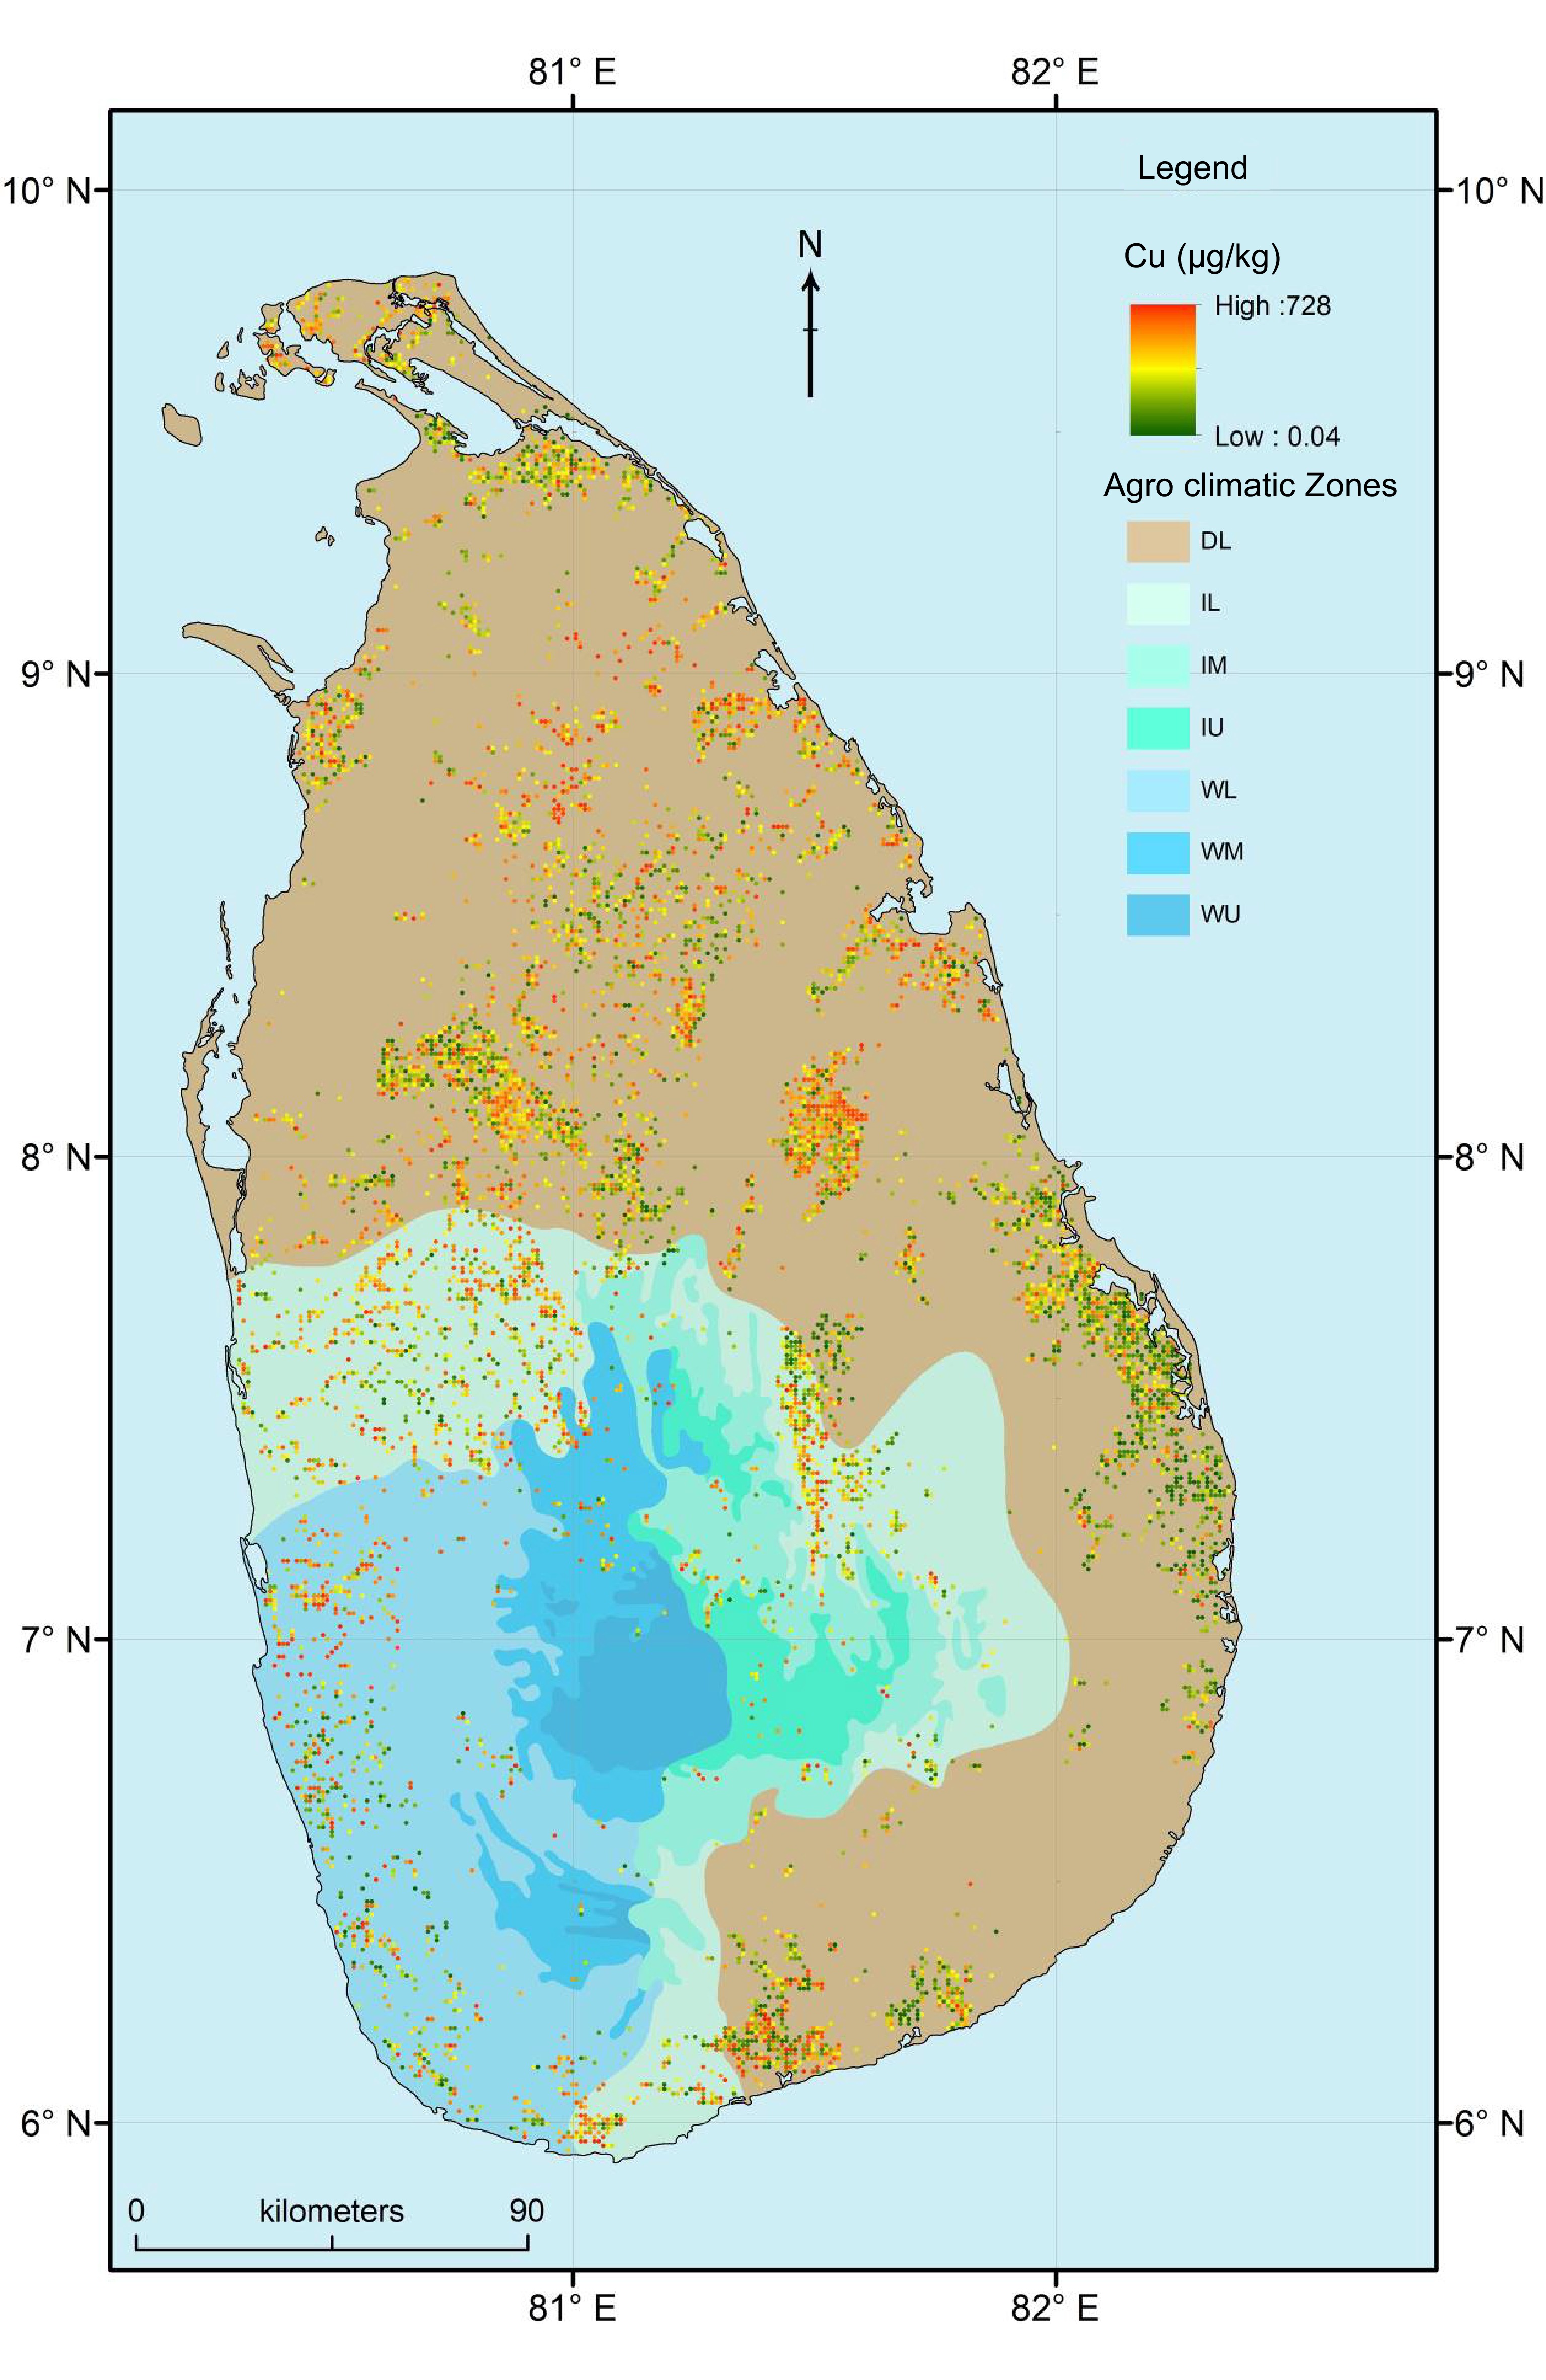
Figure 3.
Spatial distribution of copper (Cu) concentration in the paddy fields used to cultivate rice in different agro-climatic zones of Sri Lanka. Note: DL, Dry zone Low country; IL, Intermediate zone Low country; IM, Intermediate zone Mid country; IU, Intermediate zone Up country; WL, Wet zone Low country; WM, Wet zone Mid country.
-
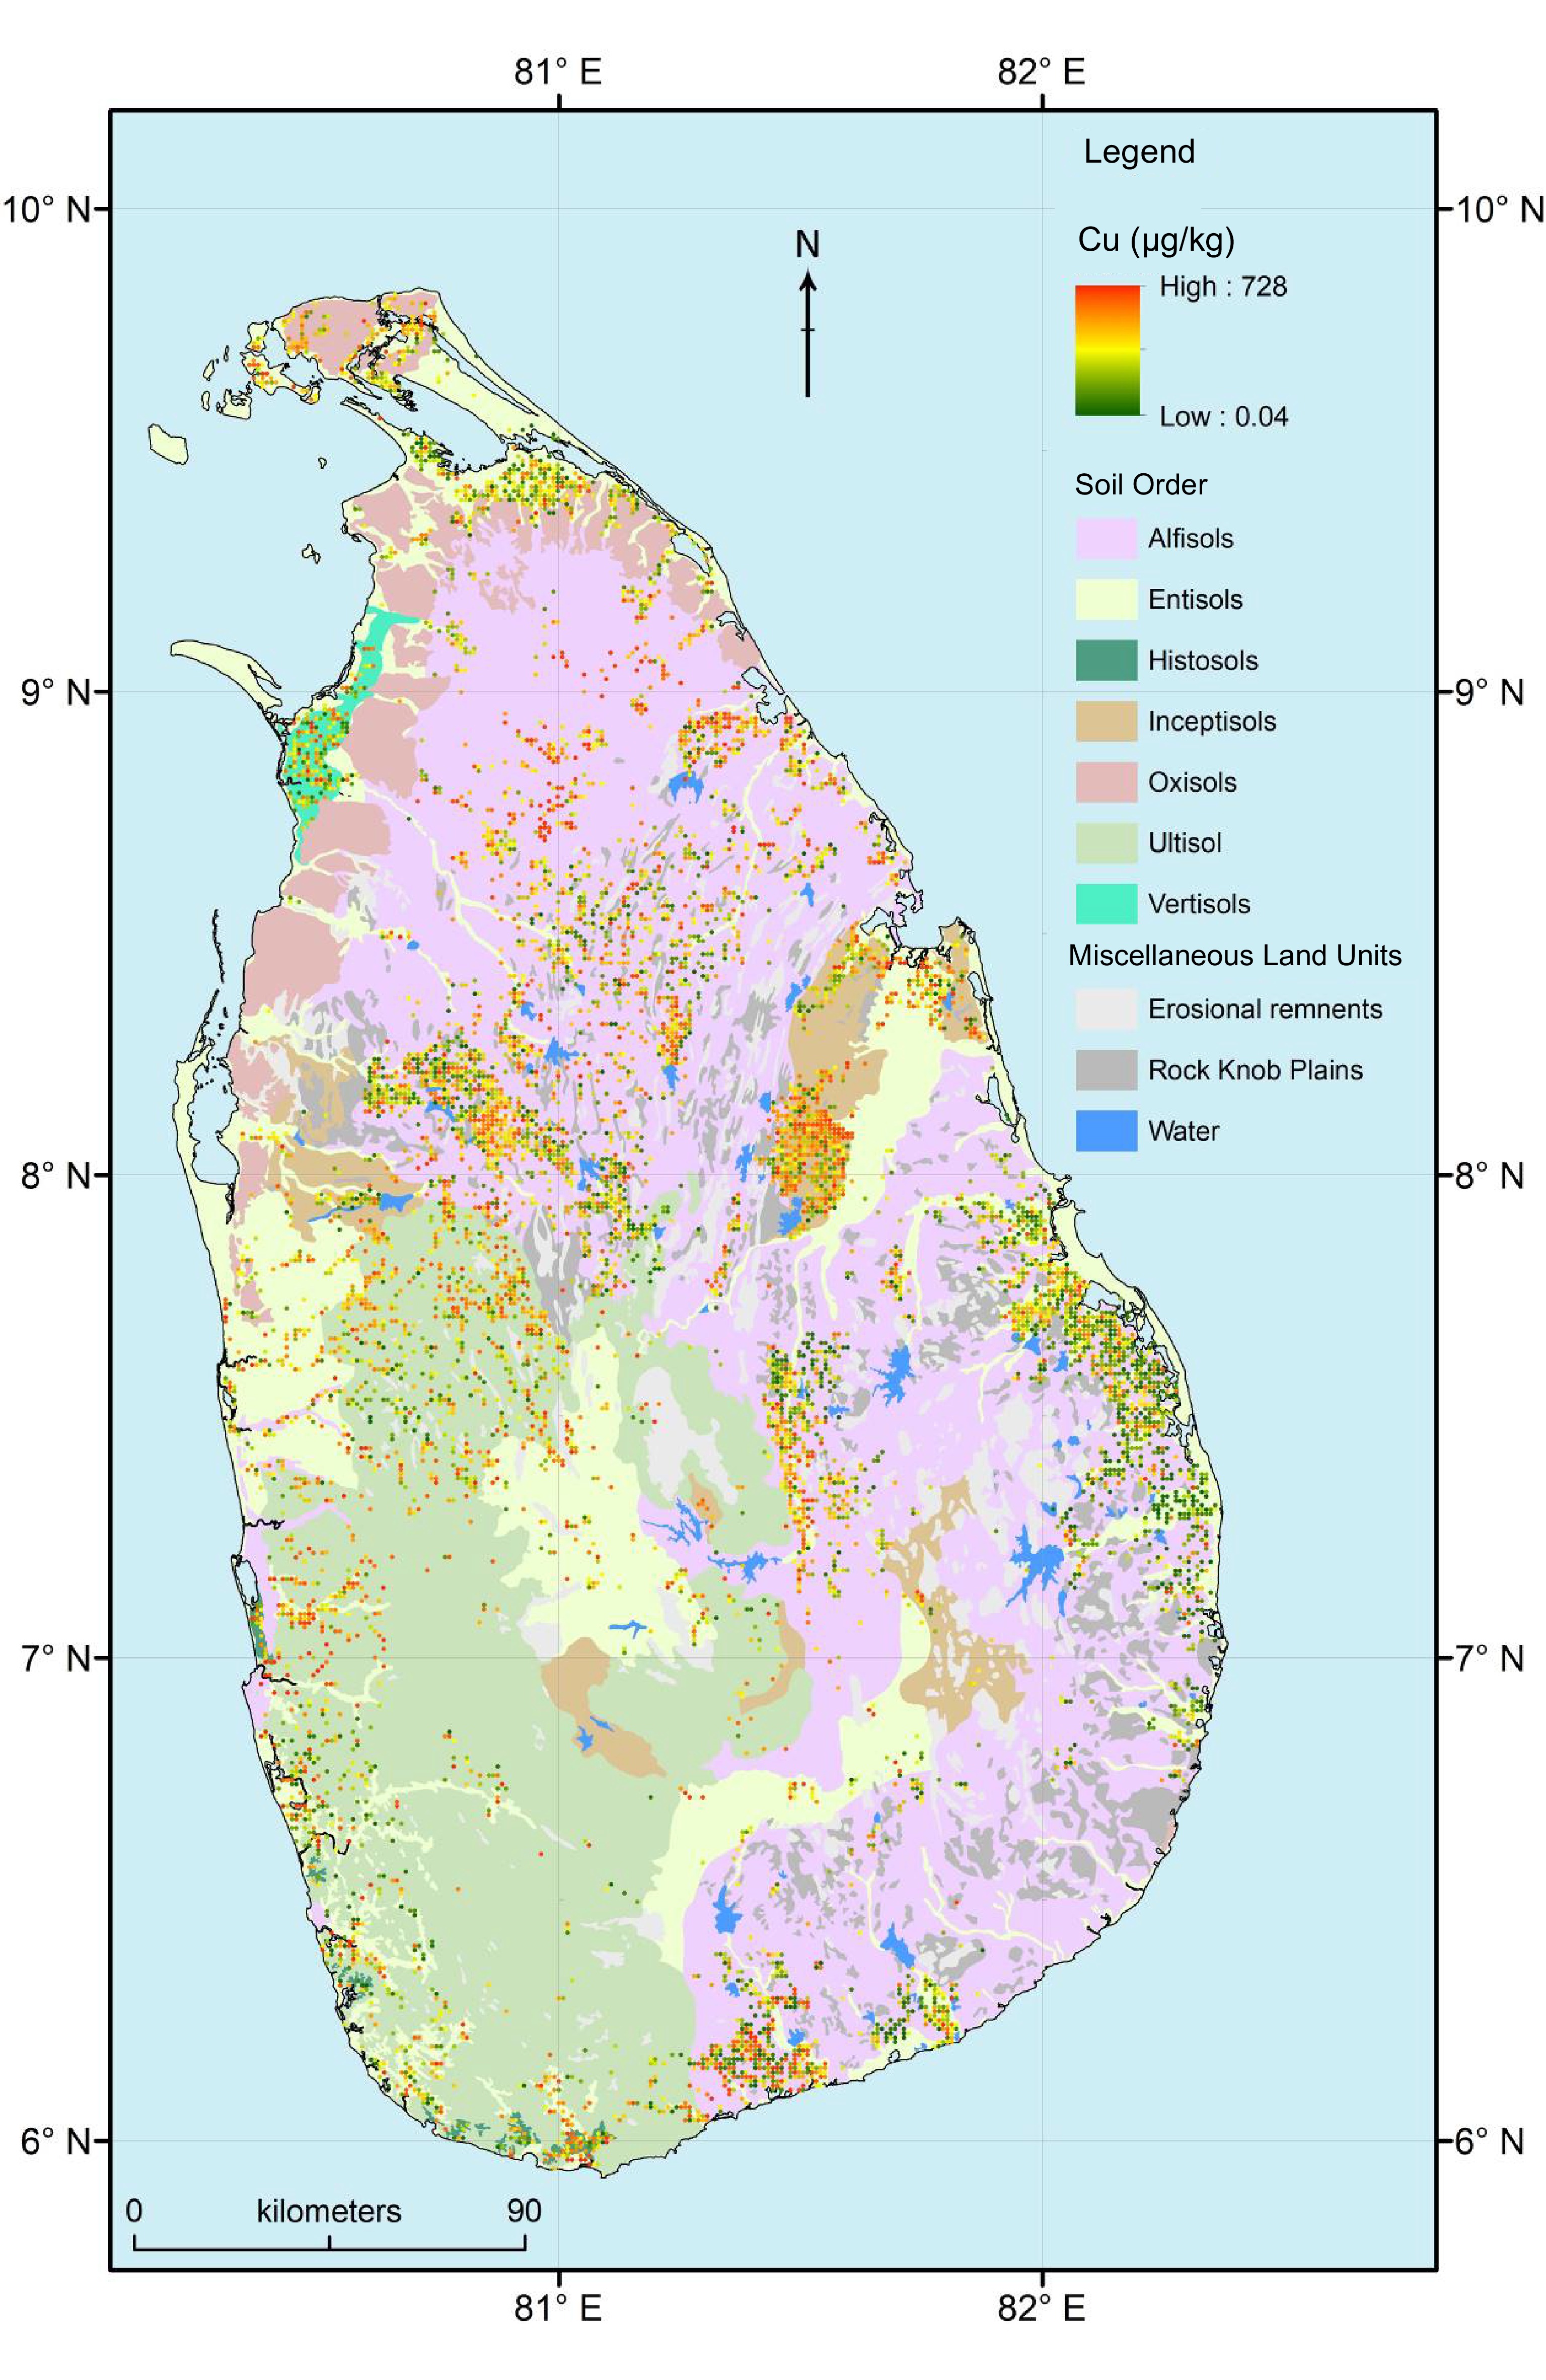
Figure 4.
Spatial distribution of copper (Cu) concentration in the paddy fields used to cultivate rice under different soil orders of Sri Lanka.
-
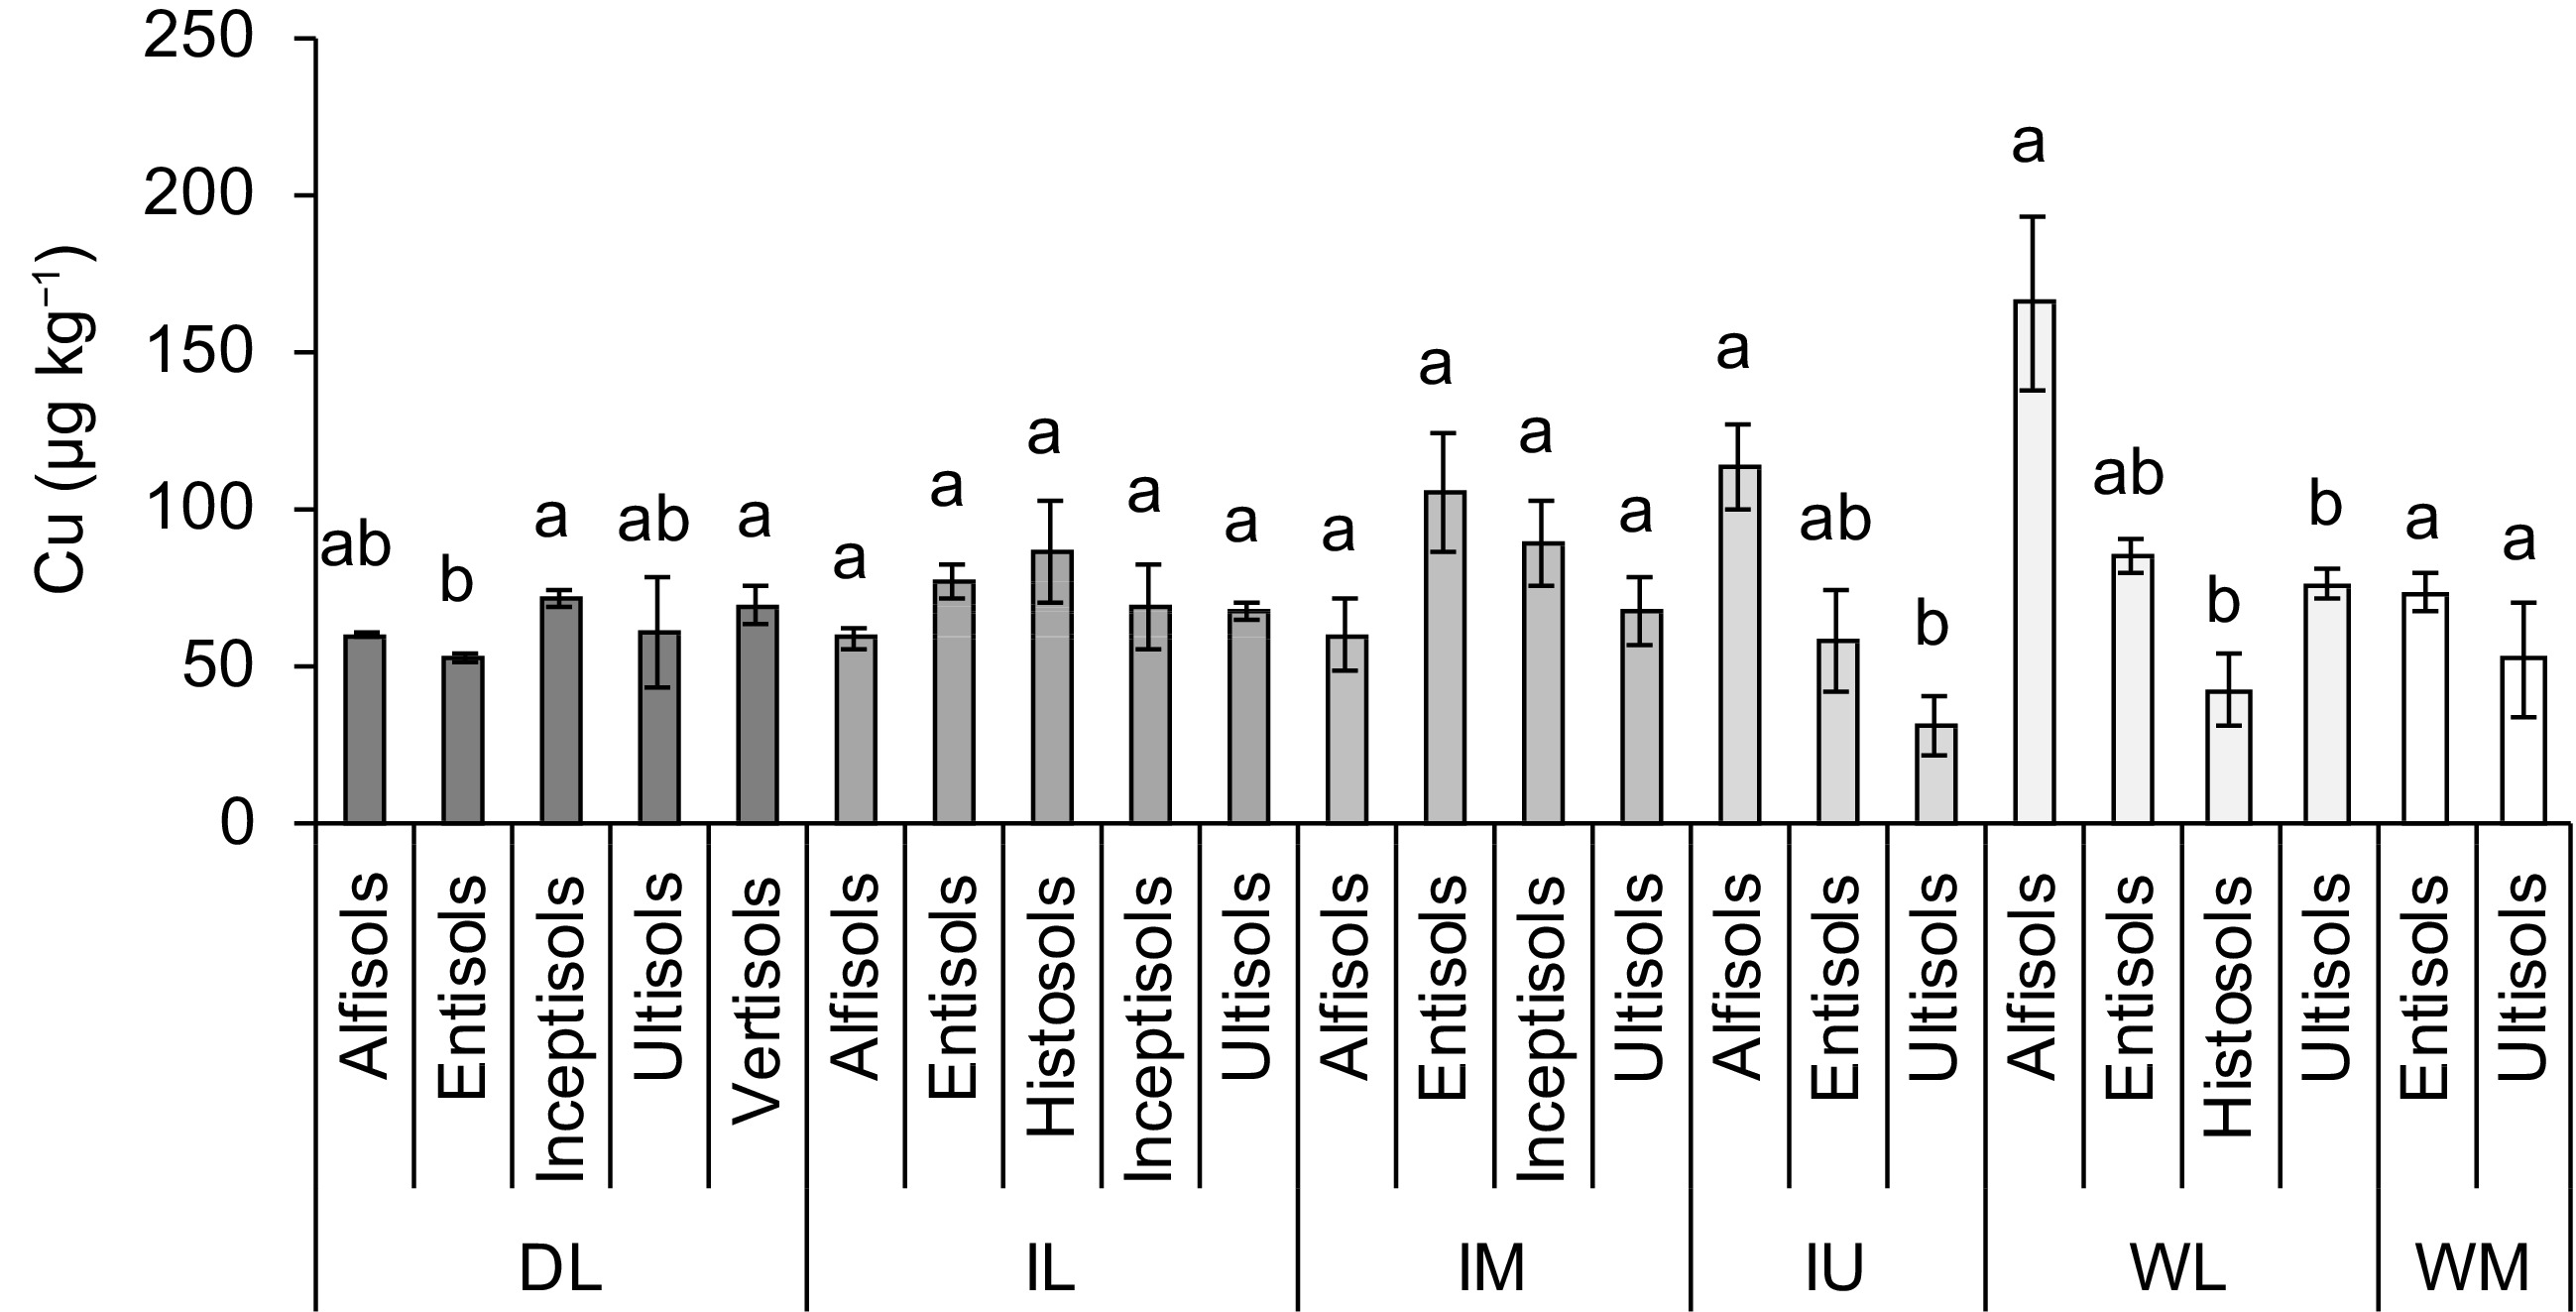
Figure 5.
Concentration of copper (Cu) in the paddy fields used to cultivate rice in different soil orders and agro-climatic zones (ACZ) of Sri Lanka (mean ± SE). Note: DL, Dry zone Low country; IL, Intermediate zone Low country; IM, Intermediate zone Mid country; IU,Intermediate zone Up country; WL,Wet zone Low country; WM, Wet zone Mid country. Different letters over the bars, within each ACZ, indicate statistically significant difference at p < 0.05.
-
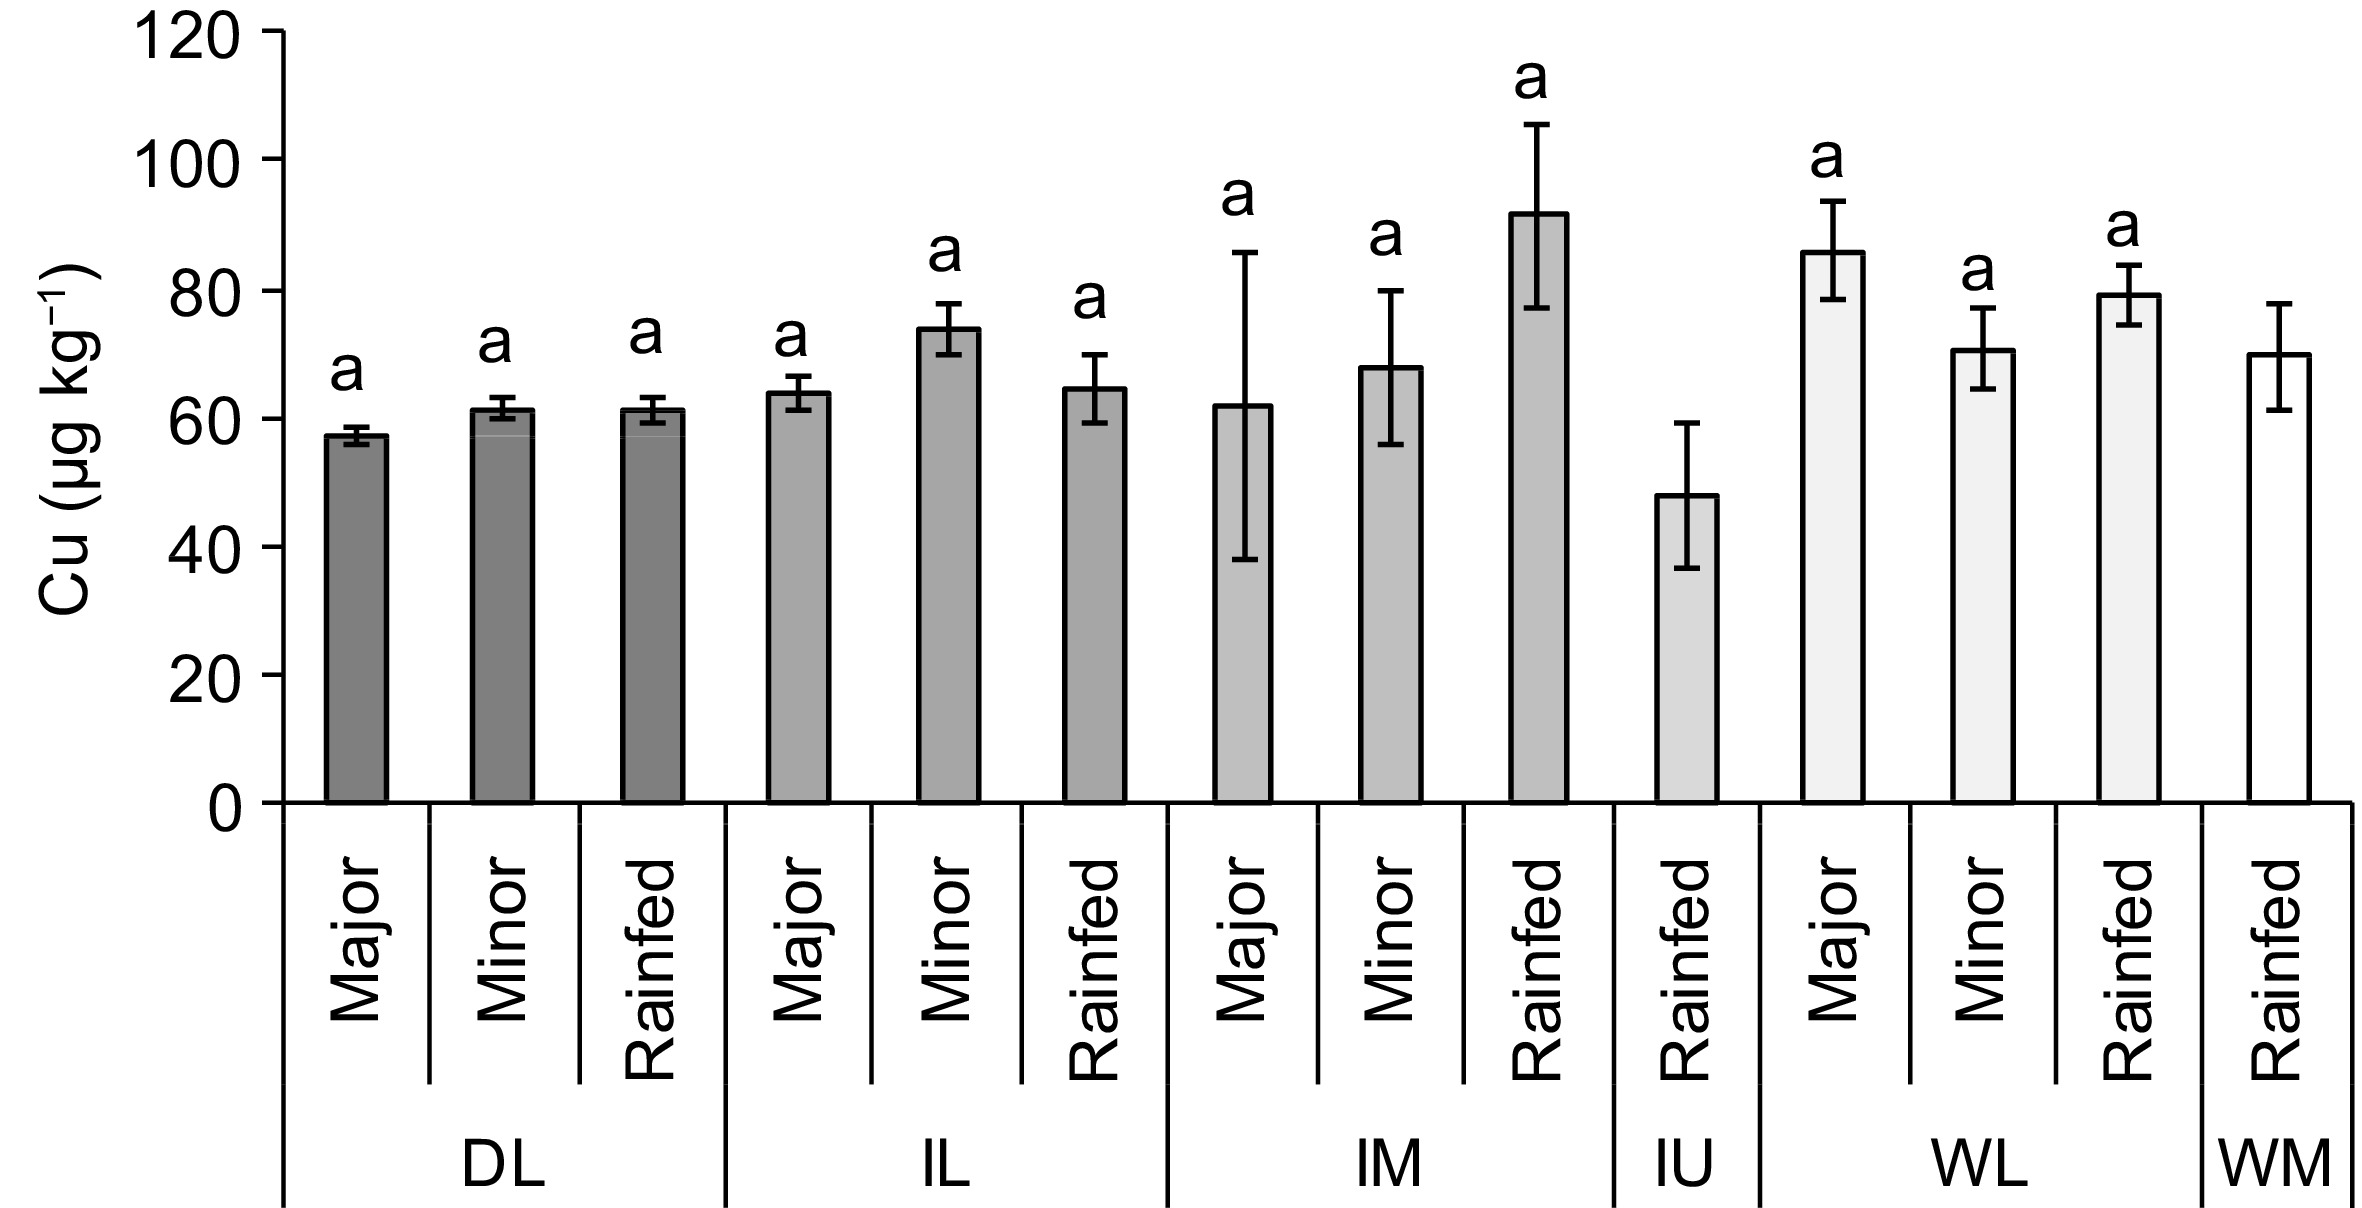
Figure 6.
Concentration of copper (Cu) in the paddy fields used to cultivate rice using different water sources and agro-climatic zones (ACZ) of Sri Lanka (mean ± SE). Note: DL, Dry zone Low country; IL, Intermediate zone Low country; IM, Intermediate zone Mid country; IU, Intermediate zone Up country; WL, Wet zone Low country; WM, Wet zone Mid country. Different letters over the bars, within each ACZ, indicate statistically significant difference at p < 0.05.
-
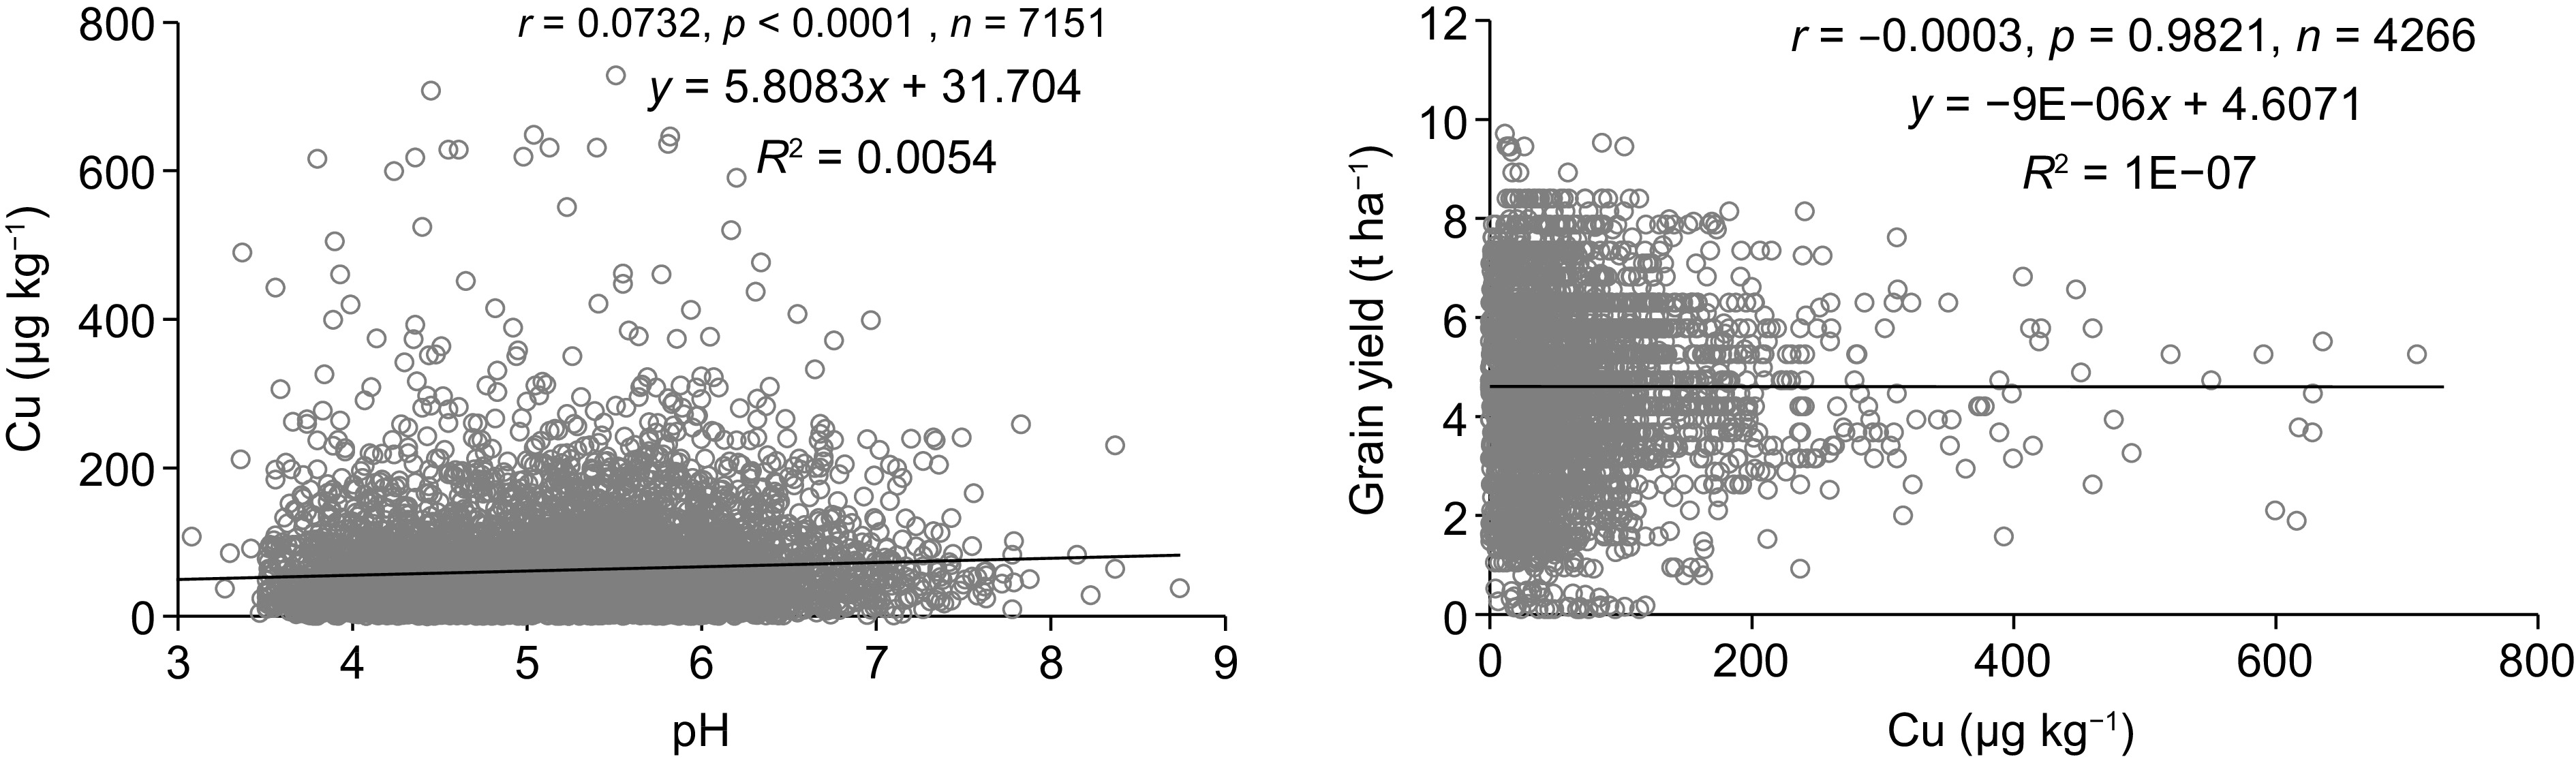
Figure 7.
Relationships of copper (Cu) concentration with pH of lowland paddy cultivated soils and grain yield.
Figures
(7)
Tables
(0)