-
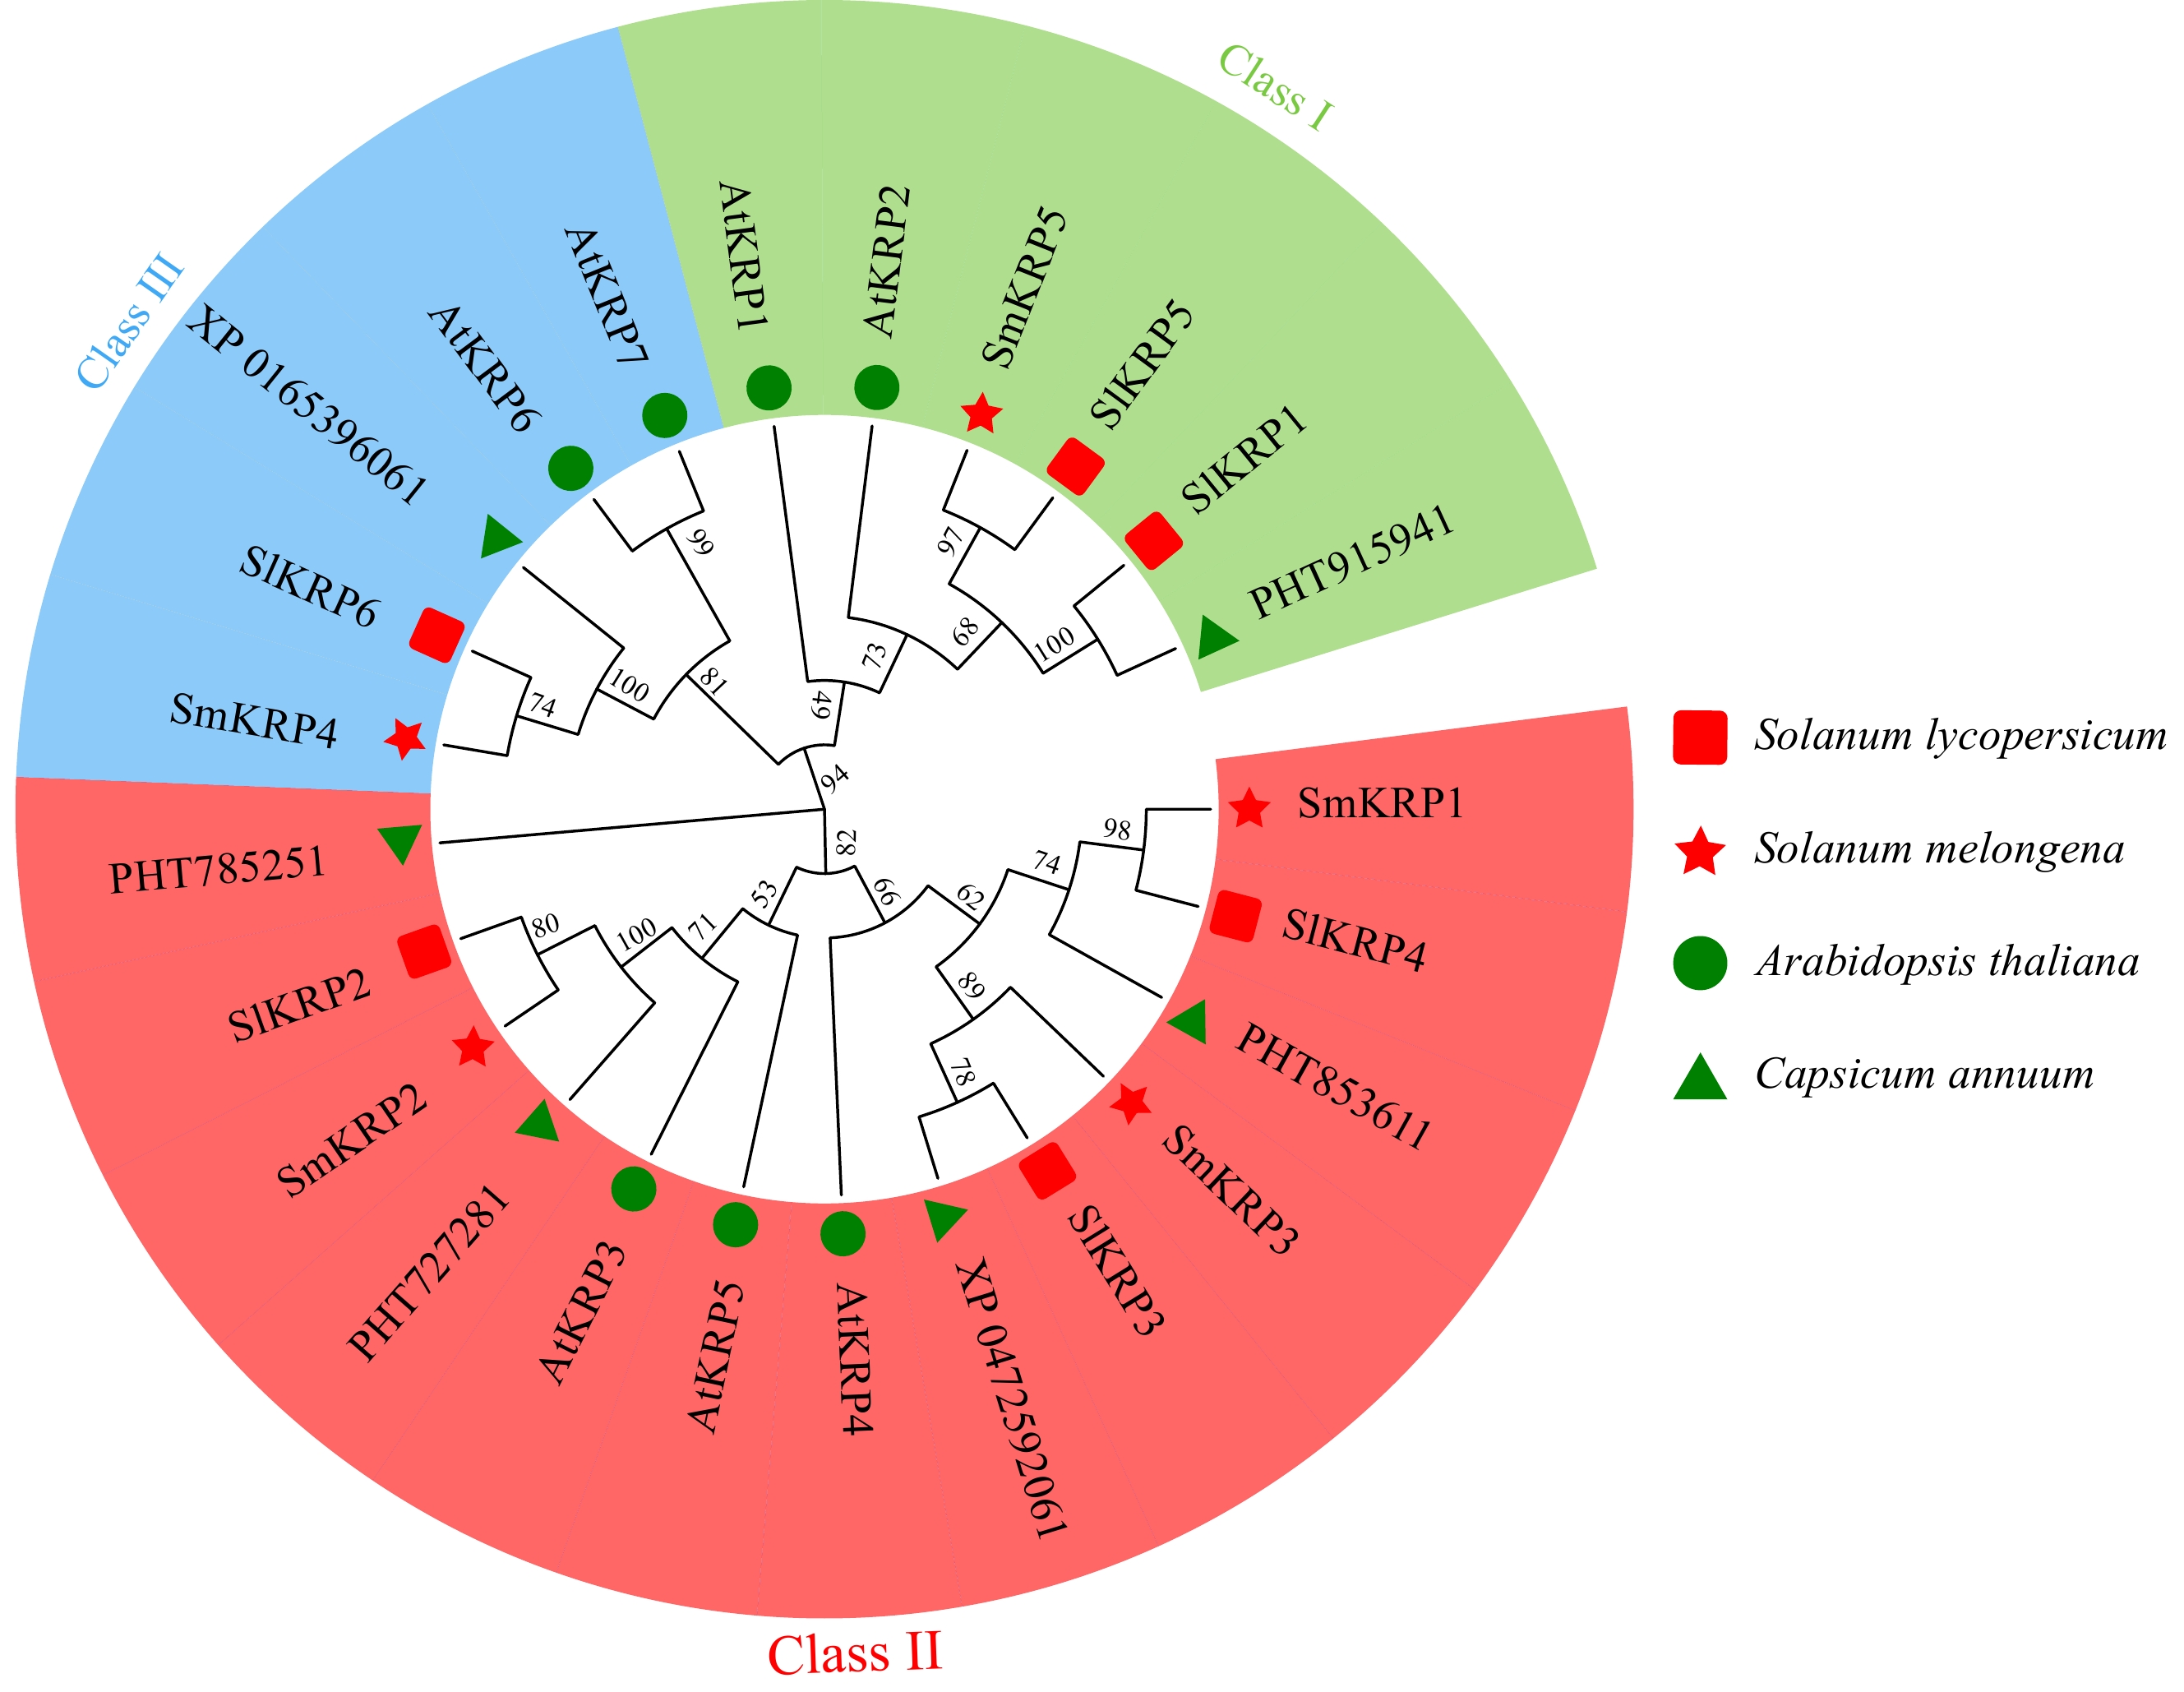
Figure 1.
Phylogenetic relationship analysis of SmKRPs with its homologs from Arabidopsis thaliana, Solanum lycopersicum, and Capsicum annuum by constructing an evolutionary tree. The KRP proteins were distributed into three classes, which is distinguished by different colors.
-
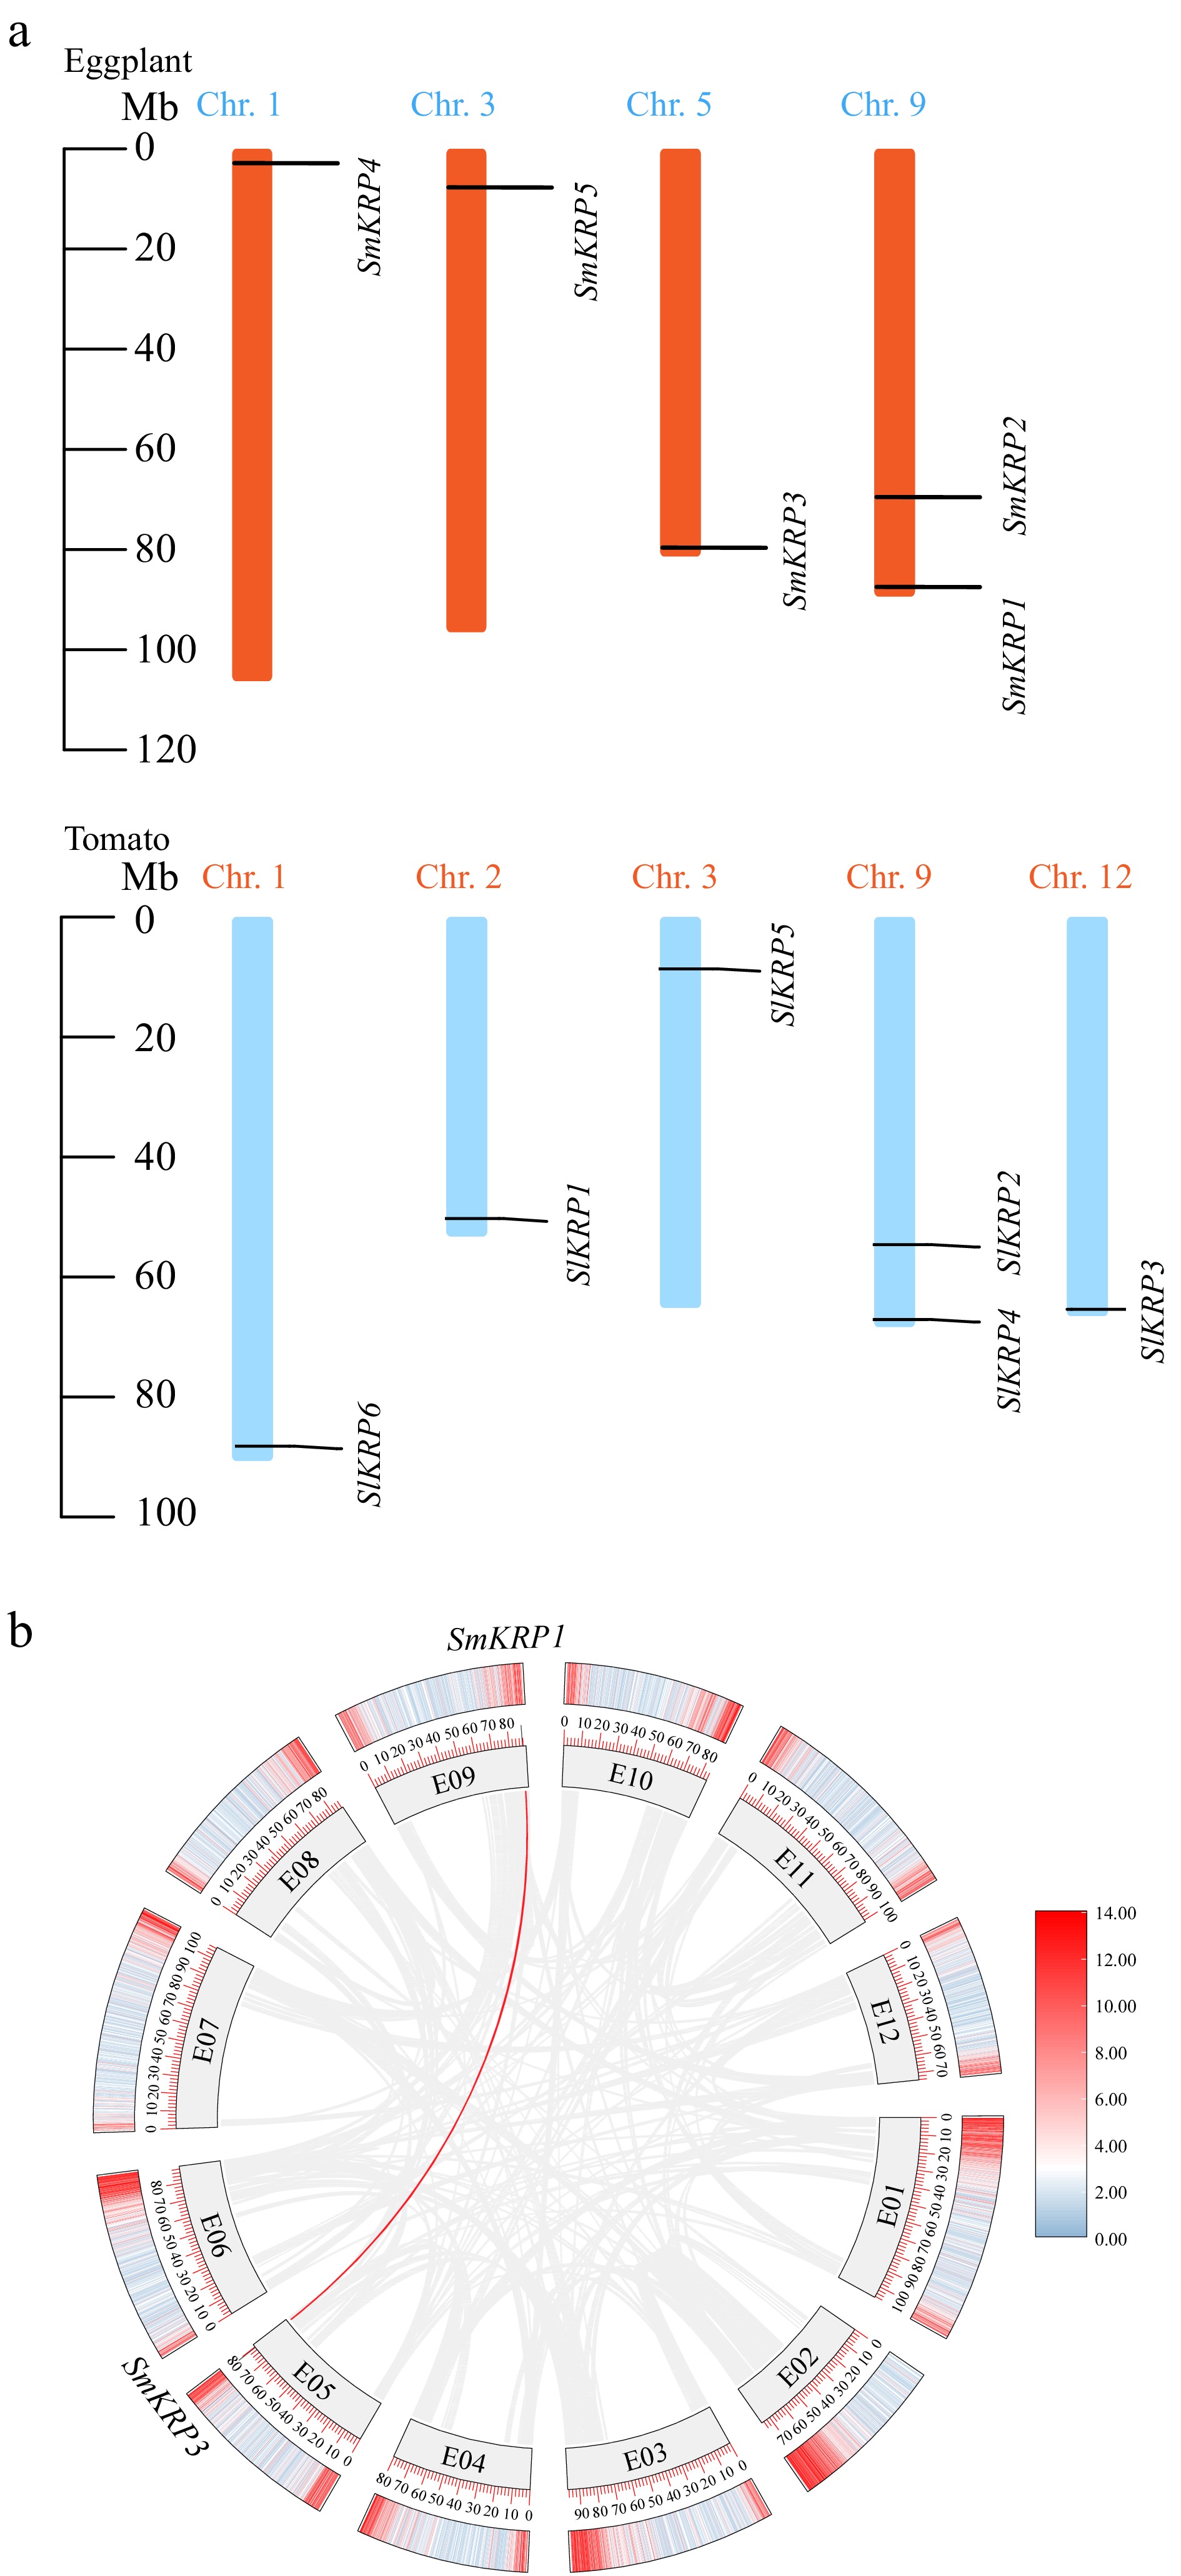
Figure 2.
(a) Chromosomal assignment of KRP members in eggplant and tomato, (b) the duplication of SmKRPs on eggplant chromosomes. The Chr. 1, Chr. 3, Chr. 5, Chr. 9, and Chr. 12 in (a) as well as E01~E12 in (b) represent the chromosome number.
-
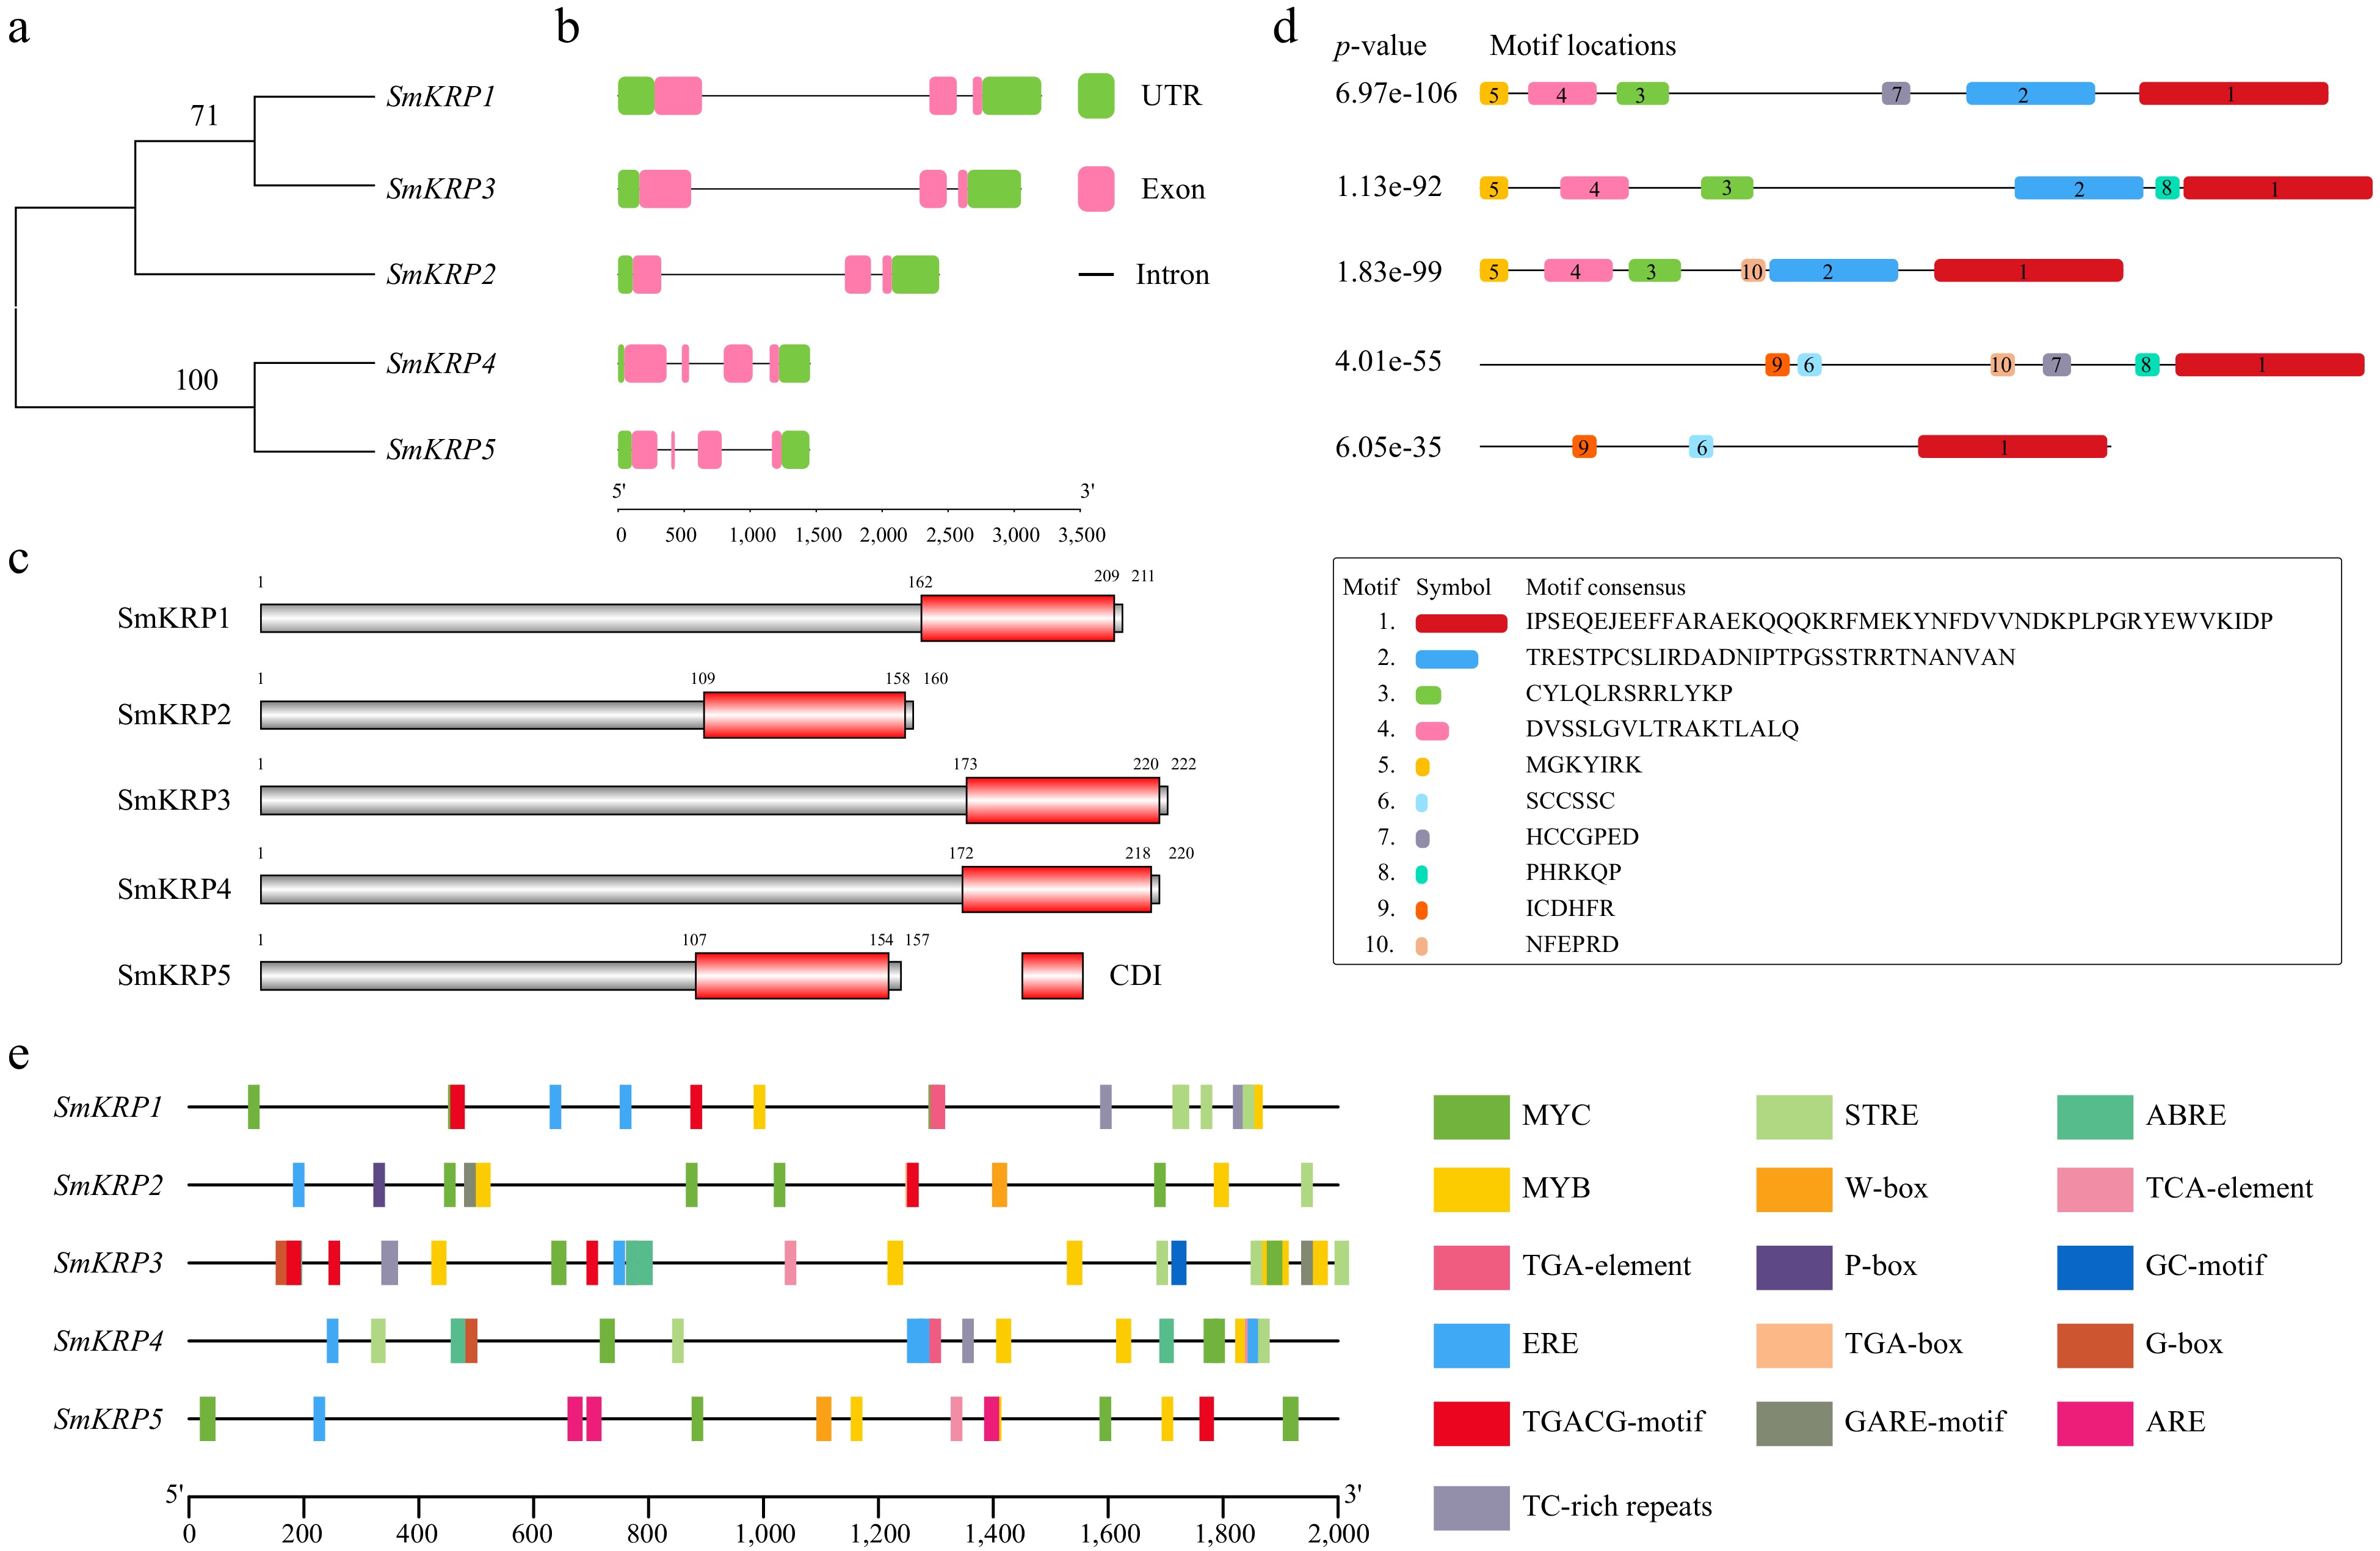
Figure 3.
Analysis of gene structure, conserved domains and motifs of SmKRPs. (a) Phylogenetic relationship analysis among SmKRPs. (b) Distribution of exon, intron, and UTR of SmKRPs. Green box, pink box and black line represent UTR, exon, and intron, respectively. (c) Conserved domains analysis of SmKRP proteins. The red box represents conserved domain CDI. (d) Distribution of conserved motifs within SmKRP proteins. The 1–10 motifs were identified by searching MEME website, and were distinguished by different color boxes. The motif 1 is CDI domain. (e) Analysis of cis-elements within the promoters of SmKRPs. The cis-elements were predicted by searching the PlantCARE website, and were differentiated by different colored boxes.
-
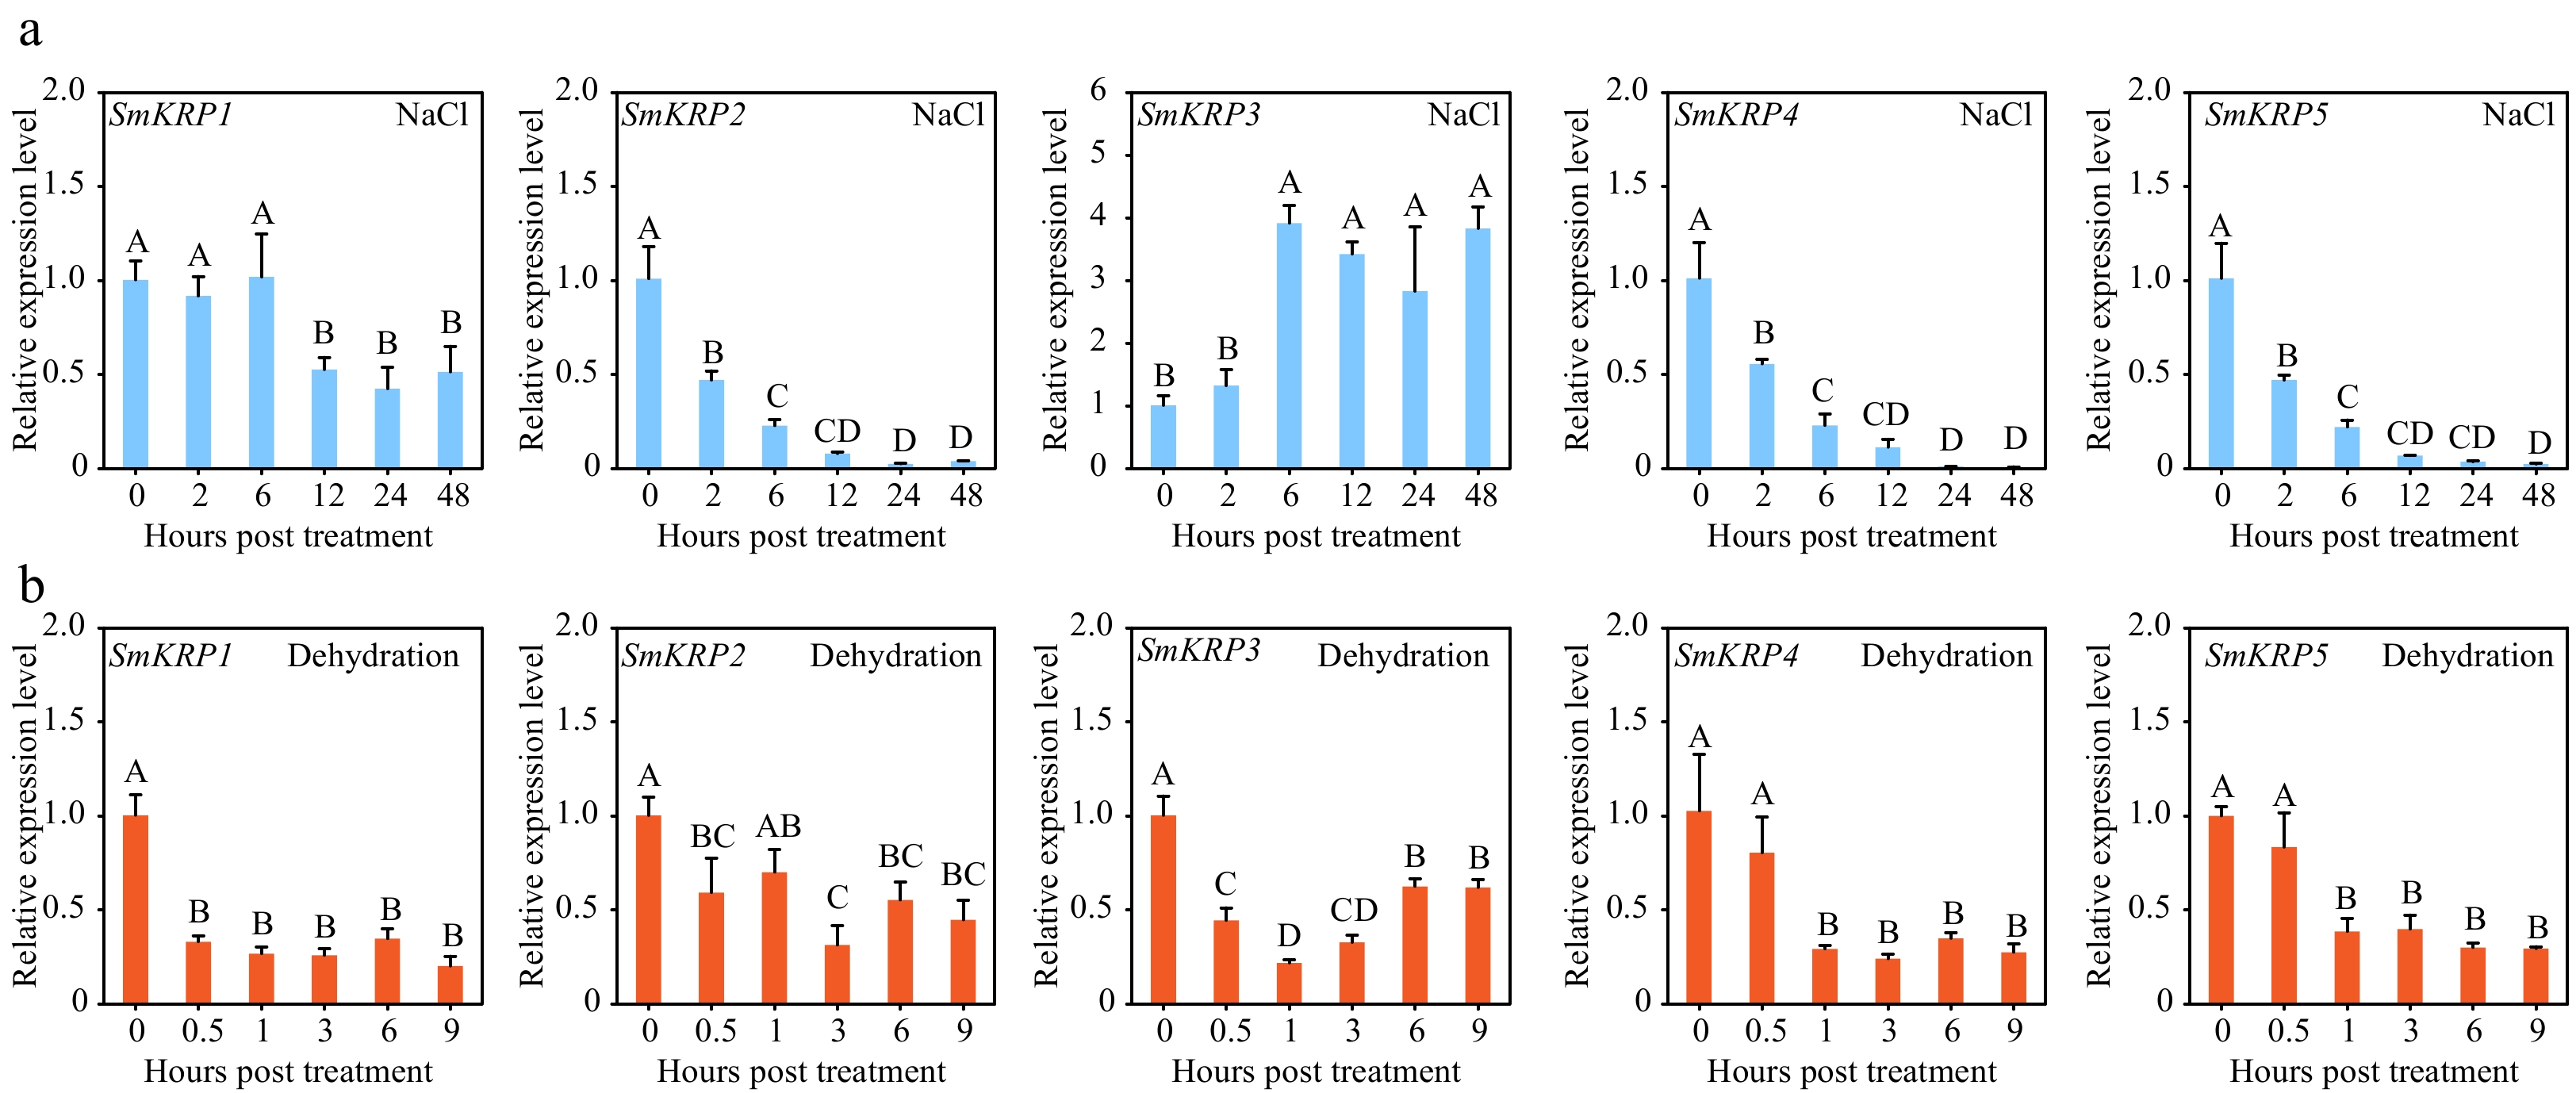
Figure 4.
Expression profile analysis of SmKRPs. Expression levels of SmKRPs were detected in eggplant roots treated with (a) NaCl or (b) dehydration stress by RT-qPCR assay. Three biological repeats were applied to calculate the mean ± standard deviation. Different upper letters represent highly significant differences, as performed by Fisher's protected LSD test (p < 0.01).
-
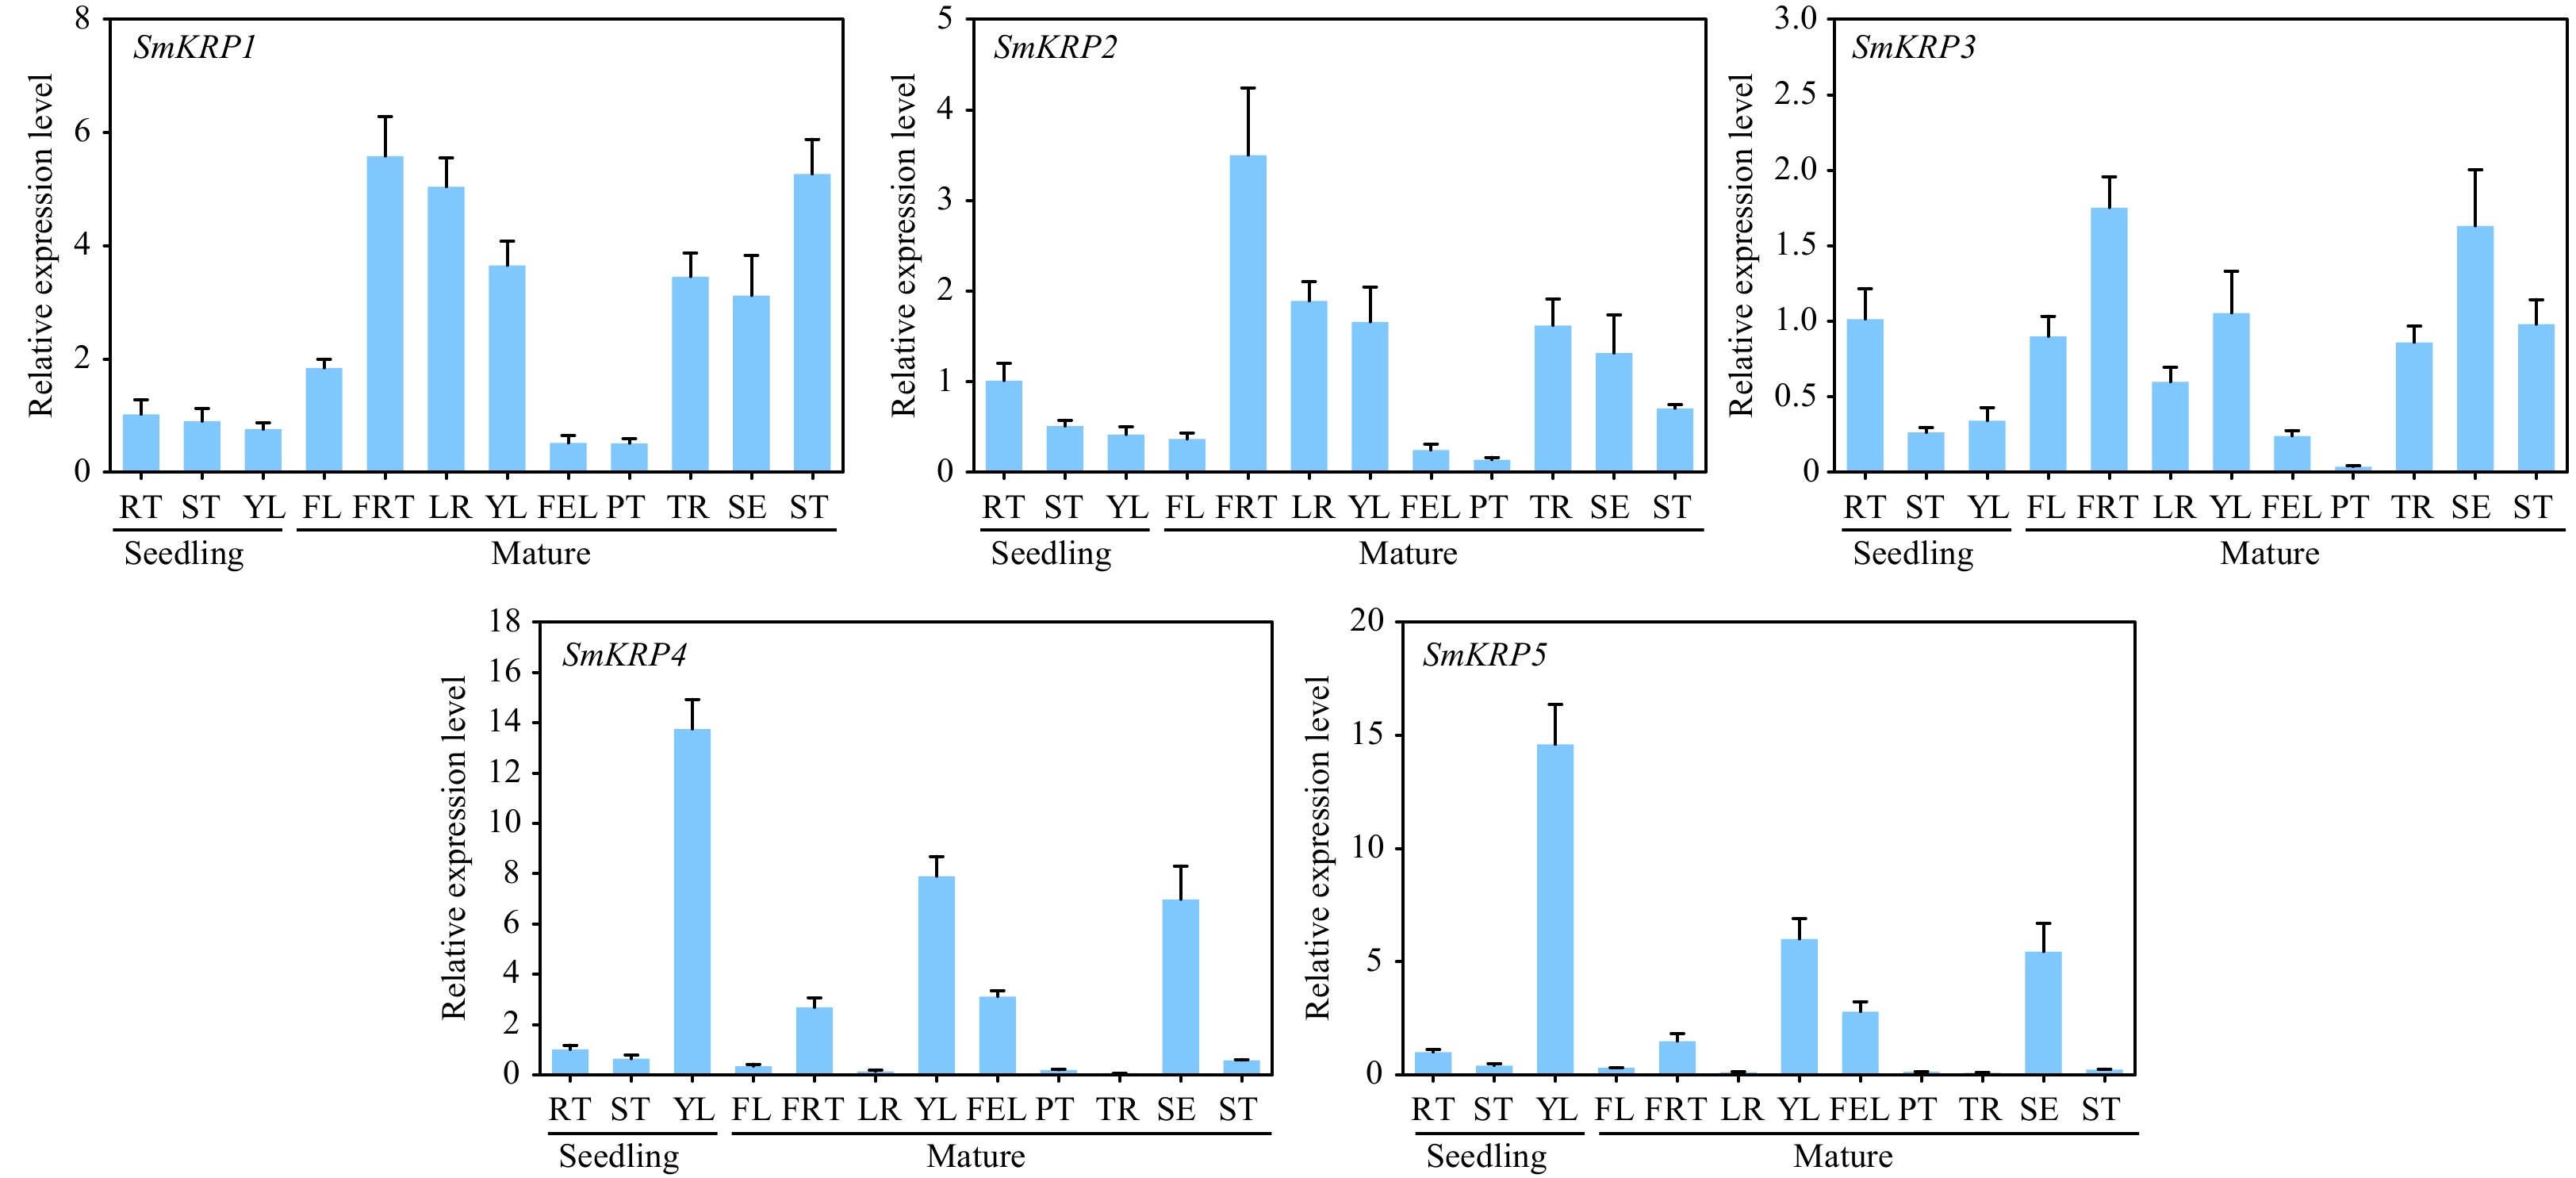
Figure 5.
Analysis of tissue specific expression of SmKRPs. The relative expression levels of SmKRPs in the different tissues from seedlings including root (RT), stem (ST), and young leaf (YL) and from mature plants including flower (FL), fruit (FRT), lateral root (LR), YL, full expand leaf (FEL), petiole (PT), taproot (TR), sepal (SE), and ST by RT-qPCR assay. Three biological repeats were applied to calculate the mean ± standard deviation. Different uppercase letters represent highly significant differences, as performed by Student's t-test (p < 0.01).
-
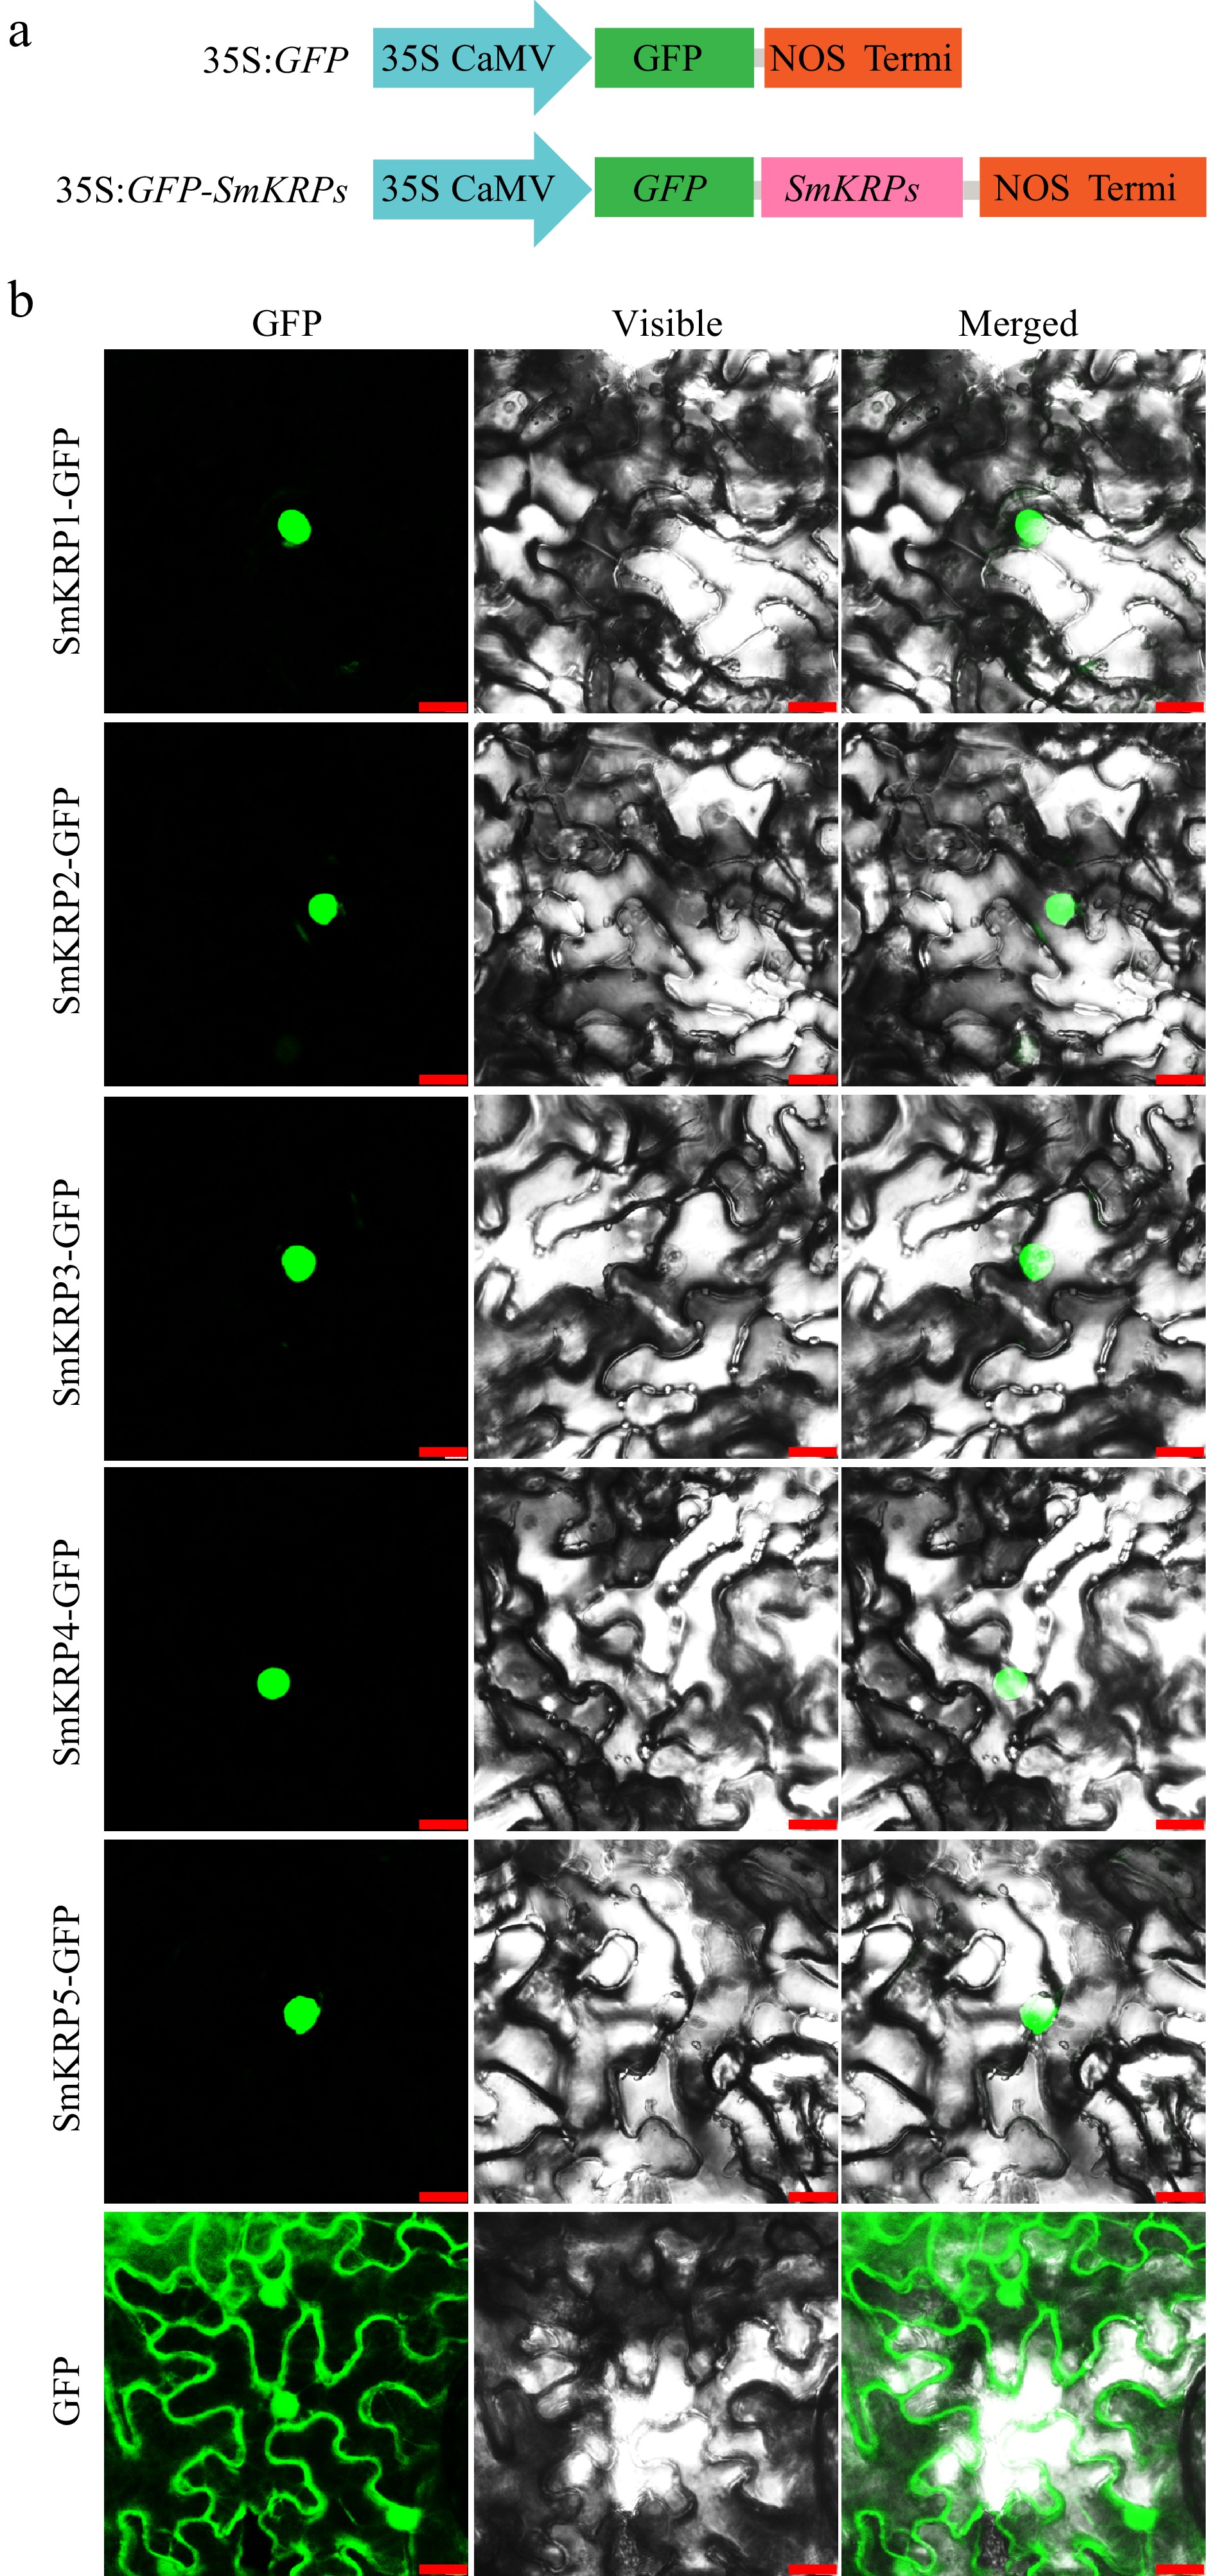
Figure 6.
Subcellular localization of SmKRP proteins. (a) Diagrammatic drawing of recombinant vector structures of 35S:GFP-SmKRPs or empty vector 35S:GFP. (b) Subcellular localization of SmKRP proteins in the epidermic cells of Nicotiana benthamiana leaves. Bar = 25 μm.
-
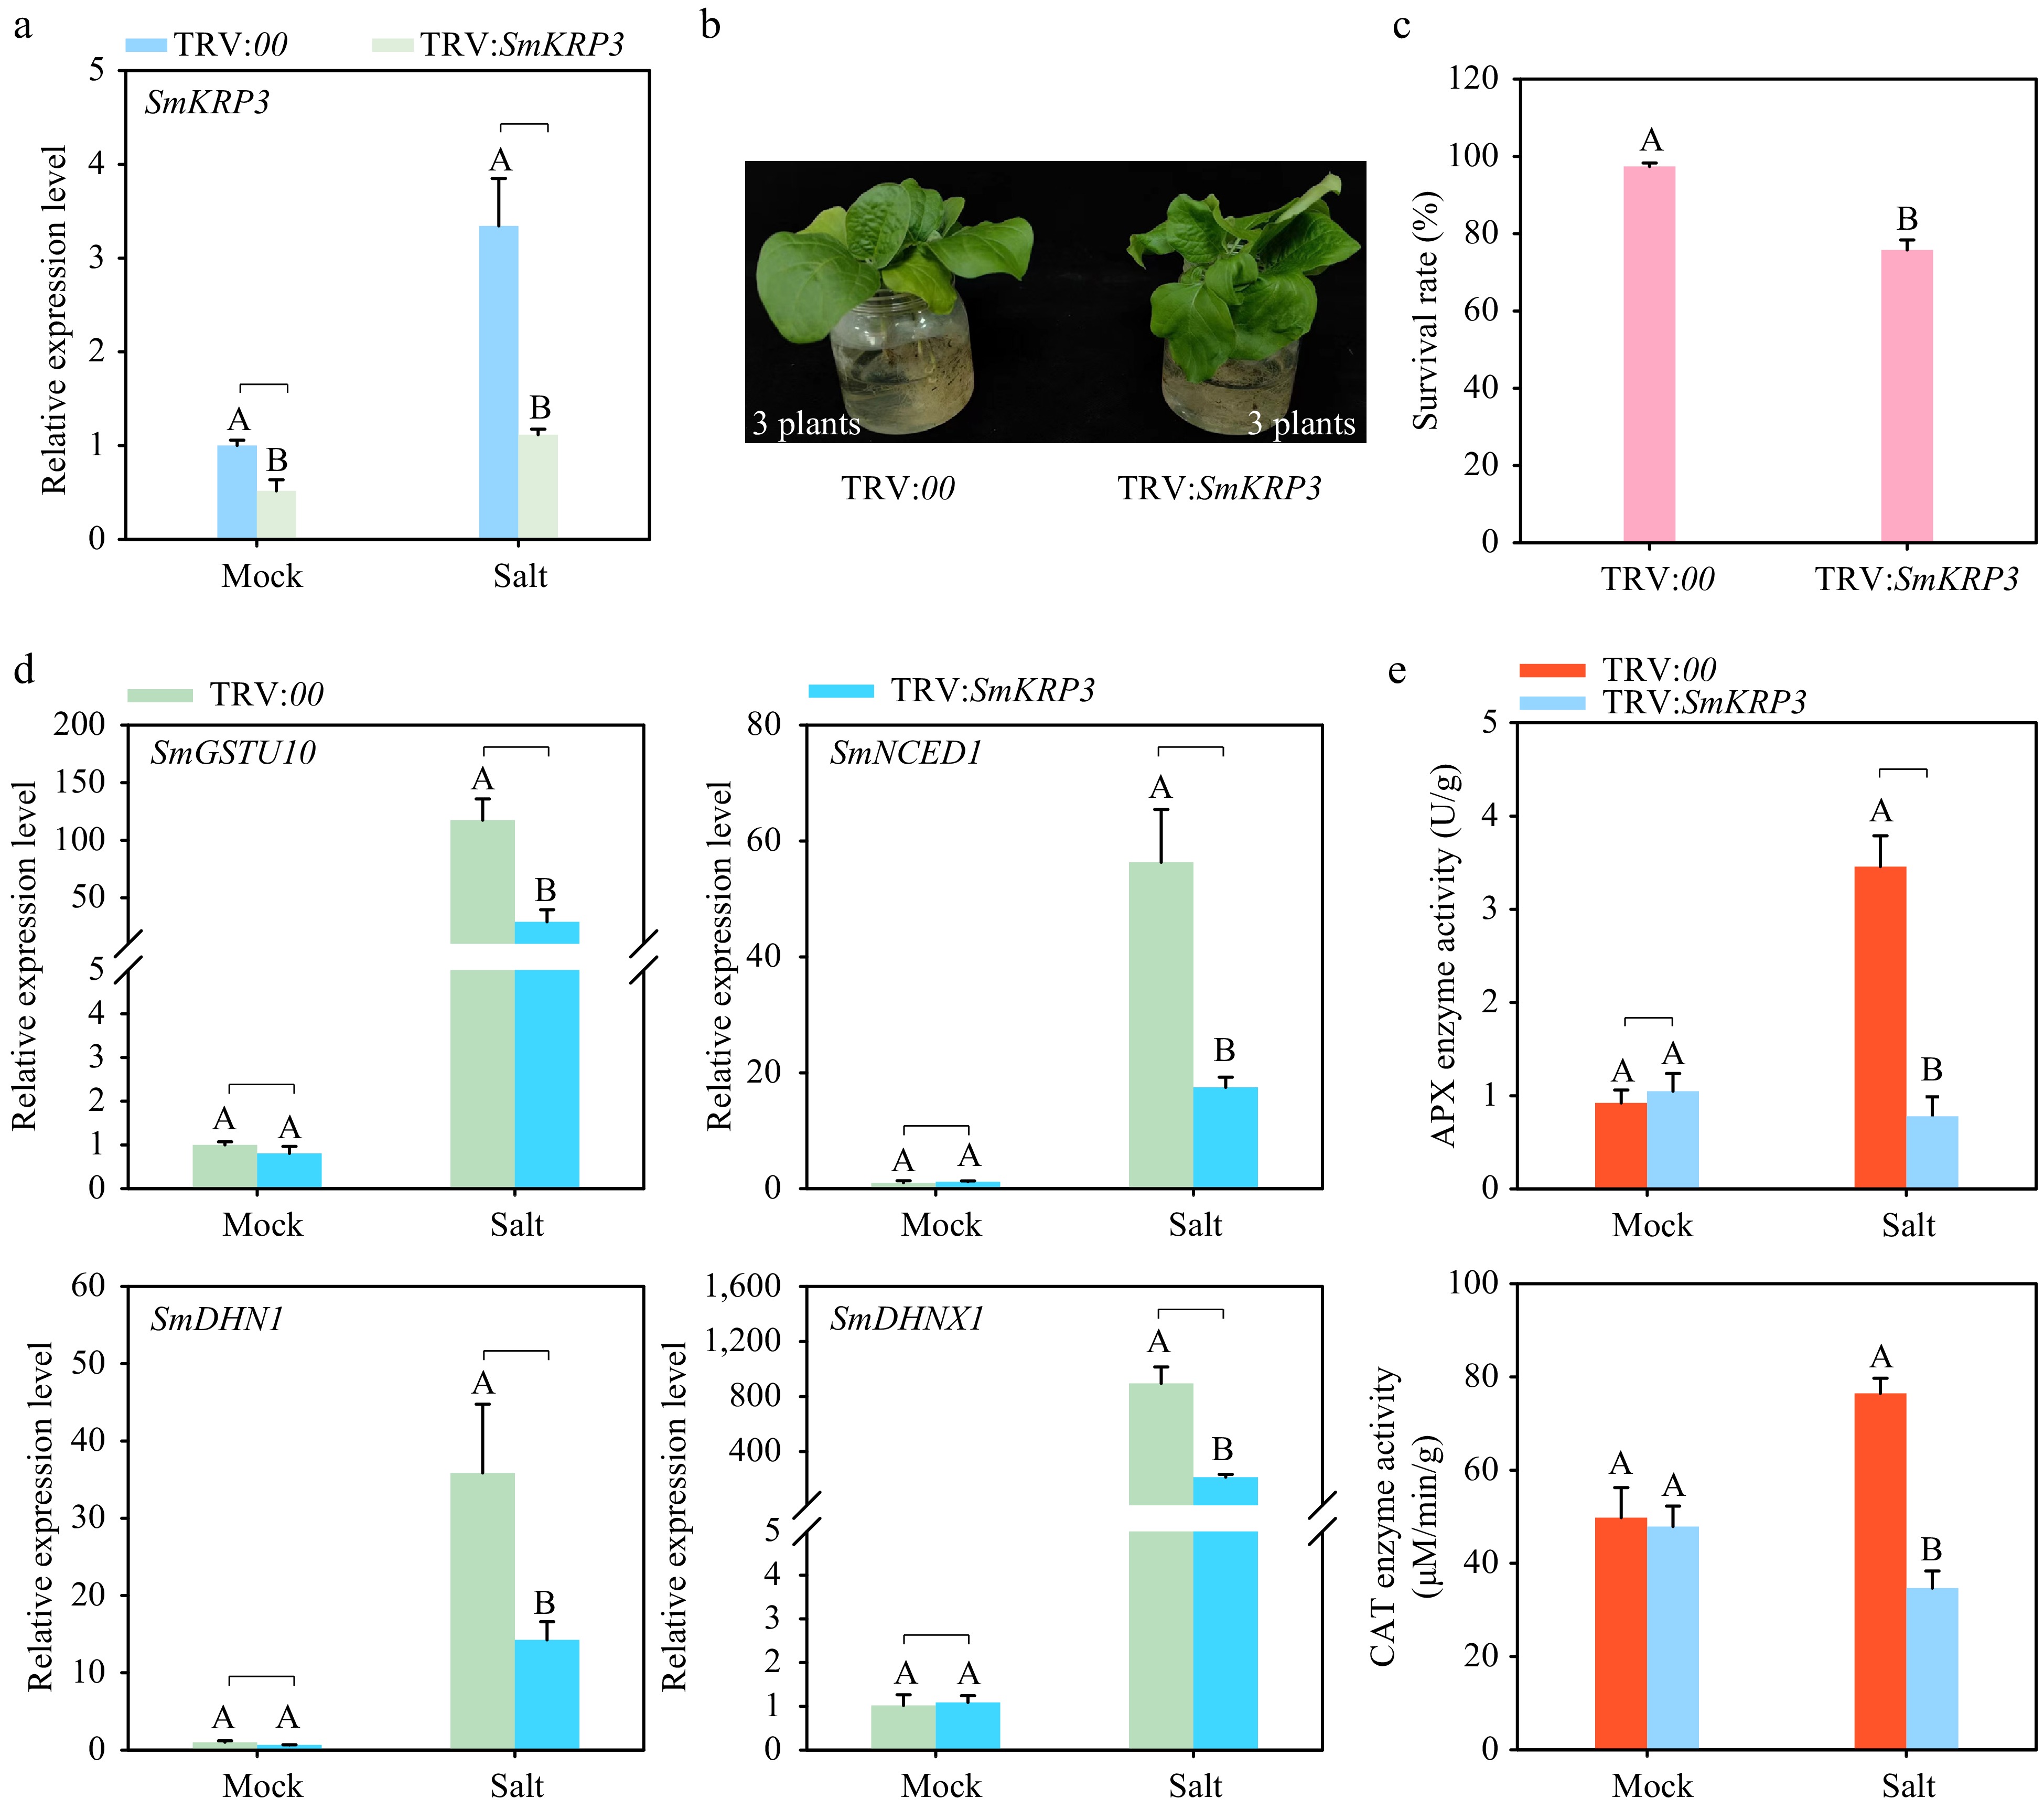
Figure 7.
Silencing of SmKRP3 enhances susceptibility of eggplant to salt stress. (a) Detection of silencing efficiency of SmKRP3. (b) Phenotype analysis of SmKRP3-silenced or control eggplants under salt stress treatment after 24 h post treatment. (c) Survival rate analysis of SmKRP3-silenced or control eggplants under salt stress treatment at 4 d post salt stress treatment. (d) Detection of expression levels of salt stress defense related marker genes SmGSTU10, SmNCED1, SmDHN1, and SmDHNX1 in the roots of SmKRP3-silenced or control eggplants at 24 h post salt stress treatment. (e) Measurements of APX and CAT enzyme activities in SmKRP3-silenced or control eggplant roots at 48 h post salt stress treatment. Three biological repeats were applied to calculate the mean ± standard deviation. Different uppercase letters represent highly significant differences, as performed by Student's t-test (p < 0.01).
-
Gene name Gene ID CDS length
(bp)Protein length
(aa)Molecular weight
(Da)Theoretical pI Instability index Grand average of
hydropathicitySmKRP1 Smechr0902520.1 636 211 23,426.48 9.47 45.52 −0.889 SmKRP2 Smechr0901526.1 483 160 18,779.21 9.84 62.55 −0.834 SmKRP3 Smechr0502598.1 669 222 24,471.22 9.28 50.26 −1.078 SmKRP4 Smechr0100331.1 663 220 24,529.1 5.11 40.16 −0.862 SmKRP5 Smechr0300499.1 474 157 18,579.92 6.98 62.29 −1.162 Table 1.
Physicochemical properties of the KRP family genes in eggplant.
Figures
(7)
Tables
(1)