-
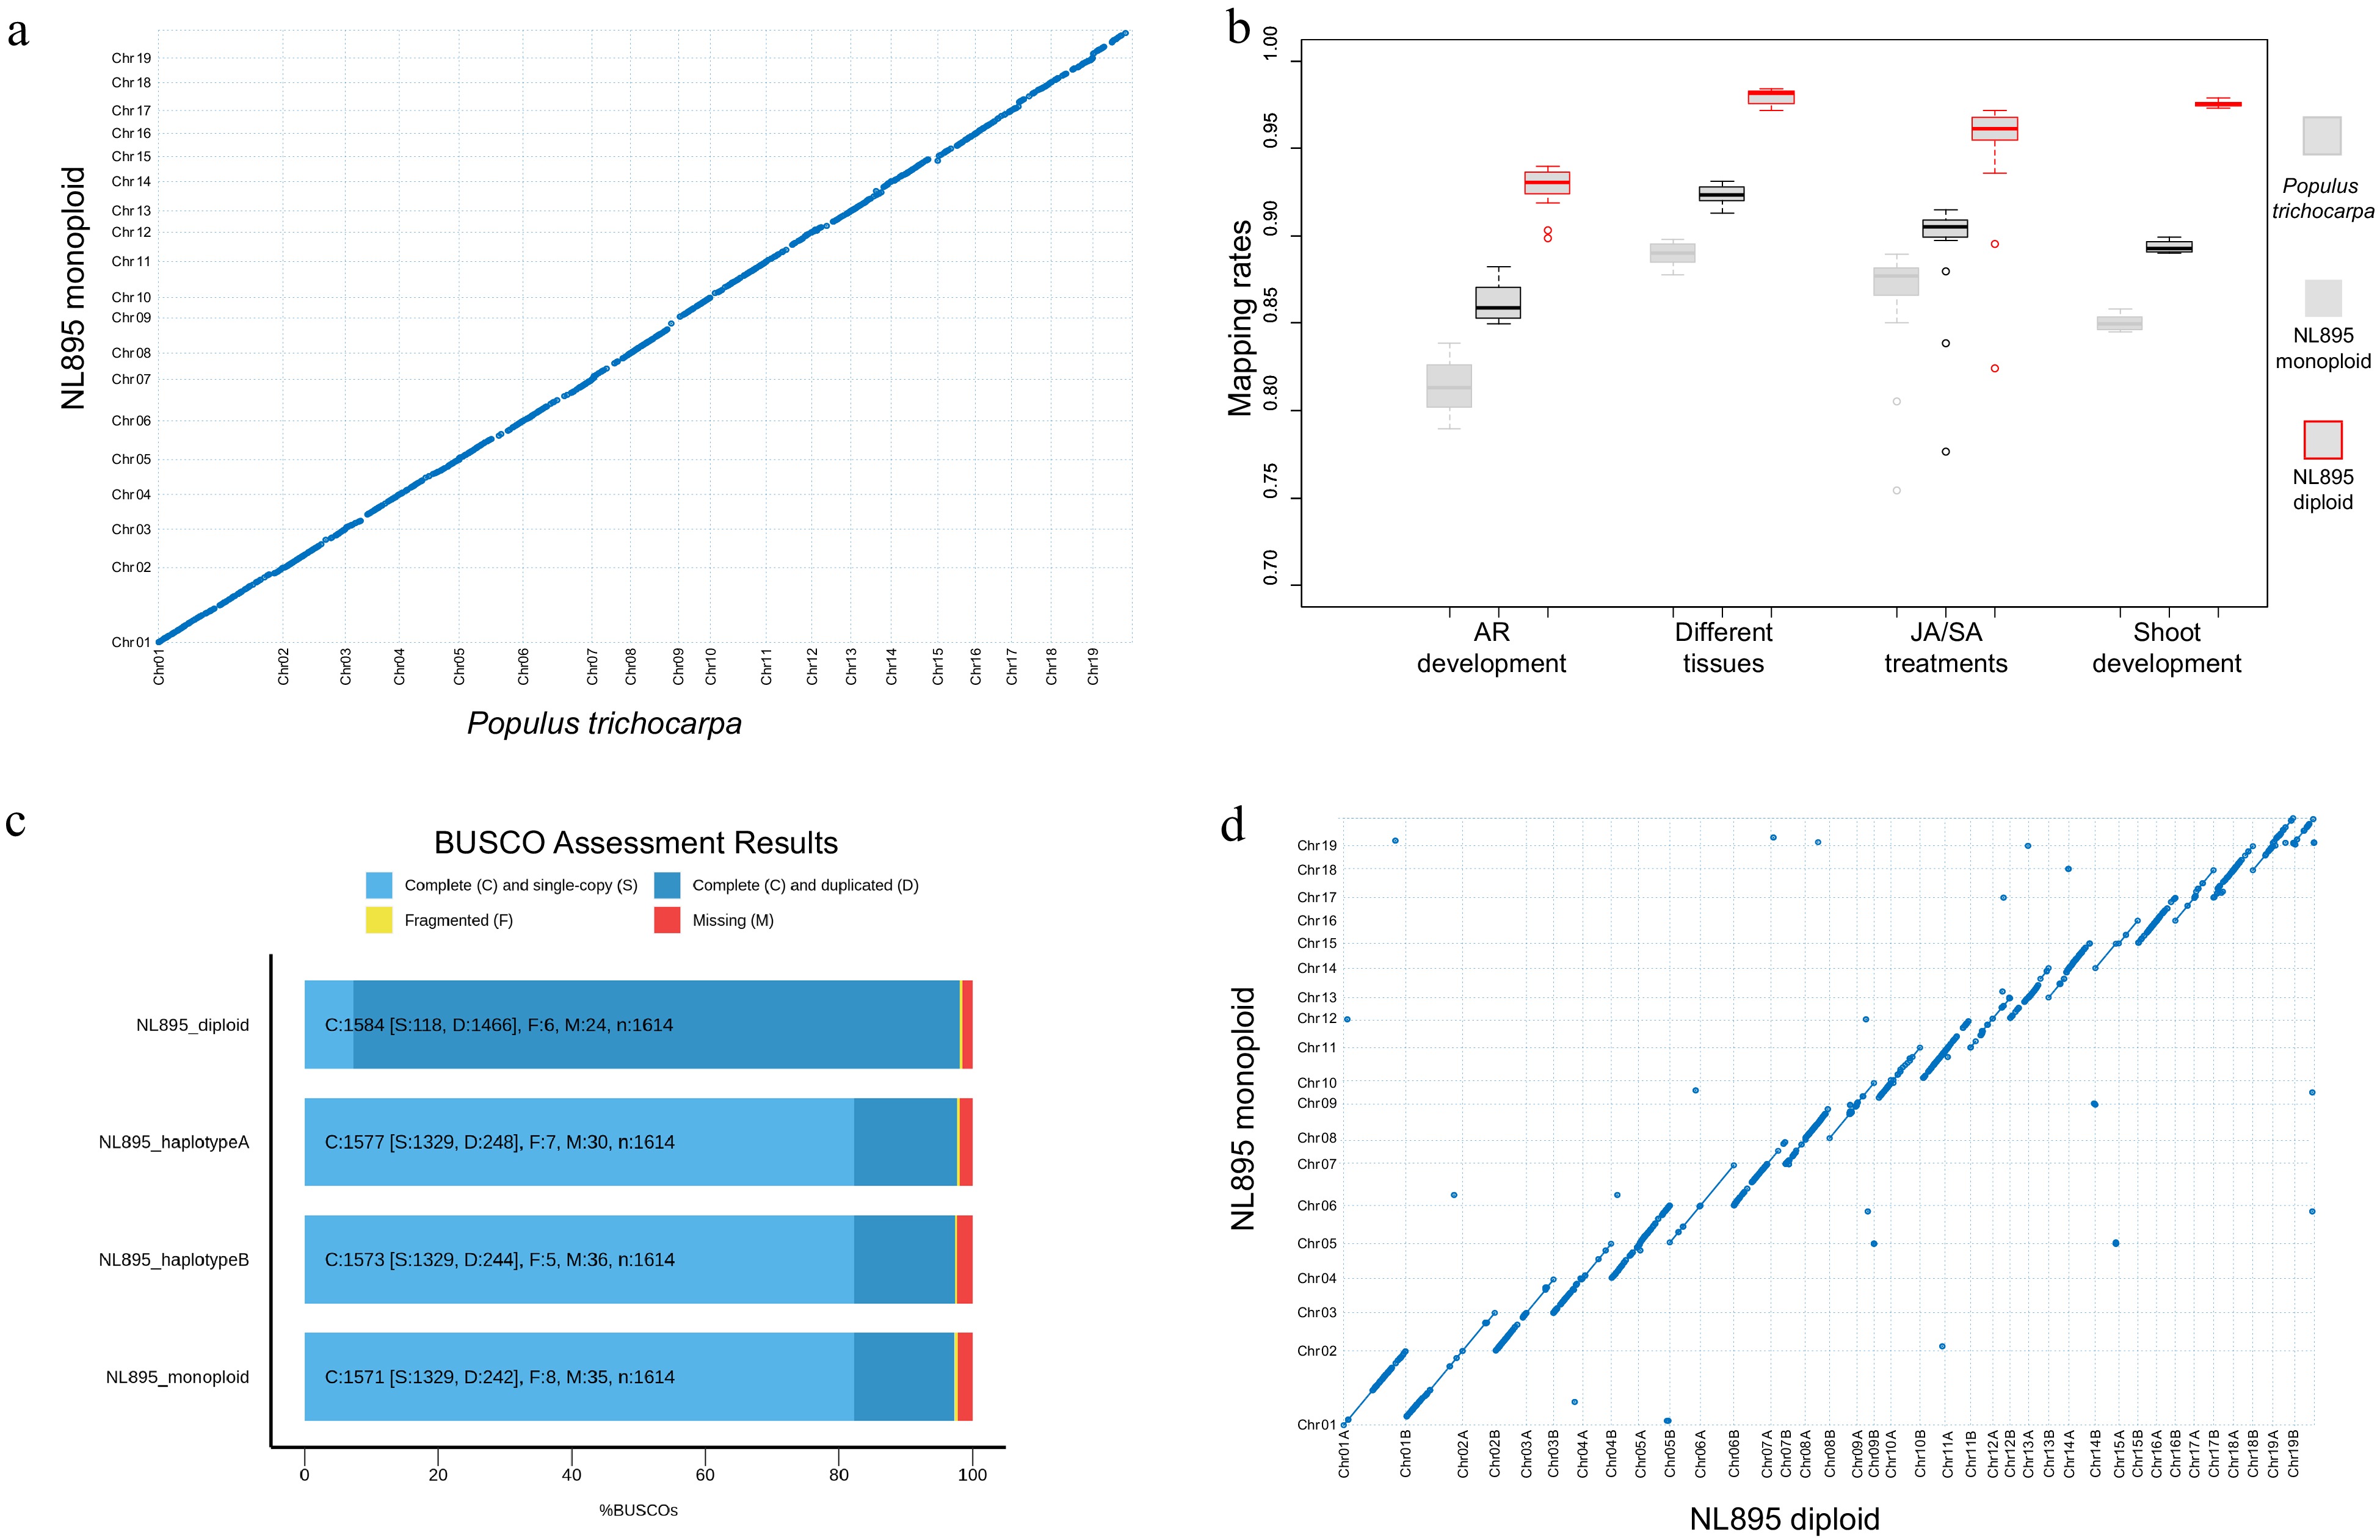
Figure 1.
Assessment of genome assembly of poplar line NL895. (a) Collinearity between the genome of monoploid NL895 and Populus trichocarpa. (b) Mapping rate of RNA-Seq when the three genomes were used as reference. Four experiments including 60 RNA-Seq samples were used in this analysis. (c) Busco assessment for monoploid, diploid, haplotype A and B of the NL895 genome. (d) Collinearity between the genomes of NL895 monoploid and diploid.
-
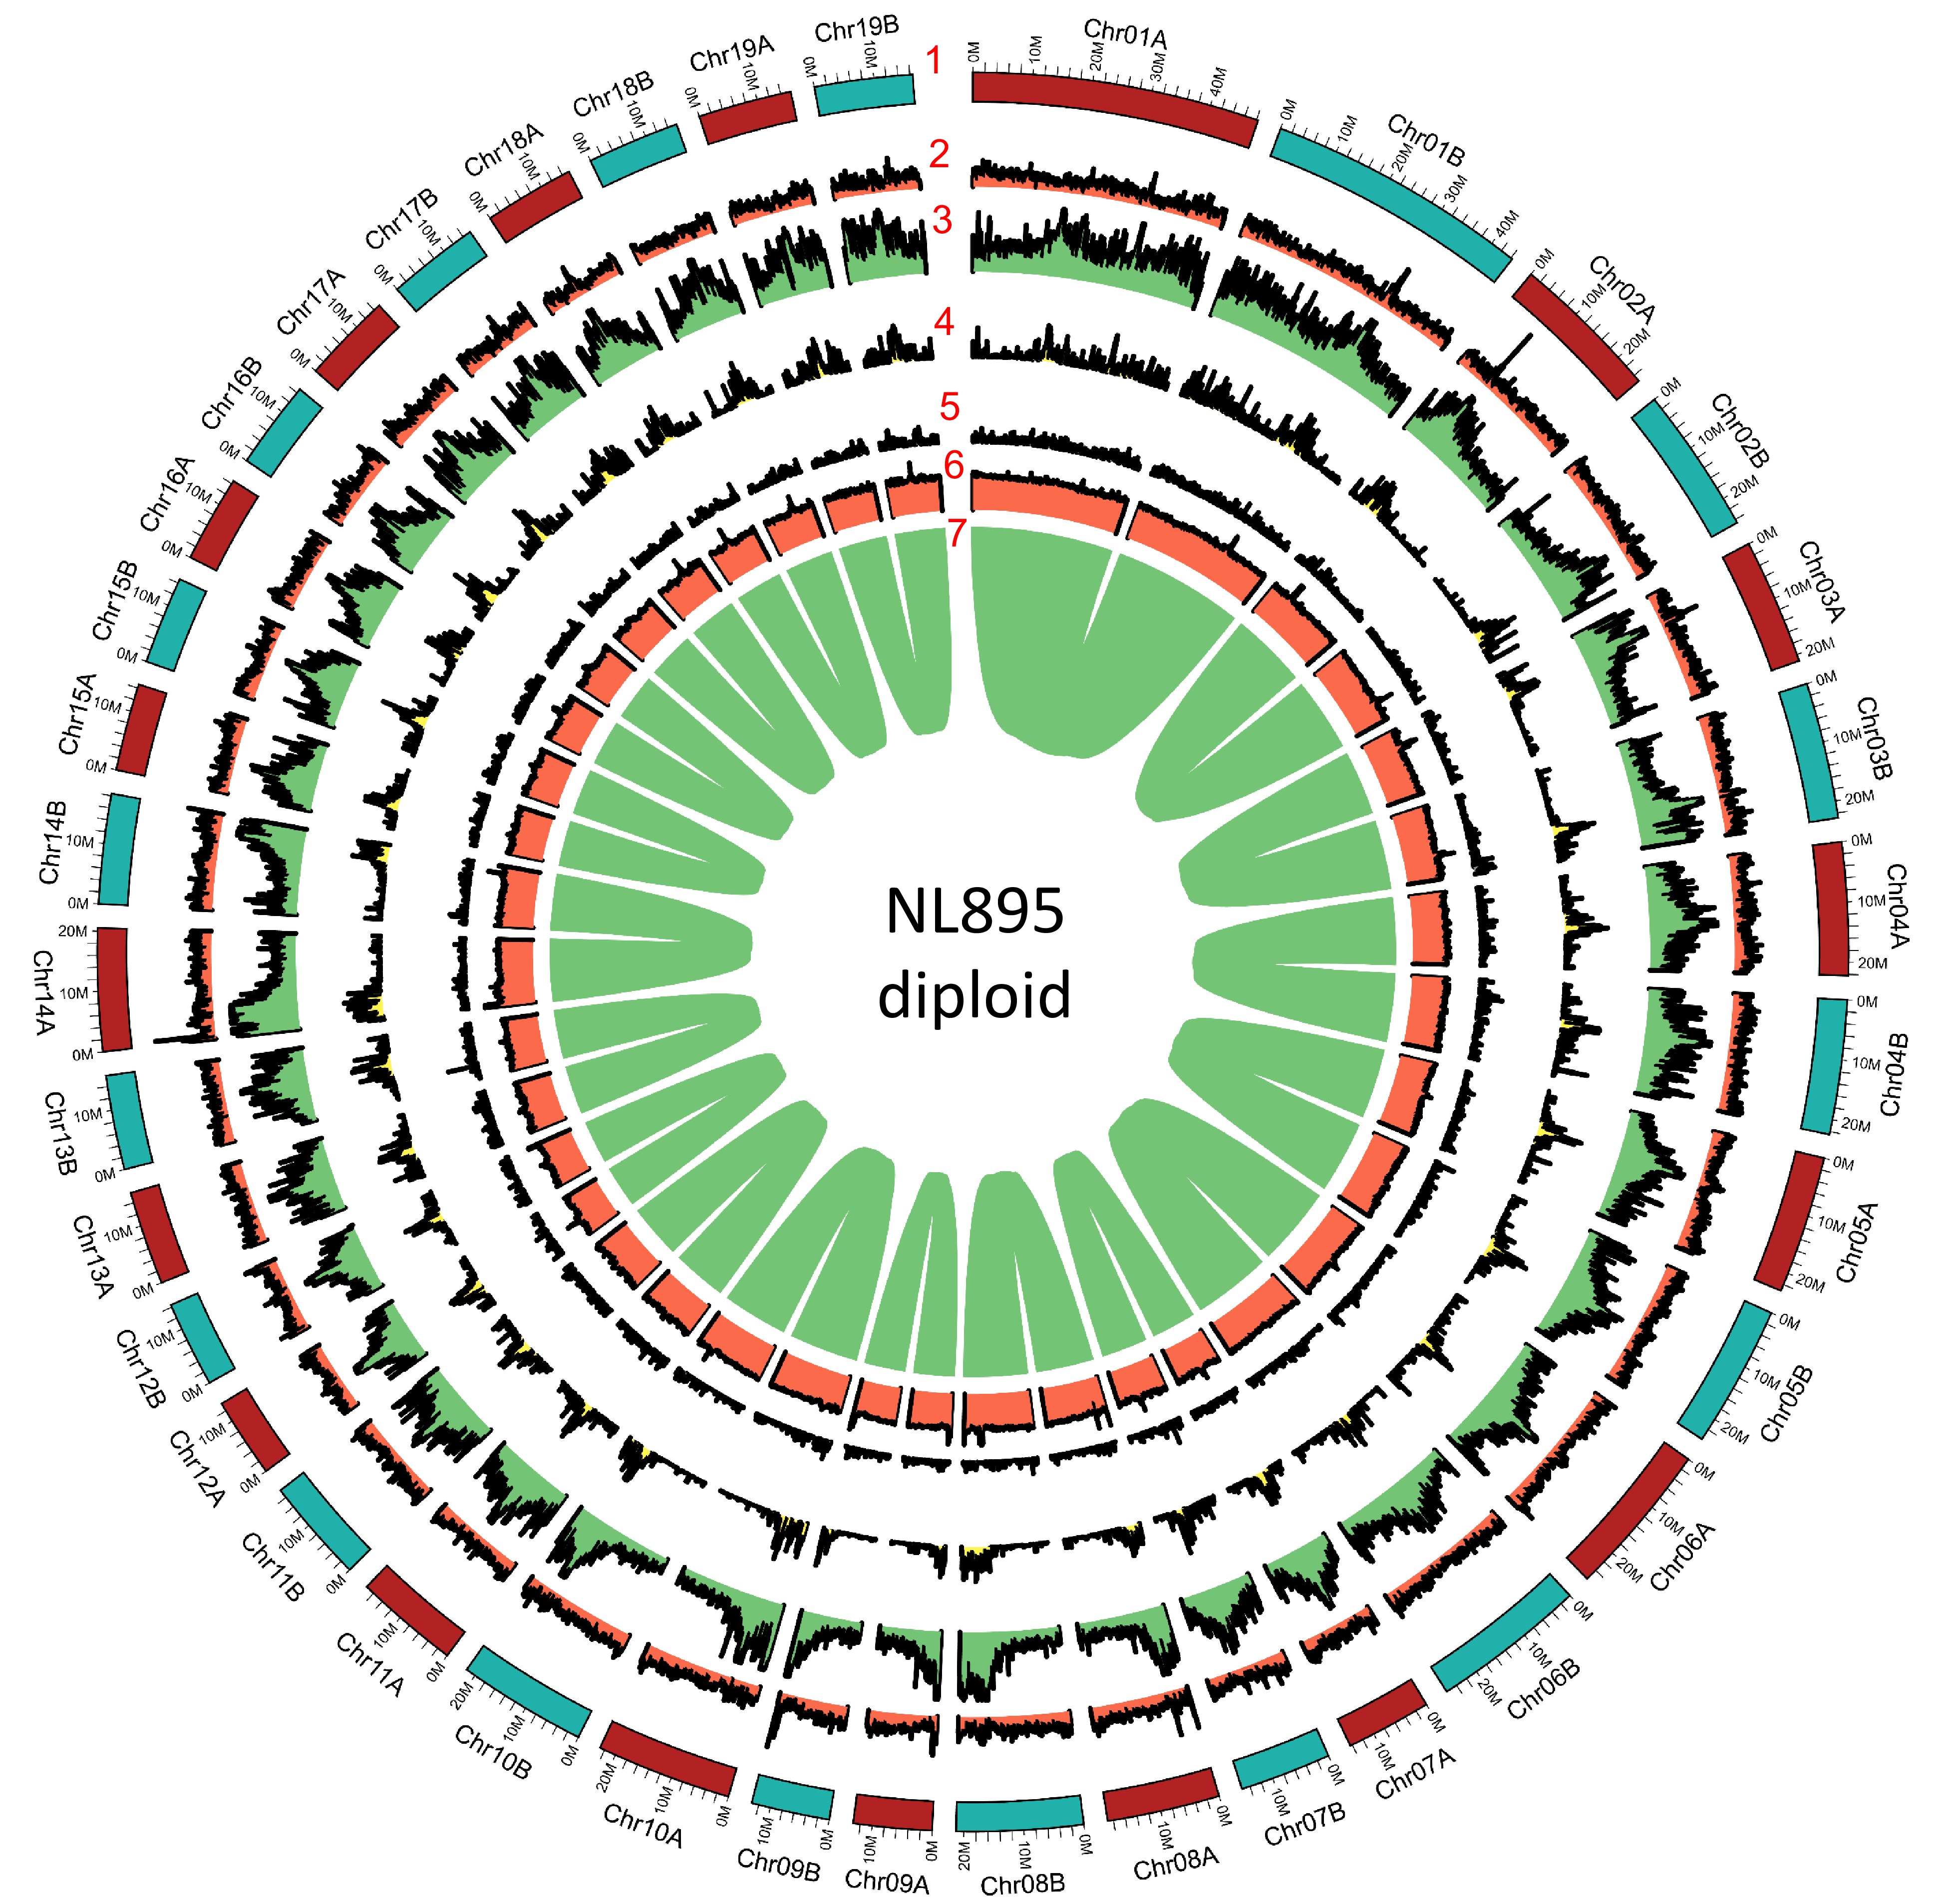
Figure 2.
Genome annotation for the NL895 diploid. Numbers 1 to 7 represent chromosomes, gene density, repeat content, Gypsy transposon content, Copia transposon content, GC content and gene pairs, respectively.
-
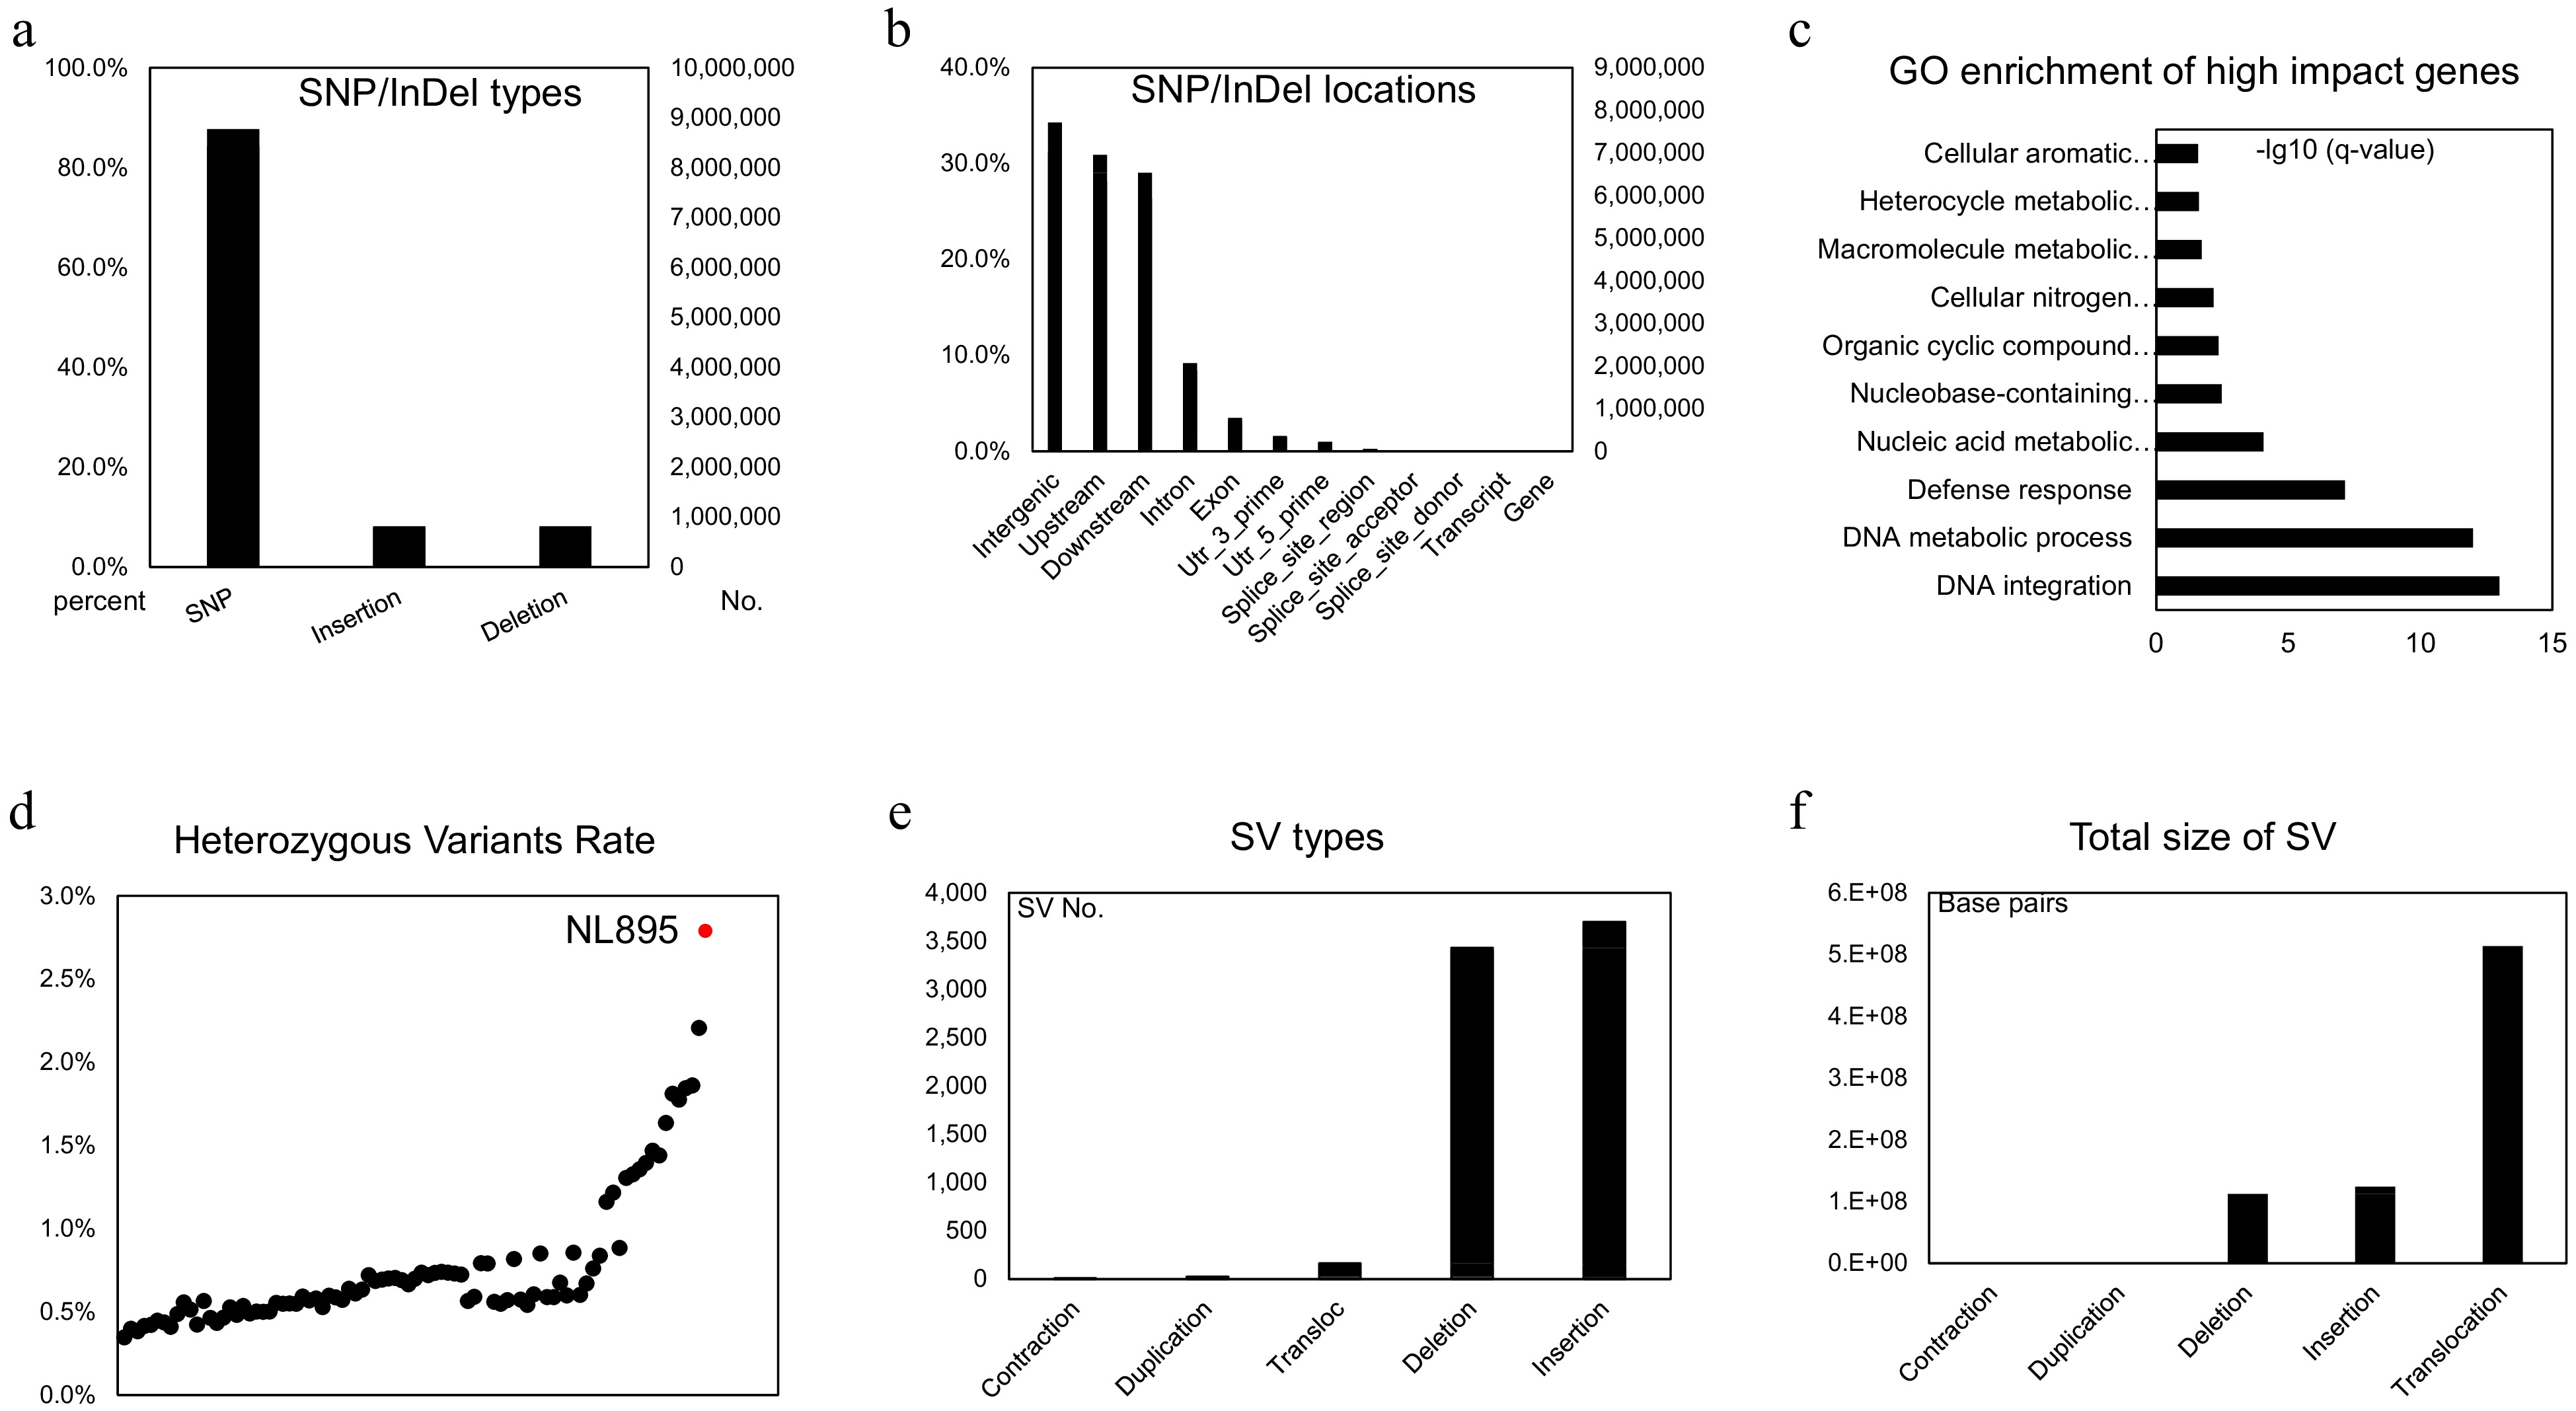
Figure 3.
Genomic variants analysis in the diploid genome of NL895. (a) Numbers of SNP/Indels in the diploid genome of NL895. (b) Locations of SNP/Indels in the diploid genome of NL895. (c) GO enrichment of high impact genes by SNP/Indels. From the bottom to top, the full descriptions of GO terms are 'DNA integration DNA metabolic process', 'Defense response', 'Nucleic acid metabolic process', 'Nucleobase-containing compound metabolic process', 'Organic cyclic compound metabolic process', 'Cellular nitrogen compound metabolic process', 'Macromolecule metabolic process', 'Heterocycle metabolic process' and 'Cellular aromatic compound metabolic process'. (d) Heterozygous Variants Rates between poplar NL895 and other lines. The heterozygosity of NL895 is marked in red. (e) Numbers of structure variations (SVs) in the diploid genome of NL895. (e) Genomic sizes of structure variations (SVs) in the diploid genome of NL895.
-
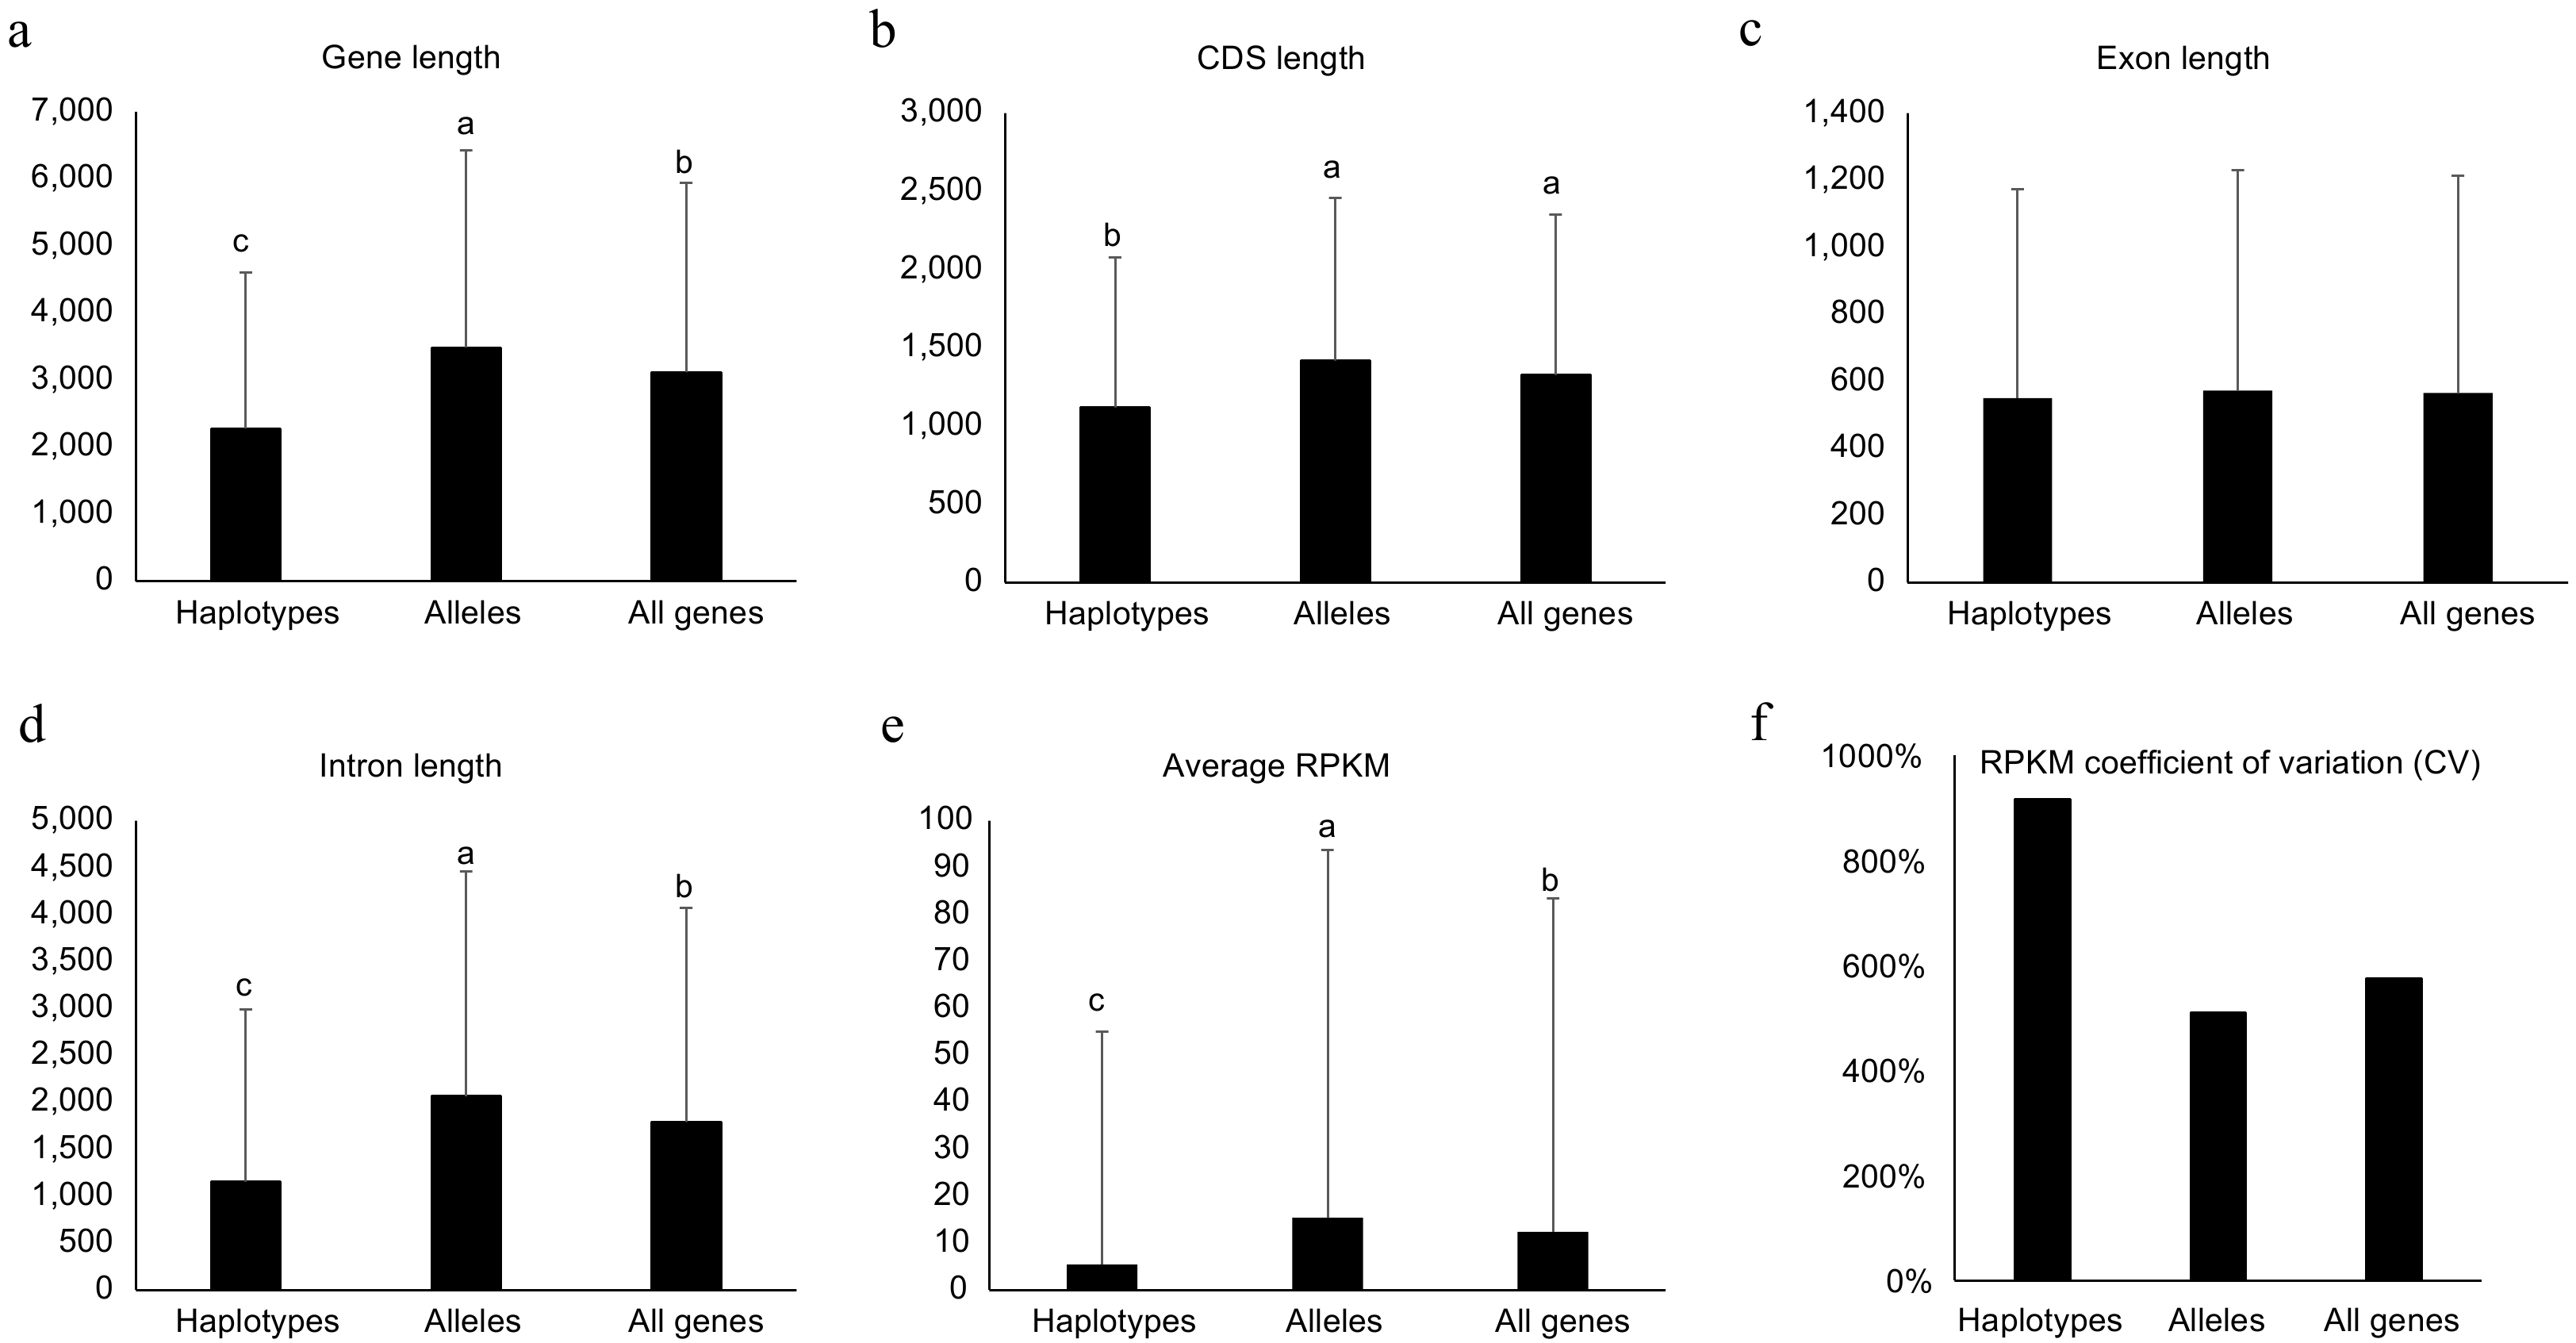
Figure 4.
Genomic features for haplotype-specific, allelic and all genes in the diploid genome of NL895. Length of Genes, coding DNA sequence (CDS), exon and intron are shown in (a)−(d), respectively. The average of reads per million mapped reads (RPKM) and RPKM coefficient of variation (CV) are shown in (e) & (f), respectively. Multiple comparisons were performed for the average values among different groups with 'TukeyHSD' implemented in R in (a)−(e). Different lowercase letters indicate significant differences (p < 0.05). Error bars represent ± SD.
-
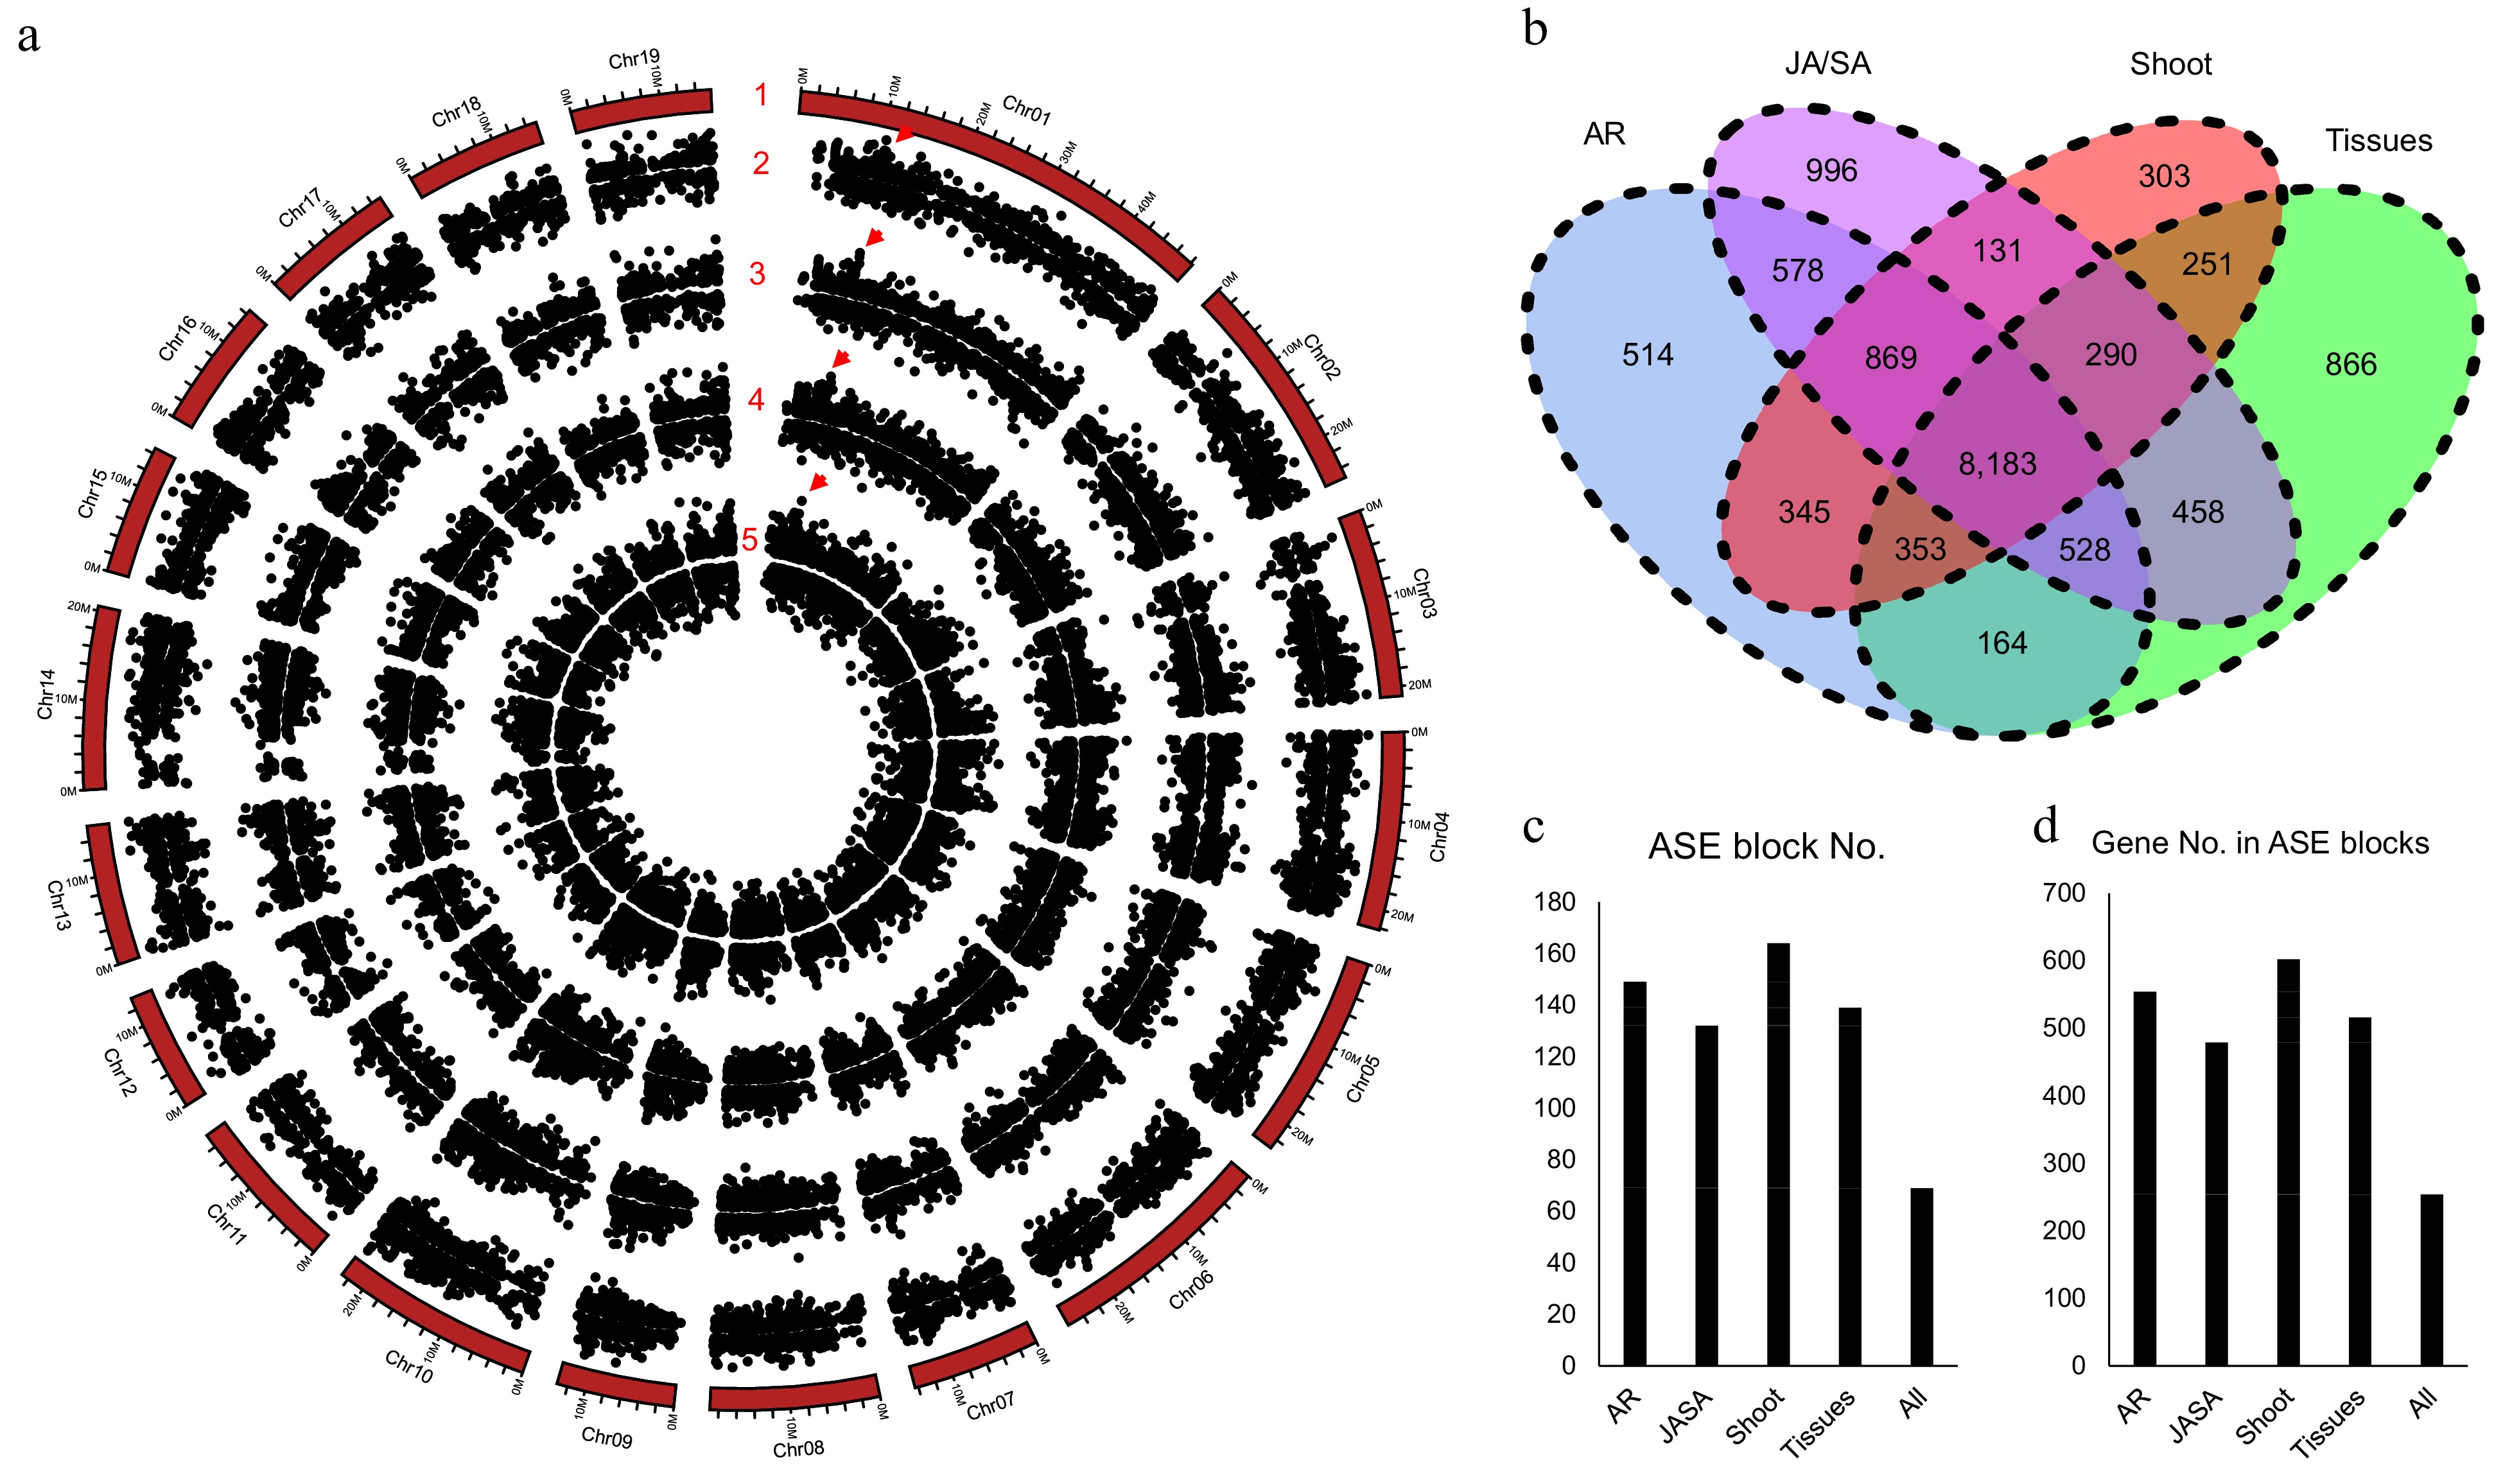
Figure 5.
Allele specific expression (ASE) analysis for poplar NL895. (a) Number 1 represents chromosomes. Numbers 2−5 represent the locations of allele specific expression (ASE) in the four experimental data, different tissues (Tissues), JA_SA_Treatment (JA/SA), shoot development (Shoot), and adventitious development (AR), respectively. The largest ASE block was located on chromosome 1: 10,430,635−10,467,471 with ca. 36.8 kb in size and it is marked by red triangles. (b) Venn diagram of gene numbers of ASE in the four experiments. (c) ASE block numbers in the whole genome. (d) Gene numbers in the ASE blocks.
-
Features Monoploid Diploid Haplotype A Haplotype B Assembly length (bp) 412,628,918 815,138,040 N/A N/A Contig N50 Length (bp) 14,829,479 13,599,823 N/A N/A Shortest sequence length (bp) 2,548 2,548 N/A N/A Longest sequence length (bp) 26,037,430 26,037,430 N/A N/A Total number of contigs 242 606 N/A N/A Final genome size (bp) 404,381,870 824,114,582* 377,691,676 378,545,799 GC content (%) 34.38 33.91 33.49 33.47 Protein-coding gene number 49,520 88,687 41,561 41,660 Transcript number 61,532 101,353 48,090 47,169 Average of gene length (bp) 3,218.7 3,150.6 3,231.7 3,188.5 Average of mRNA length (bp) 1,860.1 1,728.8 1,771.5 1,16.2 Average of CDS length (bp) 1,329.3 1,349.2 1,359.6 1,359.4 Exon number 321,605 519,987 252,863 244,402 Intron number 260,073 418,634 204,773 197,233 Average of exon length (bp) 355.9 337 336.9 331.2 Average of intron length (bp) 415.7 406.8 408 408.2 * This size includes ca. 67 Mb bp scaffolds that could not be assigned onto any haplotypes, below parameters were concluded according to 791,466,253 bp. Table 1.
Summary of poplar NL895 genome assembly and annotation.
-
Type Monoploid Diploid Number Length (bp) Percent (%) Number Length (bp) Percent (%) LINEs 4,935 4,193,674 1.04 9,572 7,934,717 0.96 LTR elements 82,685 57,109,054 14.12 167,625 112,791,927 13.69 DNA transposons 18,295 13,945,655 3.45 37,091 27,637,781 3.35 Rolling-circles 1,504 869,410 0.21 2,934 1,669,040 0.2 Unclassified 314,000 108,124,463 26.74 647,665 221,061,595 26.82 Low complexity 20,817 992,939 0.25 43,019 2,076,941 0.25 Simple repeats 118,555 4,603,428 1.14 242,702 9,687,811 1.18 Total 560,791 189,838,623 46.95 1,112,622 382,859,812 46.46 Table 2.
Repeat sequences of the poplar NL895 genome.
Figures
(5)
Tables
(2)