-
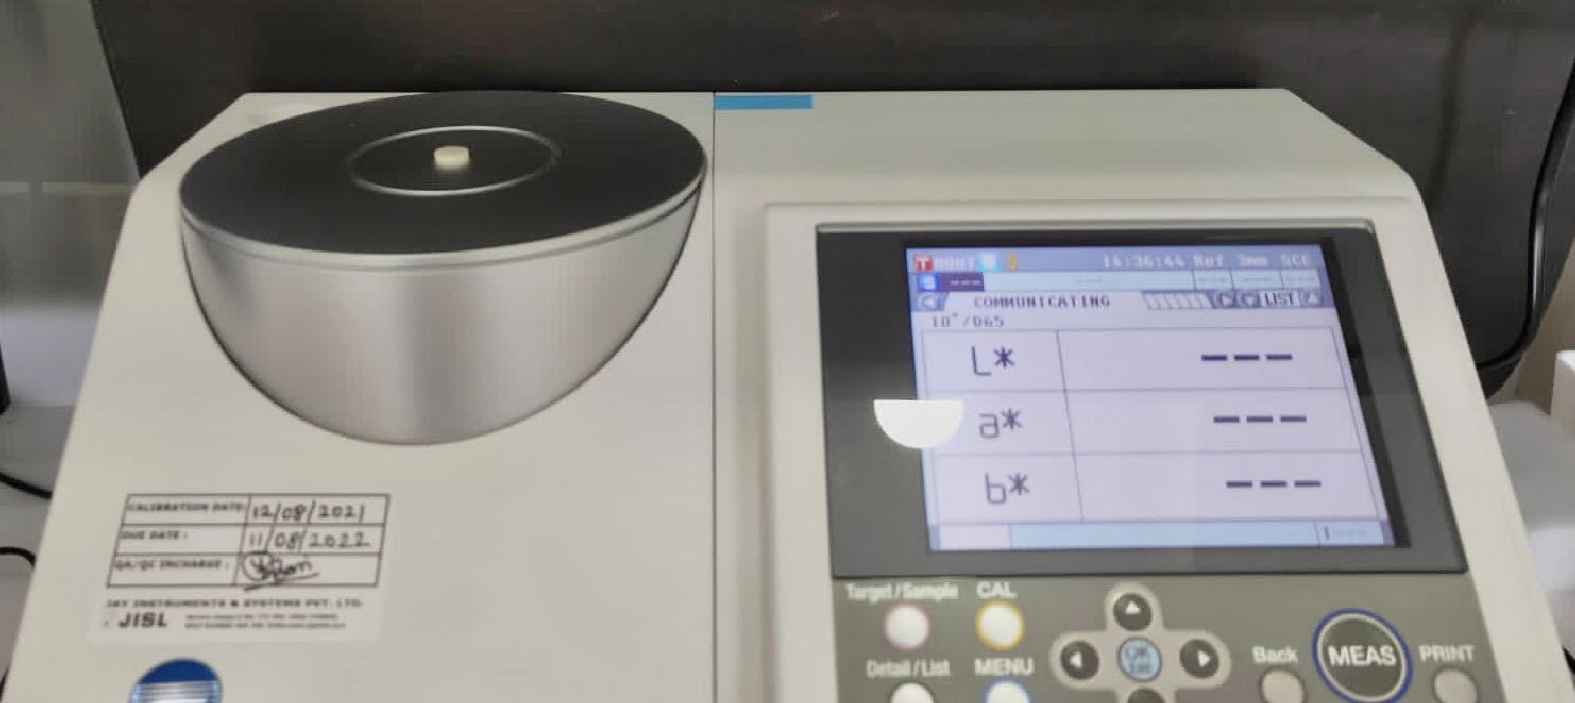
Figure 1.
Colorimetric assessment using Spectrophotometer (Spectrophotometer CM5, Konica Minolta, Tokyo, Japan).
-
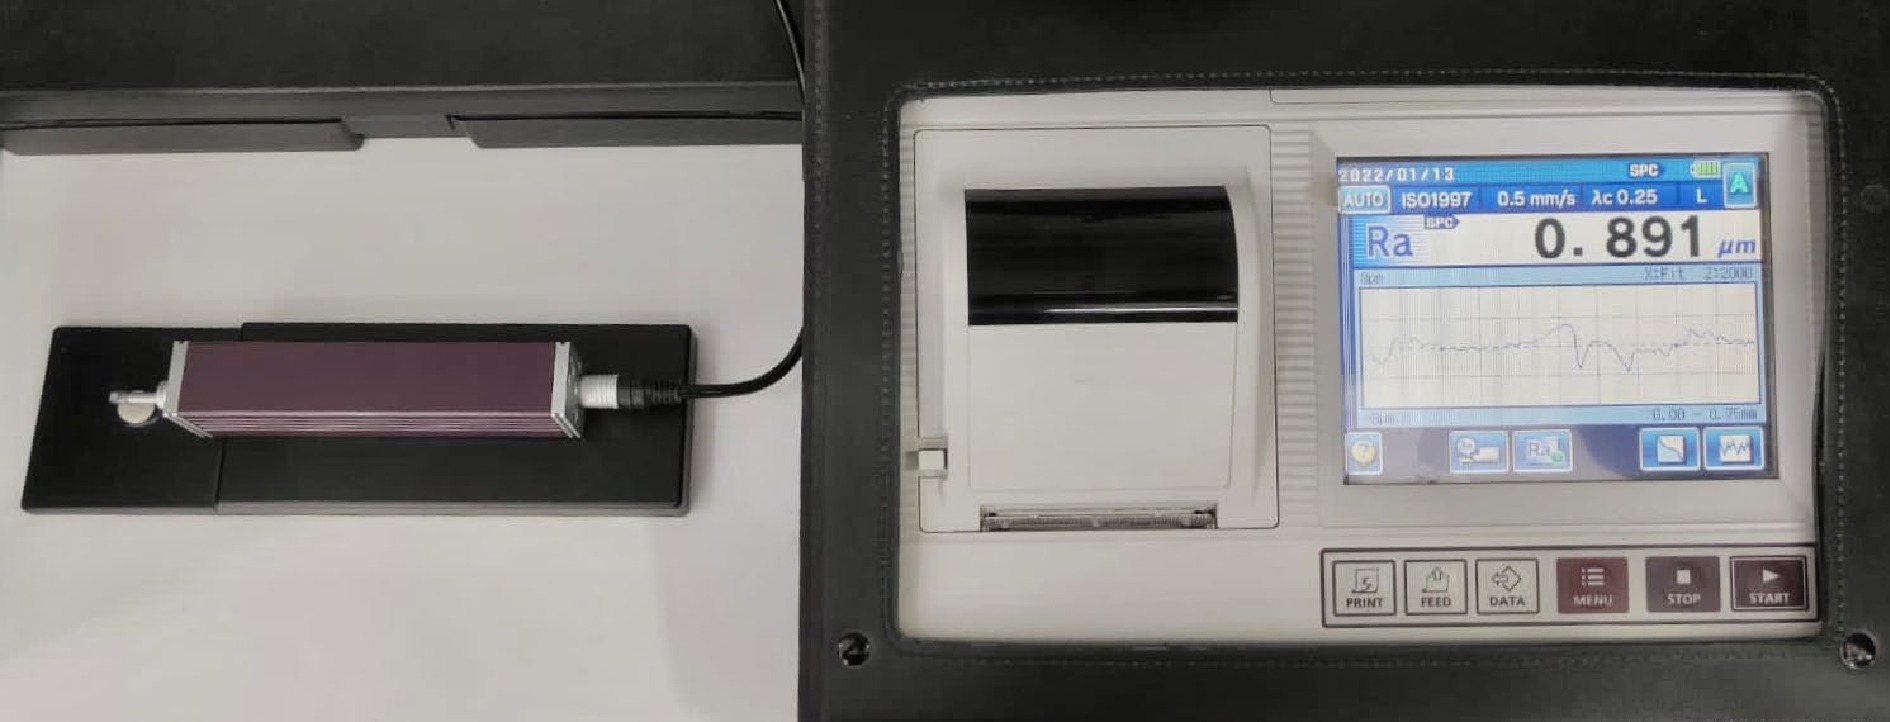
Figure 2.
Surface roughness assessment using surface profilometer (Mitutoyo SJ-310, Tokyo, Japan).
-
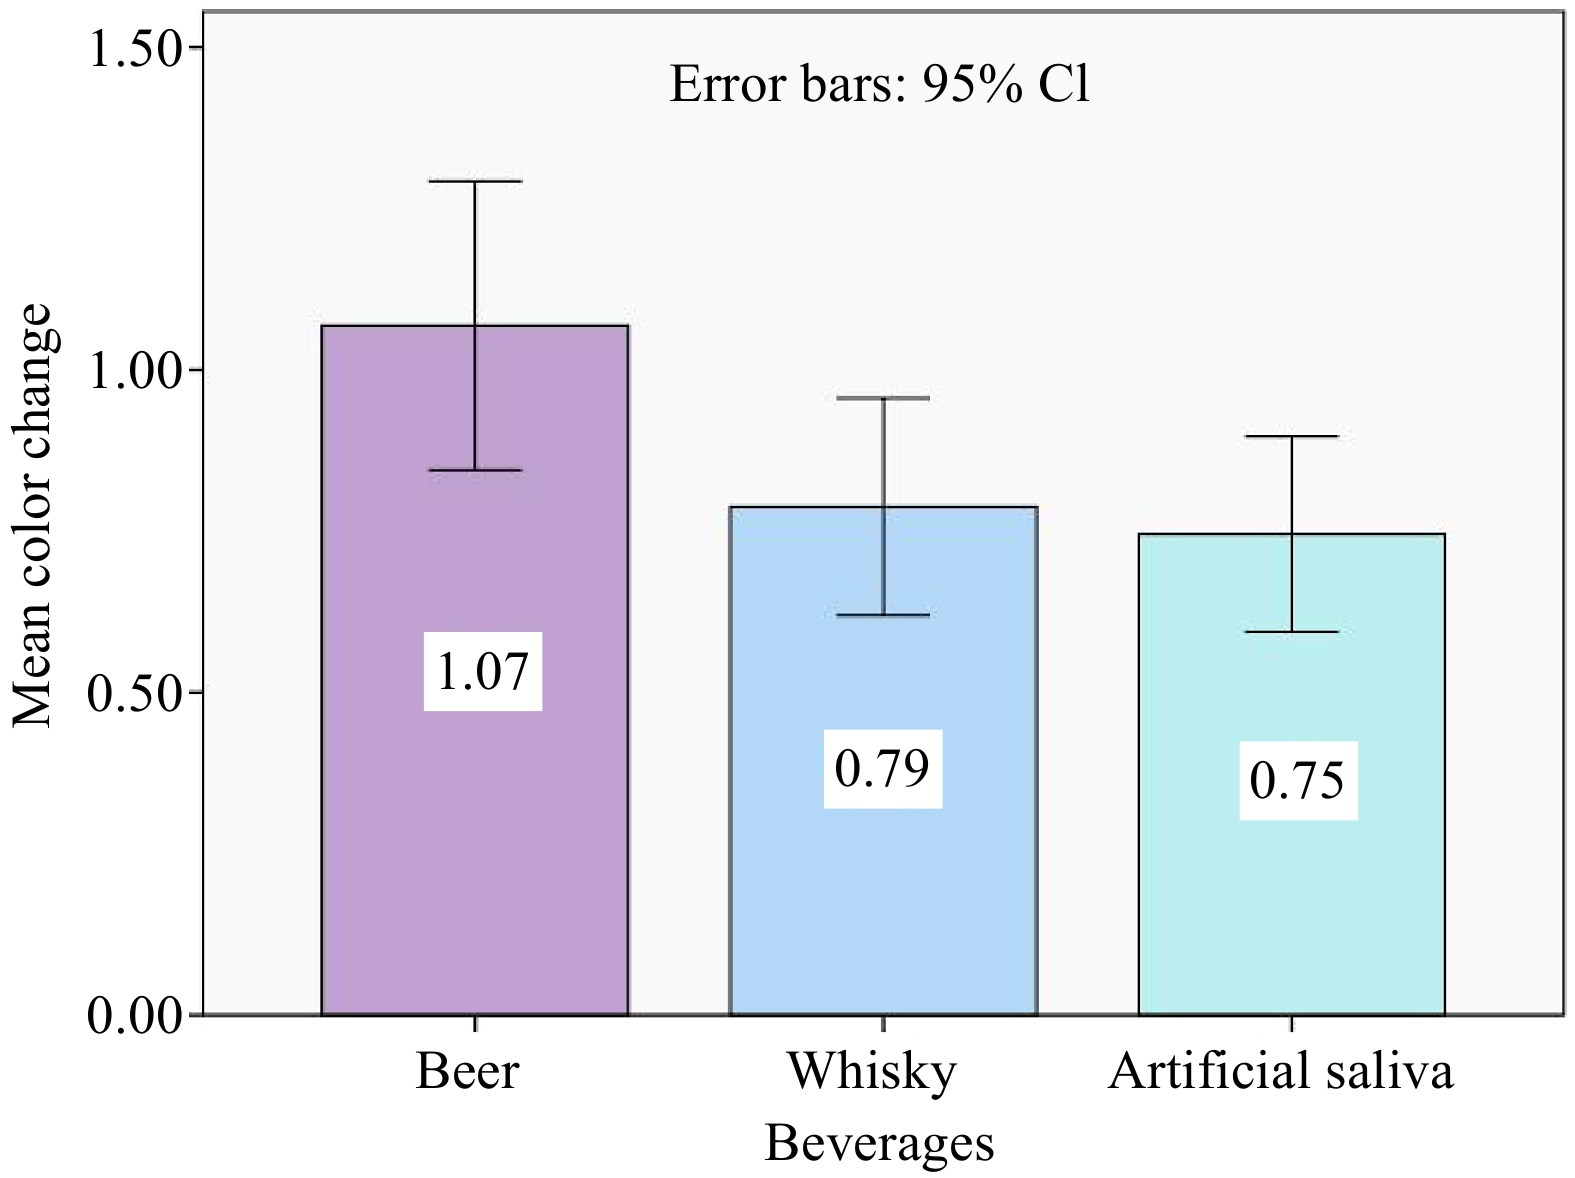
Figure 3.
Bar graph depicting the mean color change (ΔE) of evaluated resin after 15 days of immersion in different solutions. The standard error is represented by the error bars.
-
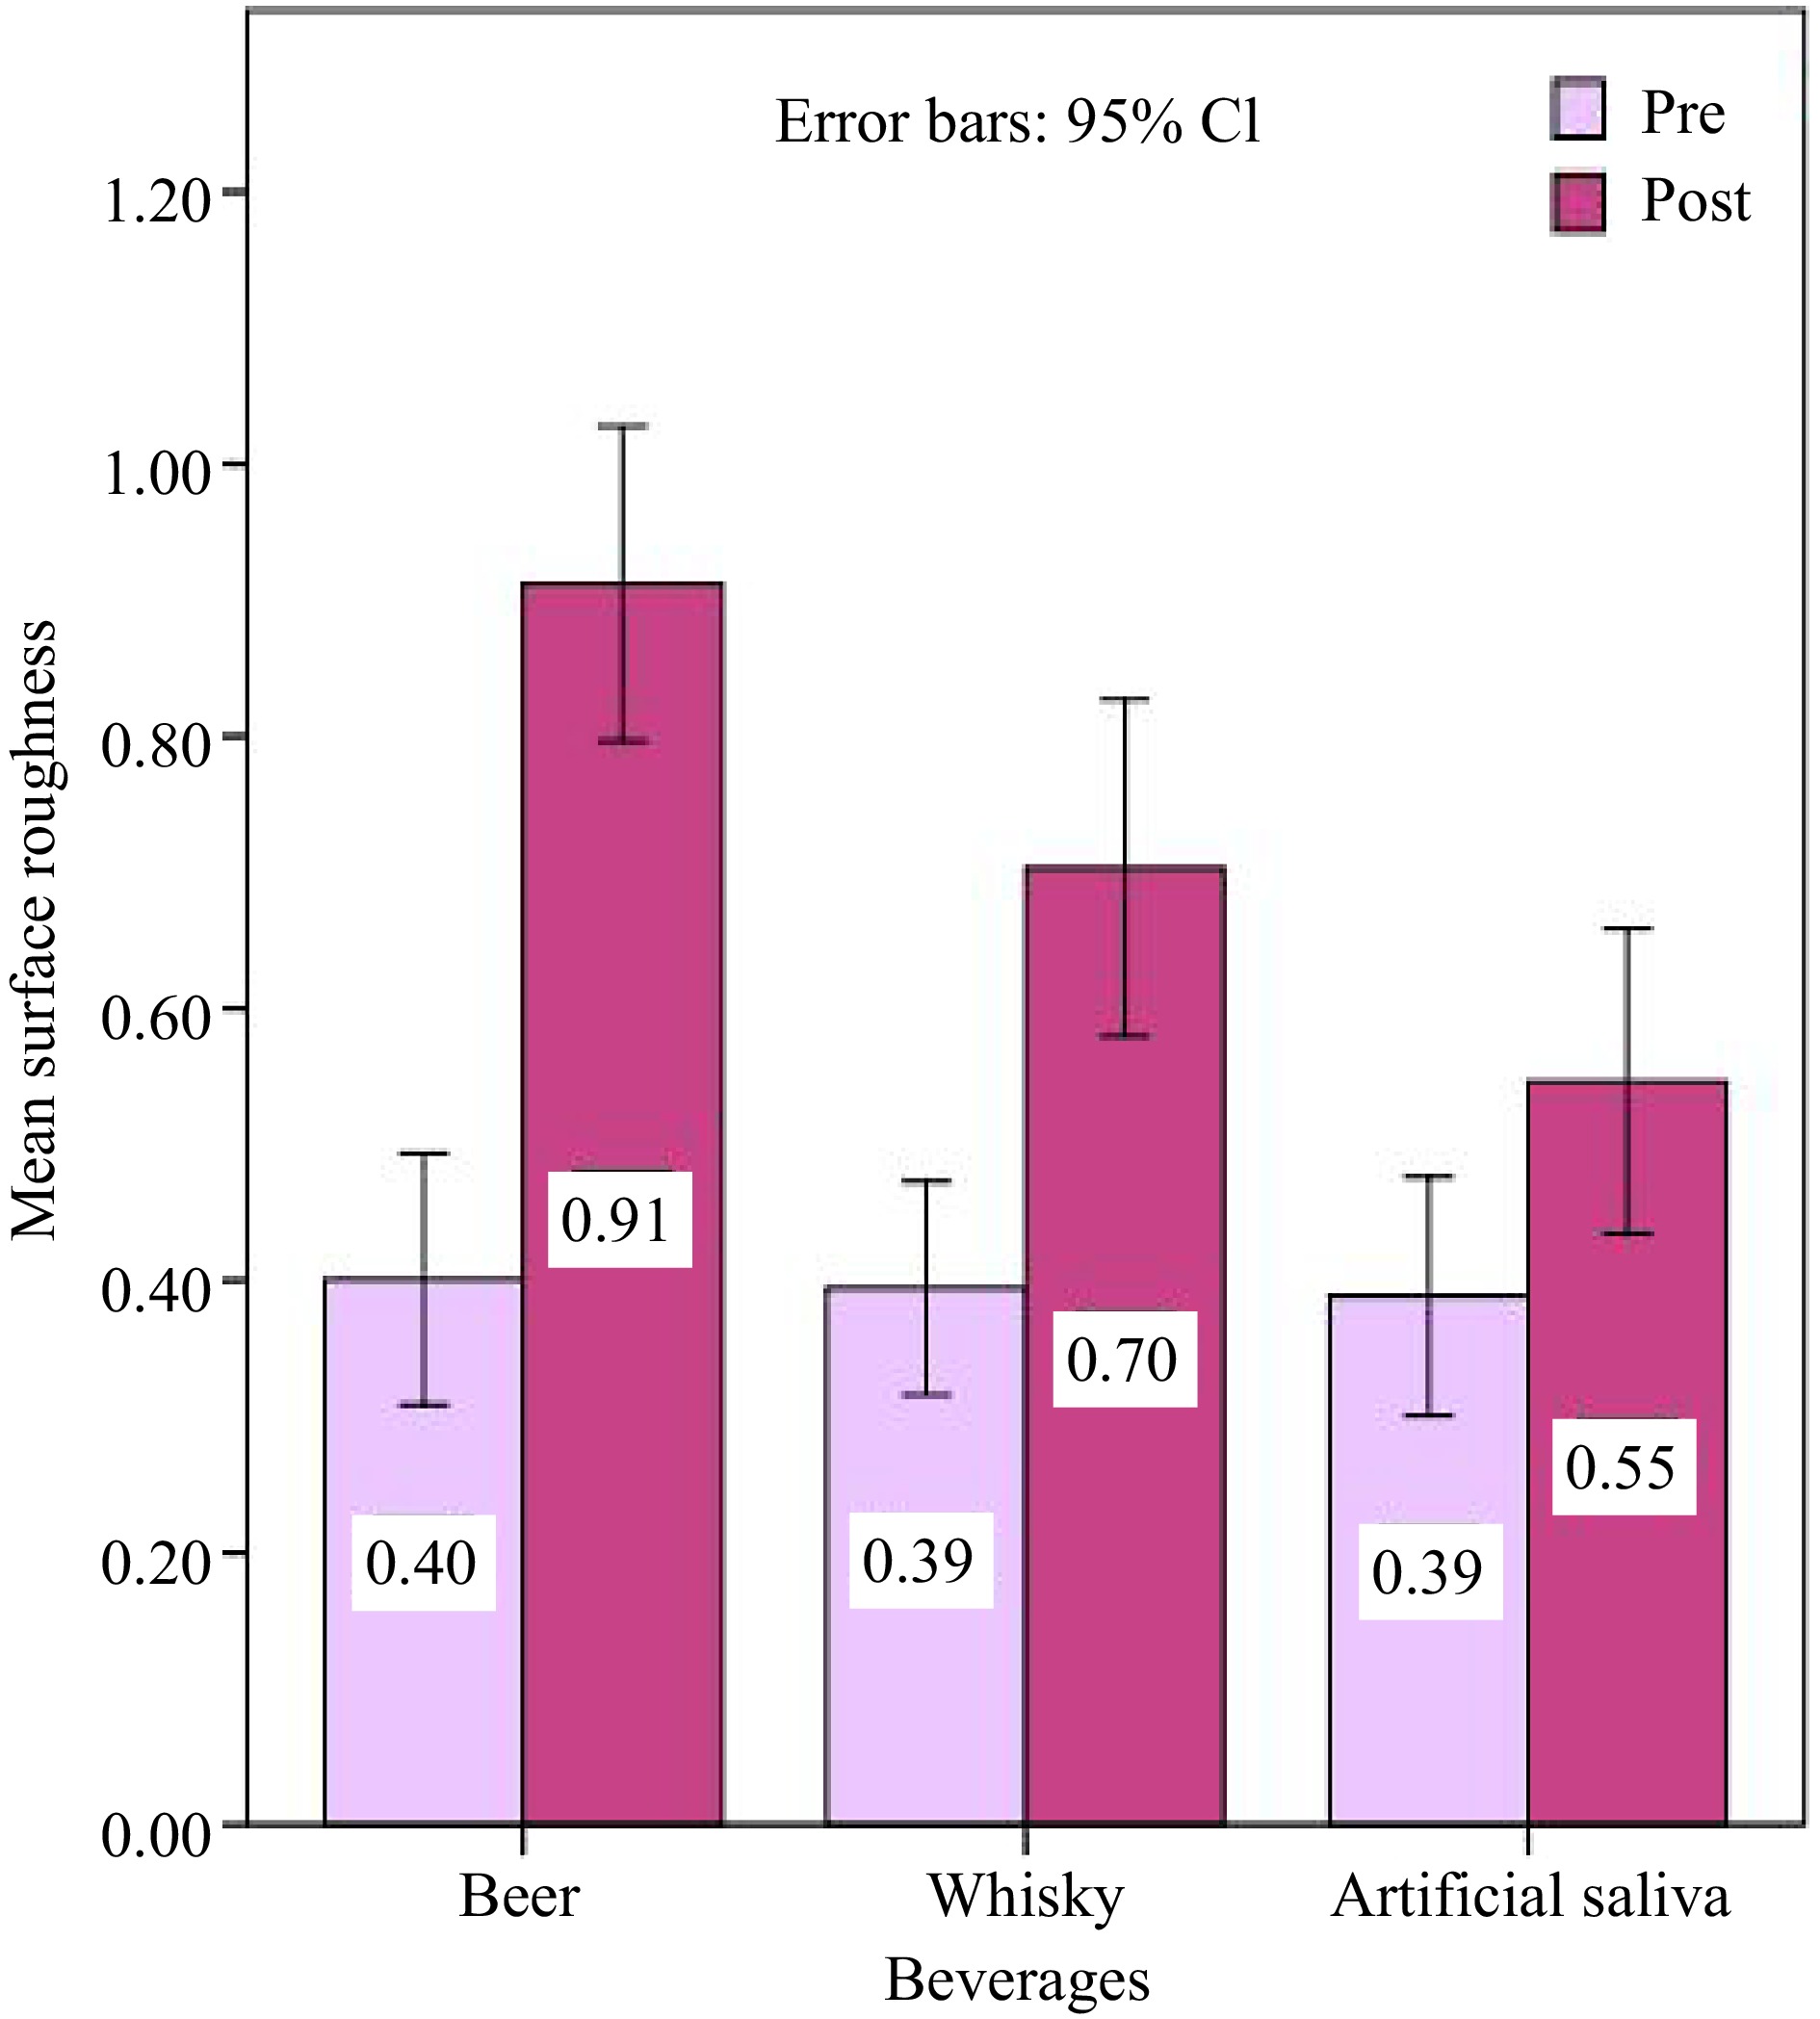
Figure 4.
Bar graph representing the average surface roughness (Ra) values of evaluated resin at baseline and after 15 days of immersion in different solutions. The standard error is represented by the error bars.
-
Material Manufacturer details Type of material Matrix Filler components Filler load Omnichroma Tokuyama Dental,
Tokyo, JapanSupra-nano spherical
(average particle size of 200 nm)TEGDMA, UDMA Spherical shaped, uniformly sized supra-nano
spherical filler (260 nm spherical SiO2-ZrO2)79 wt%
(68 vol%)UDMA: Urethane dimethacrylate, TEGDMA: Triethylene glycol dimethacrylate. Table 1.
Composition of the dental composite resin material used in the study.
-
Beverages Manufacturer details Composition* Alcohol by volume (ABV) pH Beer Kingfisher Strong Beer, United Breweries Group, Bengaluru, India Water, malted barley, rice/maize, sugar, ethyl alcohol, hops and yeast 4.8% 4.1 Whisky Royal Challenge Premium Whisky, United Spirits Ltd., Bengaluru, India Demineralized water, grain-neutral spirit, malt spirit, scotch 42.8% 3.76 Artificial saliva Wet Mouth, ICPA Health Products Ltd., Mumbai, India Water, glycerin, sorbitol, propylene glycol, PEG 40 HCO, poloxamer, sodium benzoate, sodium CMC, flavour, cetylpyridinum chloride, parabens, xylitol, xanthan gum, disodium hydrogen phosphate, sodium dihydrogen phosphate 0% 7.1 * Information provided by the manufacturers. Table 2.
Specifications and composition of the evaluated solutions.
-
Beverage group Group A Group B Group C p-value Color change 1.07 ± 0.58 0.79 ± 0.43 0.75 ± 0.39 0.029* * p < 0.05 is statistically significant. Table 3.
Means ± standard deviation and p-value of color change (ΔE) values in the beverage group.
-
Beverages Beverages Mean difference Sig. Beer Whisky 0.28 0.074 Artificial saliva 0.32 0.033 Whisky Beer −0.28 0.074 Artificial saliva 0.04 0.940 Artificial saliva Beer −0.32 0.033 Whisky −0.04 0.940 Table 4.
Inter-group comparison of evaluated beverages in terms of color stability using Tukey's post hoc test.
-
Beverage groups Group A Group B Group C p Pre-immersion
(baseline)0.40 ± 0.24 0.39 ± 0.20 0.39 ± 0.23 0.978 Post-immersion
(after 15 d)0.91 ± 0.30 0.70 ± 0.32 0.55 ± 0.29 0.000* * p < 0.05 is statistically significant. Table 5.
Means ± standard deviation and p-value of surface roughness values at different immersion periods.
-
Beverages Beverages Mean difference Sig. Pre immersion Beer Whisky 0.006 0.993 Artificial saliva 0.012 0.976 Whisky Beer −0.006 0.993 Artificial saliva 0.005 0.995 Artificial saliva Beer −0.012 0.976 Whisky −0.005 0.995 Post immersion Beer Whisky 0.209 0.031 Artificial saliva 0.366 0.000 Whisky Beer −0.209 0.031 Artificial saliva 0.157 0.133 Artificial saliva Beer −0.366 0.000 Whisky −0.157 0.133 Table 6.
Inter-group comparison of evaluated beverages in terms of surface roughness using Tukey's post hoc test.
Figures
(4)
Tables
(6)