-
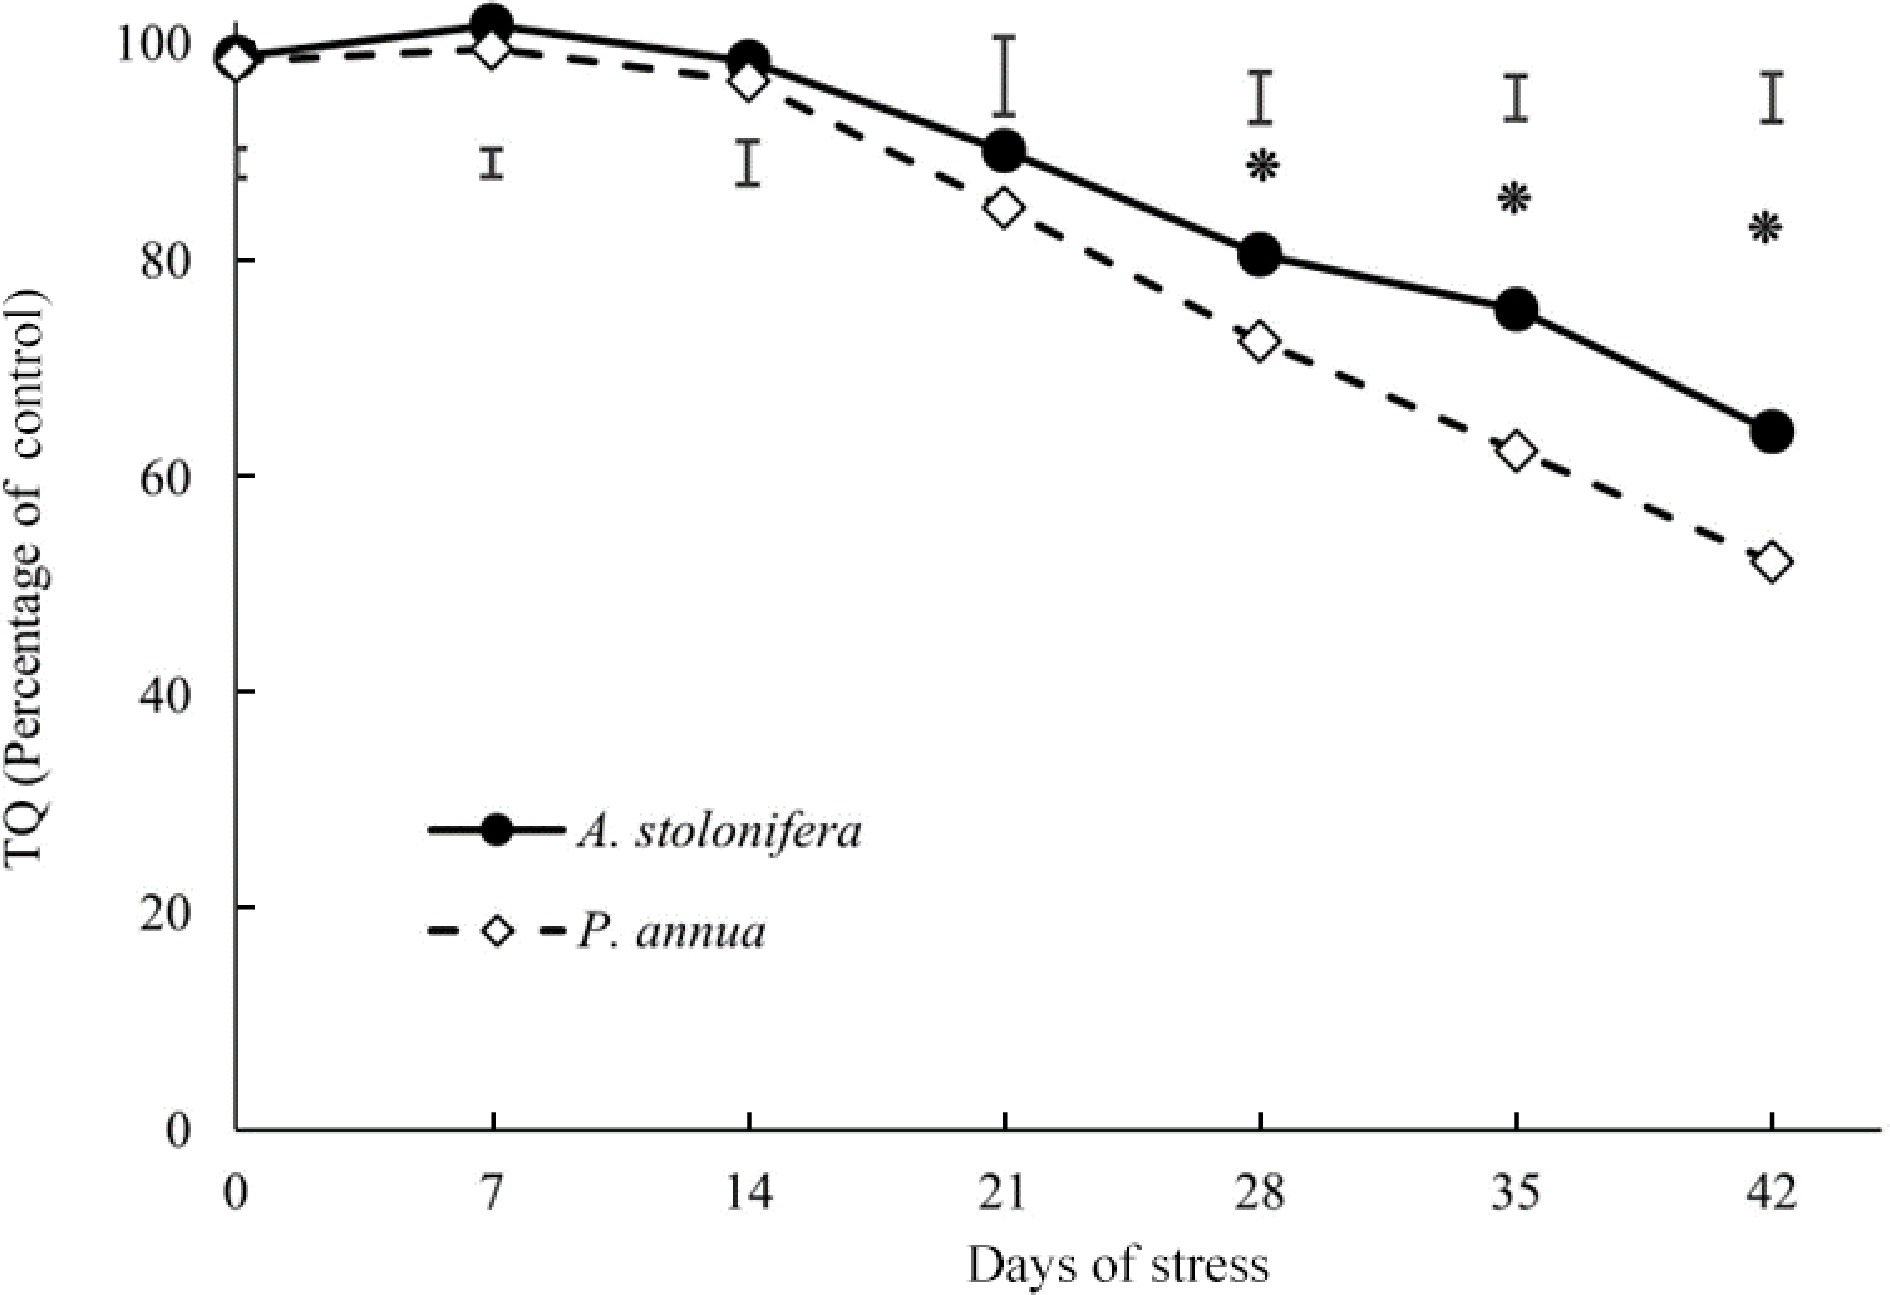
Figure 1.
Relative changes (% of control) in turf quality (TQ) of heat-stressed plants compared to the respective control plants in A. stolonifera and P. annua during 42 d of heat stress. Vertical bars indicate least significant difference (LSD) values demonstrating significant differences (*) between the two grass species (p < 0.05) at a given day of heat stress.
-
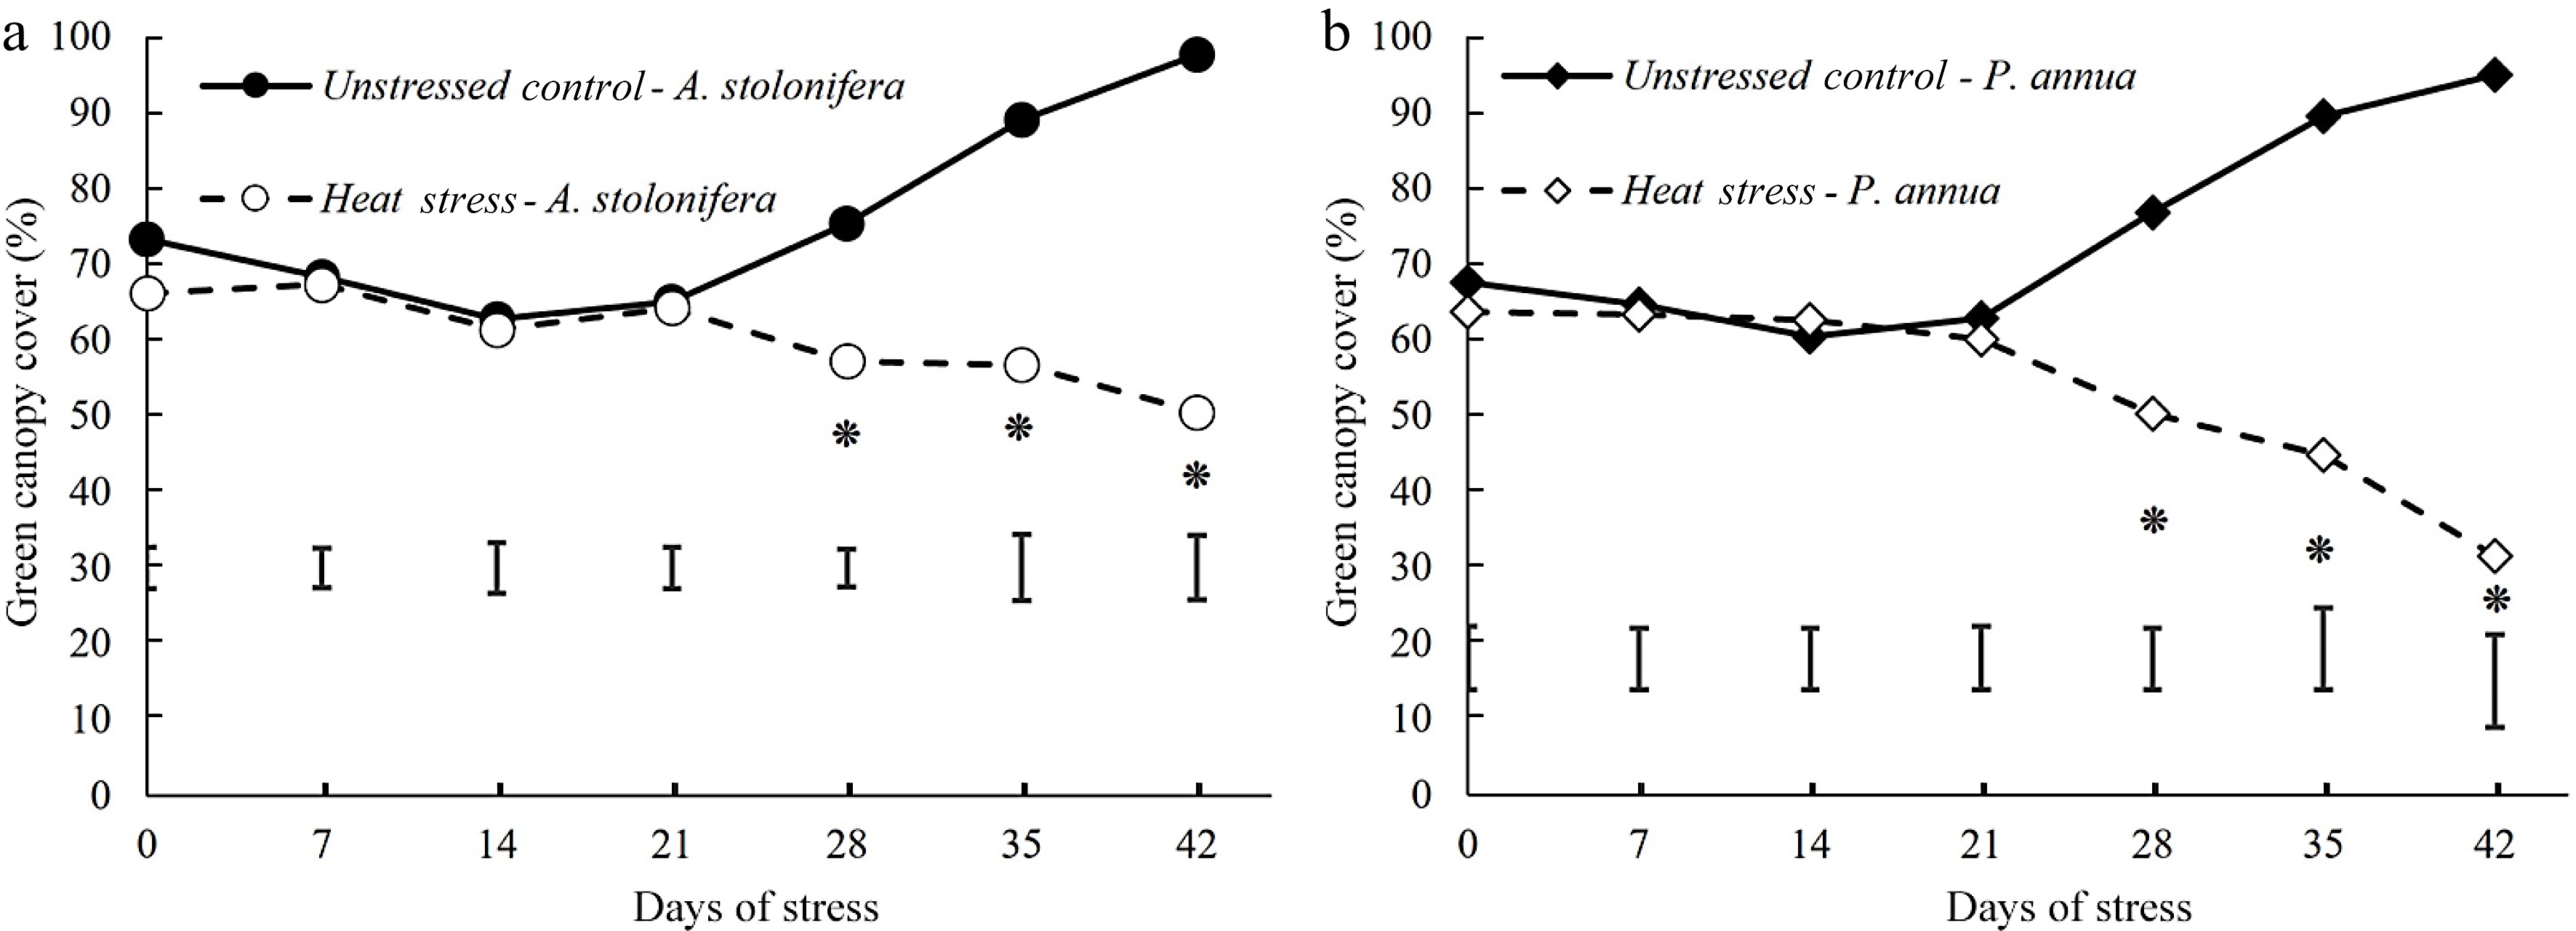
Figure 2.
Changes (%) of green canopy cover during 42 d of heat stress relative to their respective control plants for (a) A. stolonifera and (b) P. annua. Vertical bars indicate least significant difference (LSD) values demonstrating significant differences (*) between the two grass species (p < 0.05) at a given day of heat stress.
-
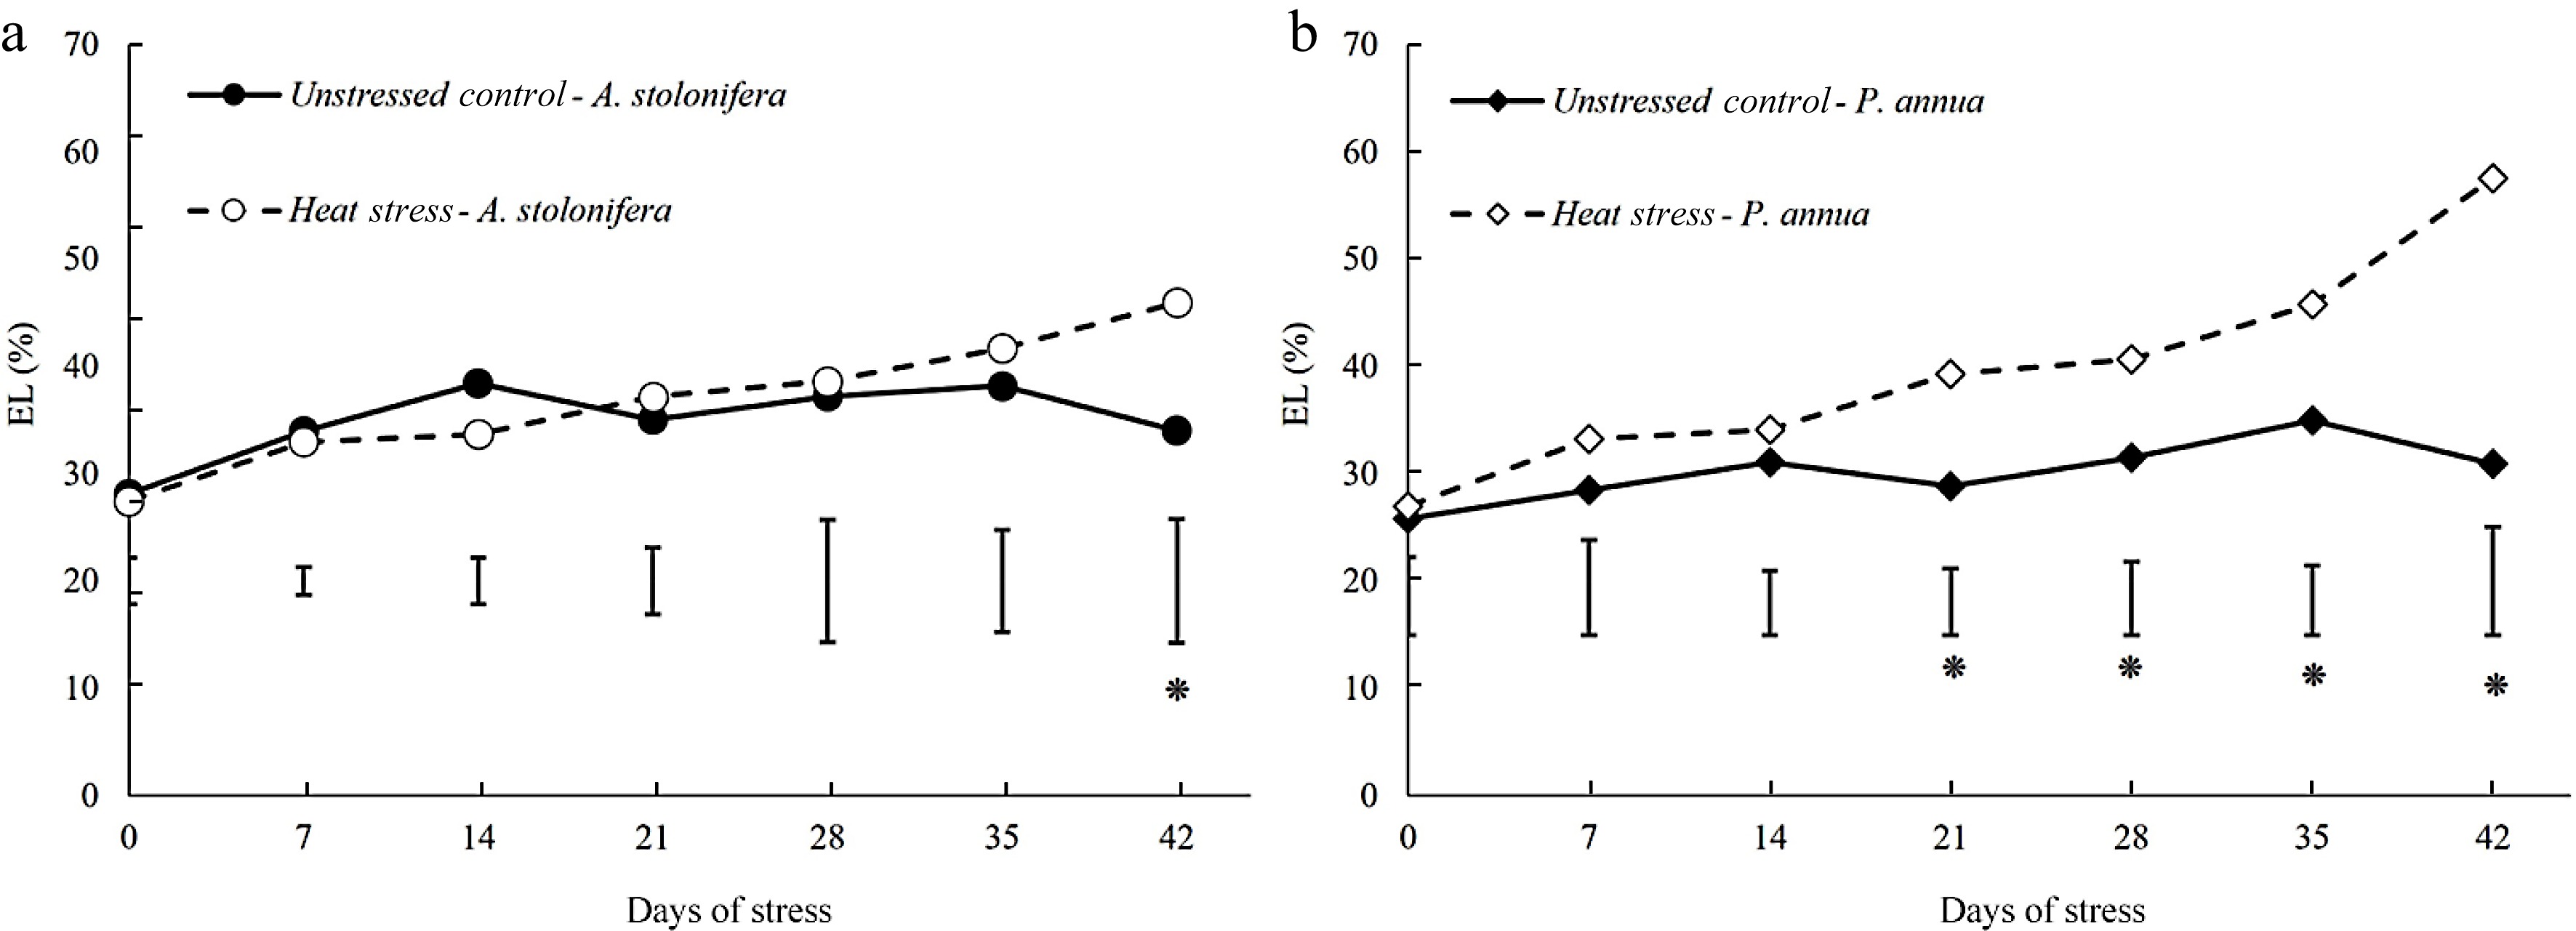
Figure 3.
Changes in electrolyte leakage (EL) during 42 d of heat stress relative to their respective control plants for (a) A. stolonifera and (b) P. annua. Vertical bars indicate least significant difference (LSD) values demonstrating significant differences (*) between the two grass species (p < 0.05) at a given day of heat stress.
-
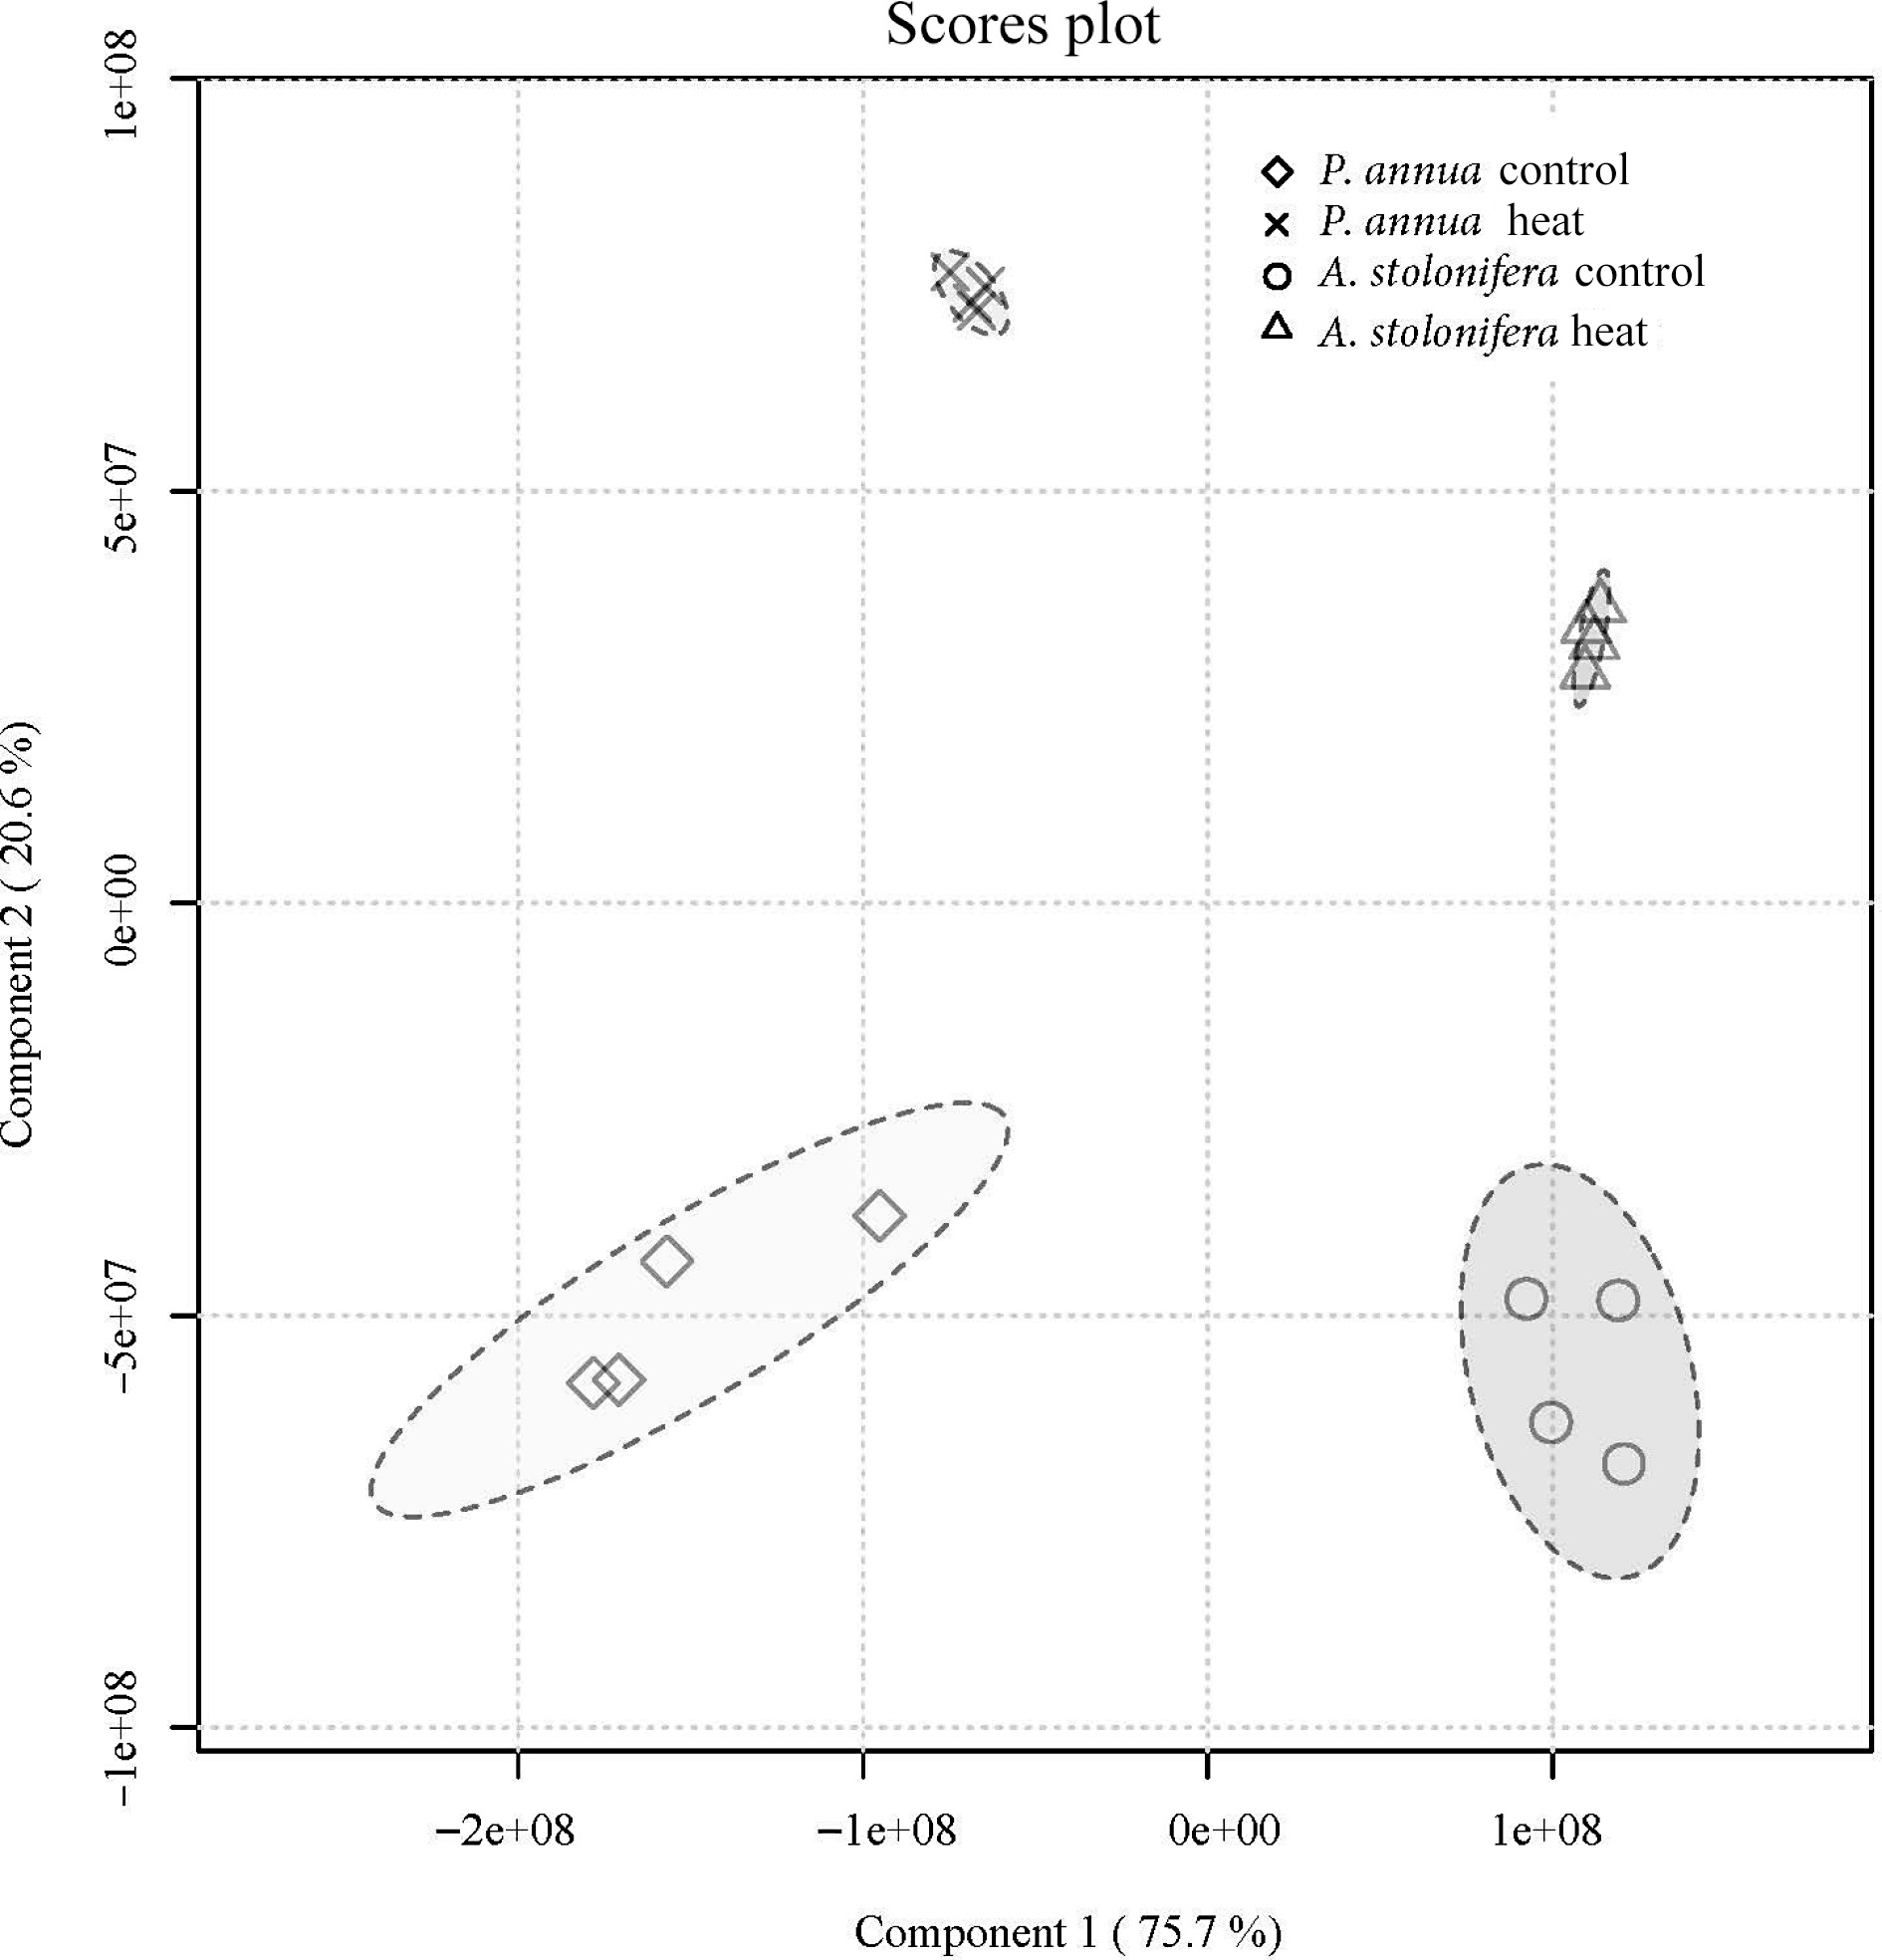
Figure 4.
Partial least-squares discriminant analysis of metabolic composition for A. stolonifera under heat stress compared to control conditions at 42 d of heat stress for P. annua.
-
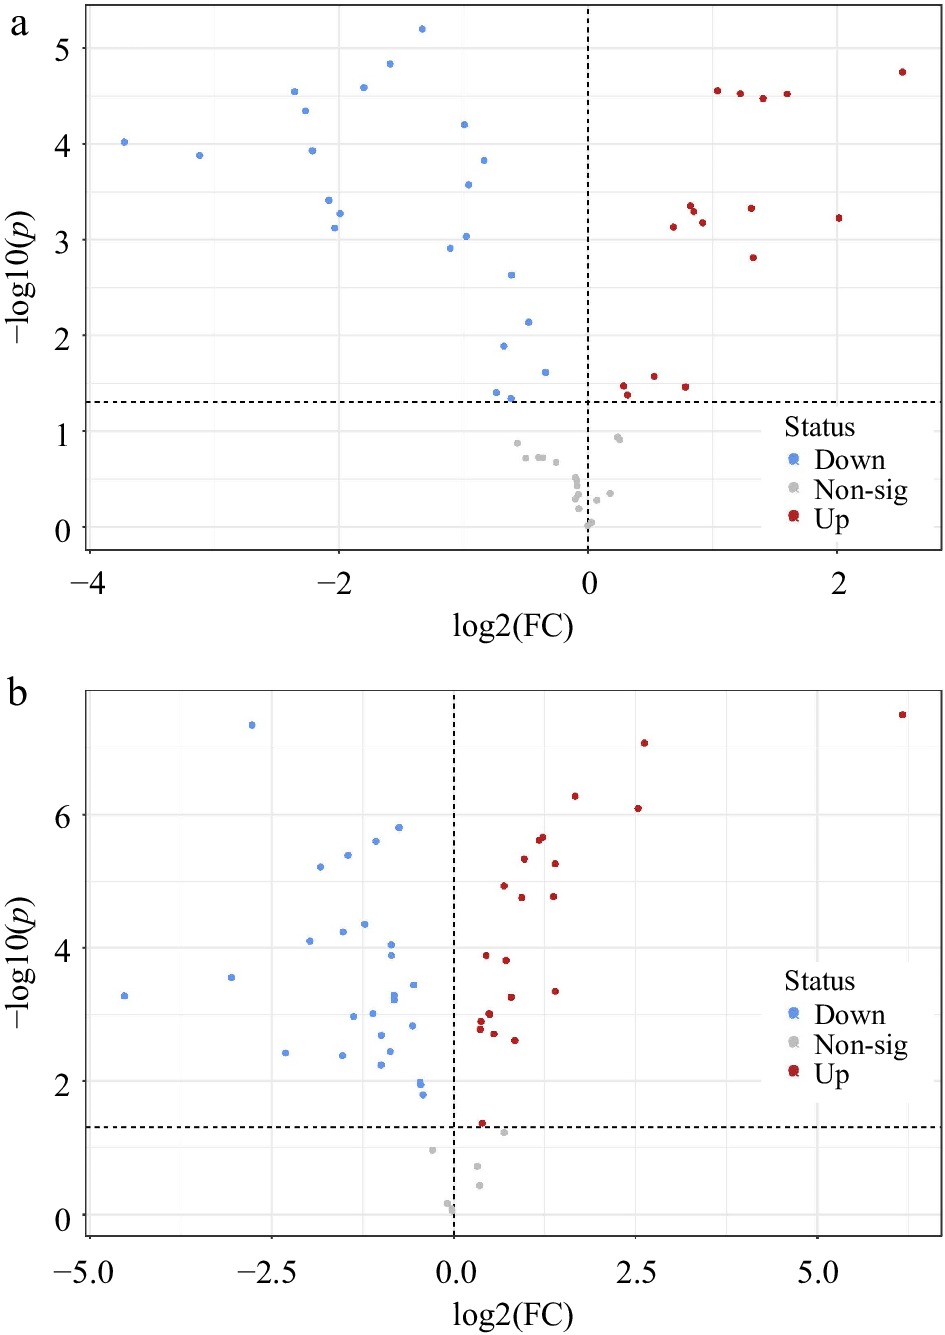
Figure 5.
Volcano plots indicating significantly different metabolites in leaf tissue at 42 d of heat stress compared to unstressed control plants of (a) A. stolonifera and (b) P. annua (p < 0.05).
-
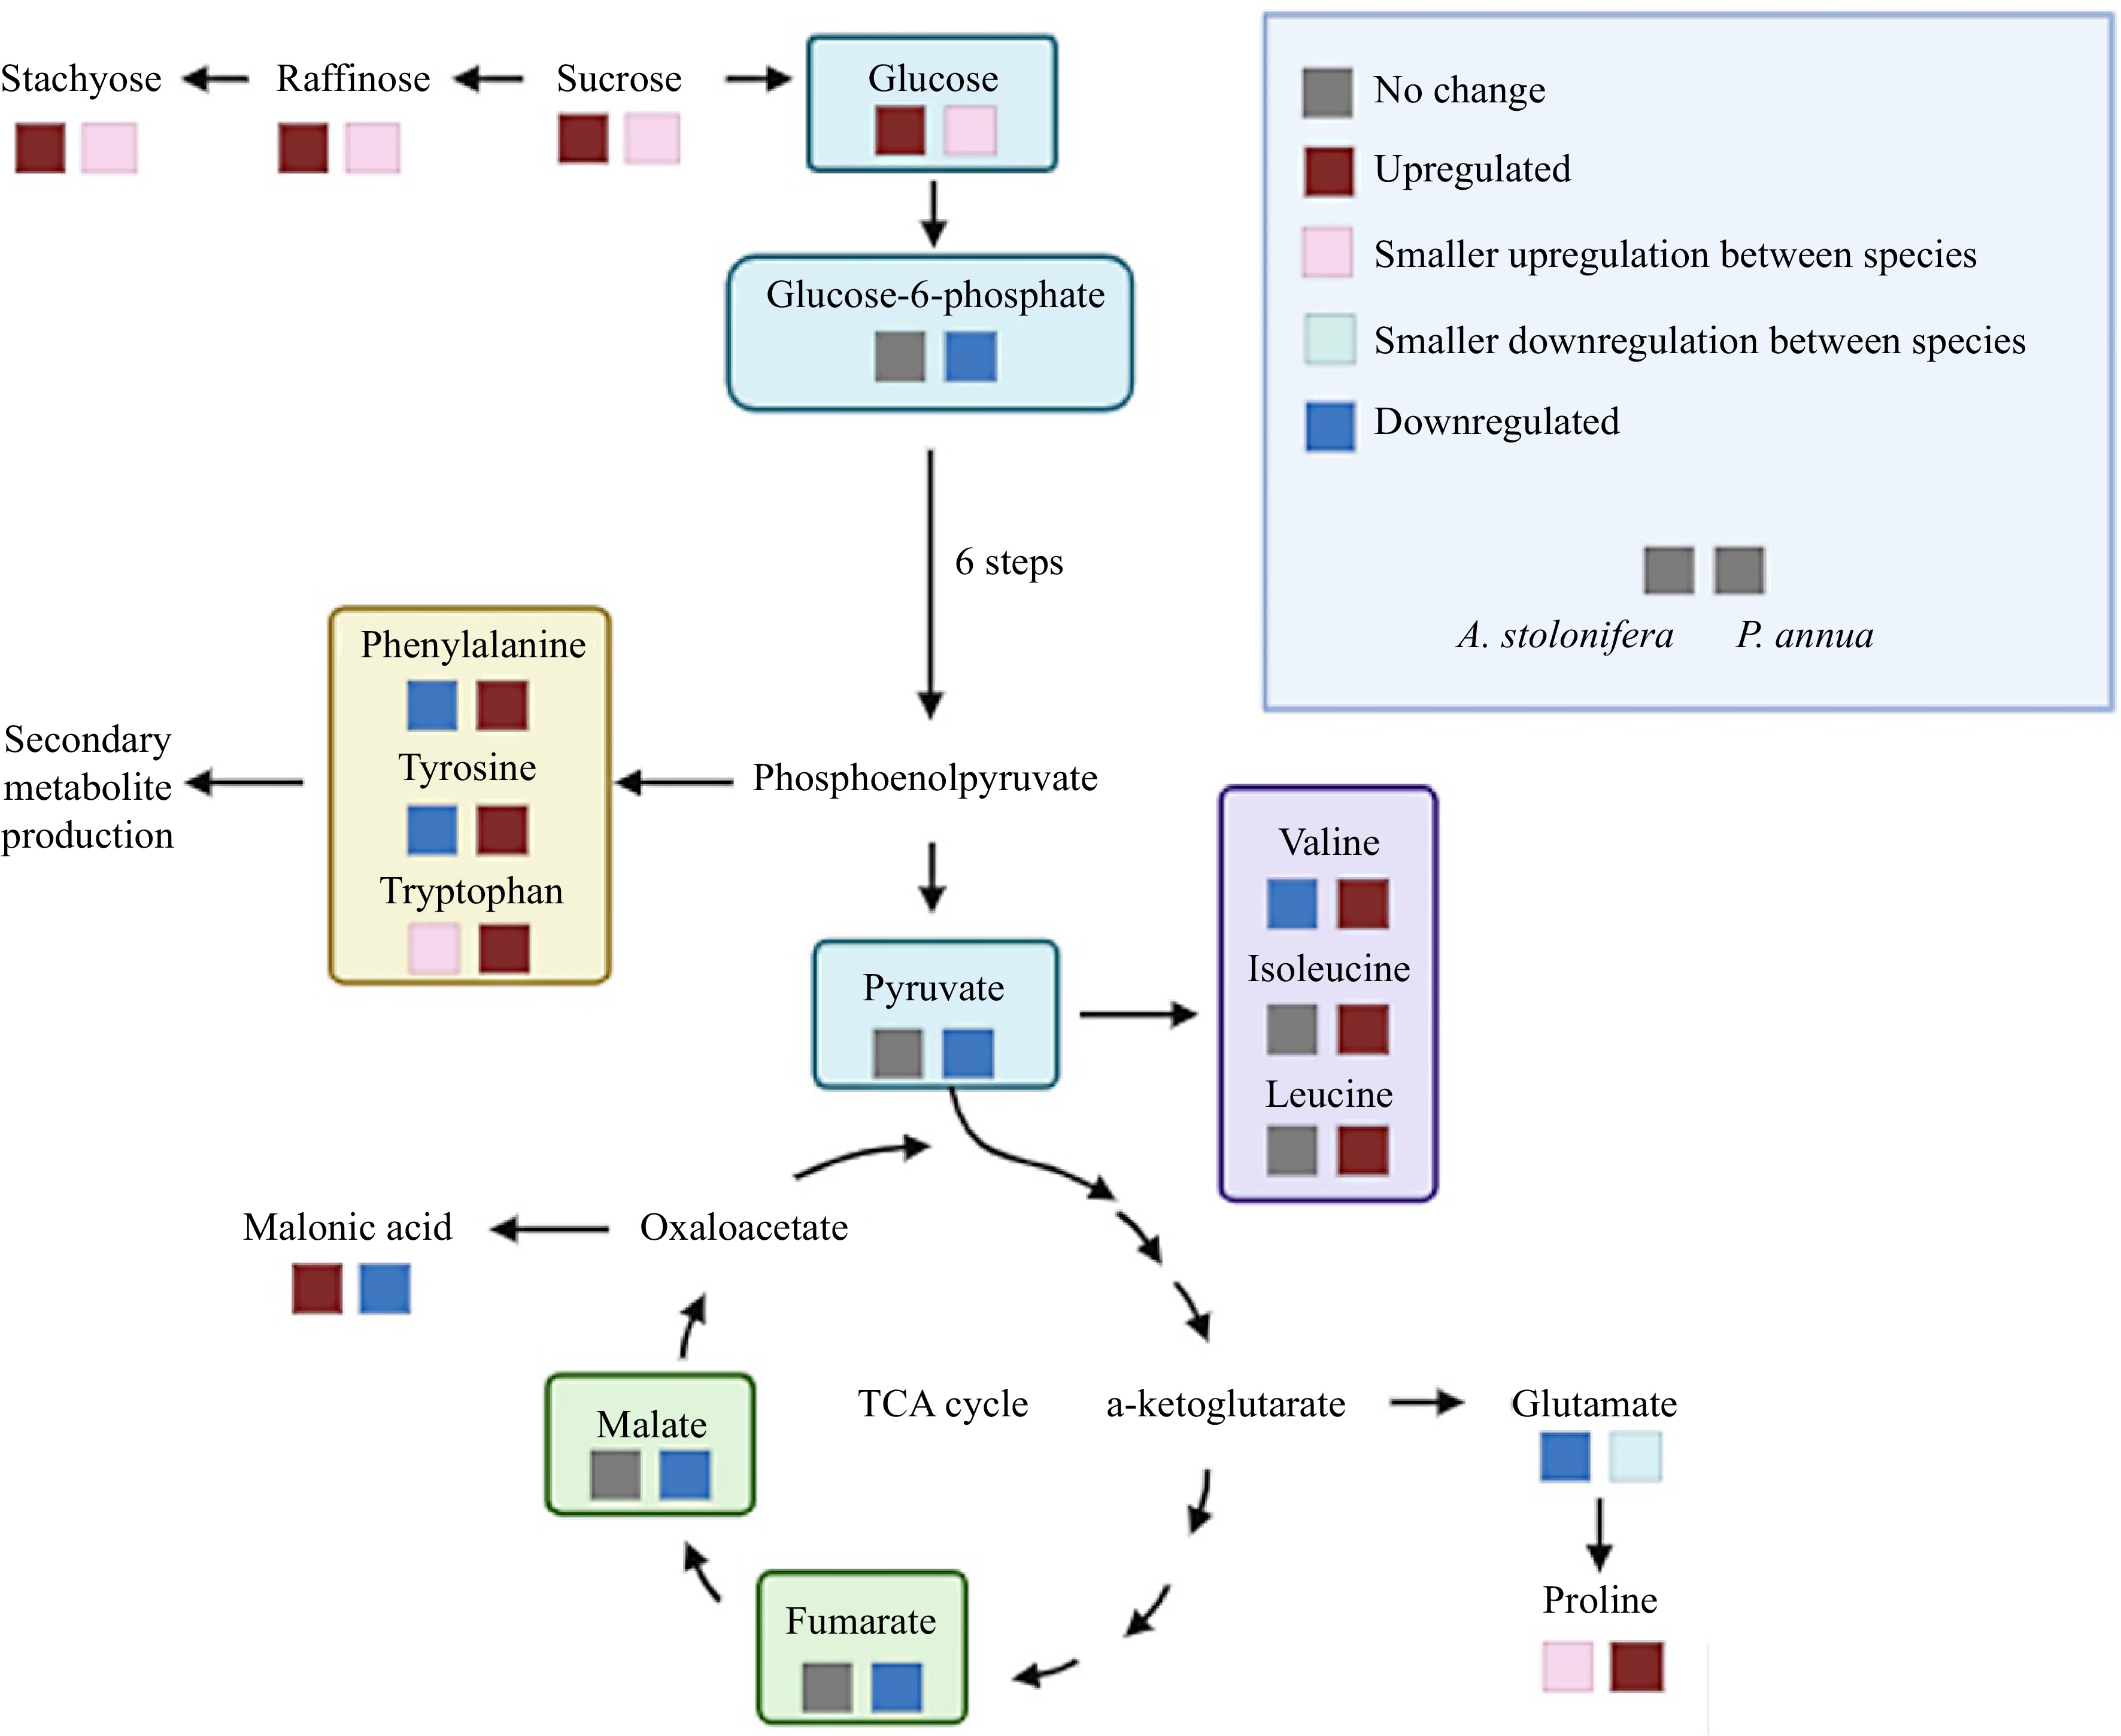
Figure 6.
Metabolic pathways illustrating metabolites differentially up-regulated (increase in content) or down-regulated (decrease in content) by heat stress in P. annua and A. stolonifera.
-
No. RT (min) Metabolite Mz No. RT (min) Metabolite Mz 1 4.93 γ-Acetamidobutyrate 144.07 29 4.42 Lactate 89.02 2 7.47 GABA 102.06 30 4.03 Leucine 130.09 3 10.79 Aconitate 173.01 31 11.04 Lysine 145.10 4 2.60 Adenine 134.05 32 9.24 Malate 133.01 5 2.72 Adenosine 266.09 33 8.82 Malonic acid 103.00 6 6.63 Alanine 88.04 34 4.66 Methionine 148.04 7 8.32 Alpha-Ketoglutarate 145.01 35 3.43 Mevalonate 147.07 8 4.75 Arabitol 151.06 36 9.88 Dinucleotide 662.10 9 7.81 Asparagine 131.05 37 3.69 Phenylalanine 164.07 10 9.05 Aspartate 132.03 38 12.14 Phosphocholine 242.08 11 11.33 Citrate 191.02 39 5.77 Proline 114.06 12 4.04 Cytidine 242.08 40 2.82 Pyruvate 87.01 13 5.15 Fructose 179.06 41 9.62 Raffinose 503.16 14 9.23 Fumarate 115.00 42 2.66 Riboflavin 375.13 15 5.88 Glucose 179.06 43 7.70 Serine 104.04 16 11.78 Glucose 6-phosphate 259.02 44 5.83 Sorbitol 181.07 17 10.81 Glucose 1-phosphate 259.02 45 11.94 Stachyose 665.21 18 8.80 Glucuronic acid 193.04 46 8.81 Succinic acid 117.02 19 8.48 Glutamate 146.05 47 7.36 Sucrose 341.11 20 8.90 Glutamine 145.06 48 5.76 Thiamine 263.10 21 6.03 Glycerate 105.02 49 6.94 Threonine 118.05 22 7.11 Glycine 74.02 50 2.06 Thymidine 241.08 23 3.44 Guanine 150.04 51 3.47 Tryptophan 203.08 24 4.28 Guanosine 282.08 52 5.17 Tyrosine 180.07 25 9.17 Histidine 154.06 53 10.56 UDP-Glucose 565.05 26 8.41 Inositol 179.06 54 2.81 Uridine 243.06 27 9.95 Isocitrate 191.02 55 5.47 Valine 116.07 28 4.45 Isoleucine 130.09 Table 1.
Mass spectrometry properties of differentially regulated metabolites by heat stress (42 d) in A. stolonifera and P. annua.
-
Metabolite class Significant metabolites A. stolonifera P. annua log2(FC) p-value log2(FC) p-value Sugar Sucrose 2.0116 0.000594 0.49699 0.00099707 Stachyose 1.5947 3E-05 1.3962 0.00045046 Raffinose 1.037 2.78E-05 0.84152 0.0024677 Glucose 0.8465 0.000509 0.55068 0.0019506 Fructose 0.31411 0.04186 0.37504 0.0012791 UDP-Glucose −0.61714 0.002339 −0.56454 0.0014869 Organic acid/carbon intermediates Glycerate −1.1096 0.00123 −1.8291 6.1183E-06 Glucose 1-phosphate NS NS −0.42047 0.015974 Glucose 6-phosphate NS NS −0.85721 0.000090569 Lactate NS NS −1.5261 0.0041586 Pyruvate NS NS −0.87007 0.0036087 Fumarate NS NS −0.81981 0.00051454 Malate NS NS −0.81785 0.000603 Aconitate NS NS −2.317 0.003775 Citrate −0.73972 0.039597 −0.45058 0.011317 Succinic acid −0.83789 0.000149 −1.1086 0.00096848 Glucuronic acid 0.81941 0.000441 0.44683 0.00013123 Malonic acid 0.68336 0.000738 −1.5208 0.000057636 NAD 1.3216 0.001537 NS NS Amino acids Phenylalanine −2.0384 0.000755 1.175 2.4601E-06 Tryptophan 0.9163 0.000664 1.3705 0.000017093 Tyrosine −0.47894 0.007285 0.48675 0.00097056 Serine −1.8034 2.56E-05 −1.2194 0.000044349 Threonine −2.0837 0.000386 −1.9735 0.000079449 Asparagine −3.7262 9.53E-05 −4.5243 0.00052899 Glutamine −1.9935 0.000535 −0.9921 0.0020488 Aspartate −3.1222 0.000131 −3.0542 0.00027844 Glutamate −2.2705 4.5E-05 −1.4502 4.1223E-06 Lysine 0.28221 0.03375 0.36616 0.0016675 Histidine NS NS 0.39498 0.042833 Alanine −0.96231 0.000266 −0.85354 0.00013055 Valine −0.34439 0.024368 0.69188 0.000011814 Isoleucine NS NS 1.2272 0.000002184 Leucine NS NS 0.97381 4.6598E-06 Glycine −0.98193 0.000923 −0.99736 0.0056936 Proline 0.78009 0.034569 2.6224 8.5101E-08 Nucleic acids Thymidine 2.5231 1.77E-05 6.1698 3.1863E-08 Guanine 1.2196 2.98E-05 0.71981 0.00015414 Adenosine −0.62274 0.045692 0.93481 0.000017701 Guanosine −1.3337 6.29E-06 −1.3762 0.0010679 Uridine −1.5916 1.45E-05 −1.0659 2.5287E-06 Adenine −2.3584 2.82E-05 −2.7694 4.5431E-08 Cytidine −0.99572 6.27E-05 −0.54768 0.00036086 'NS' denotes metabolites that had no significant change in concentration between heat-stressed and non-stressed control plants. Table 2.
Relative content of notable metabolites in heat-stressed plants (42 d) compared to control levels expressed as log2(fold-change (FC)) in A. stolonifera and P. annua (p < 0.05).
Figures
(6)
Tables
(2)