-
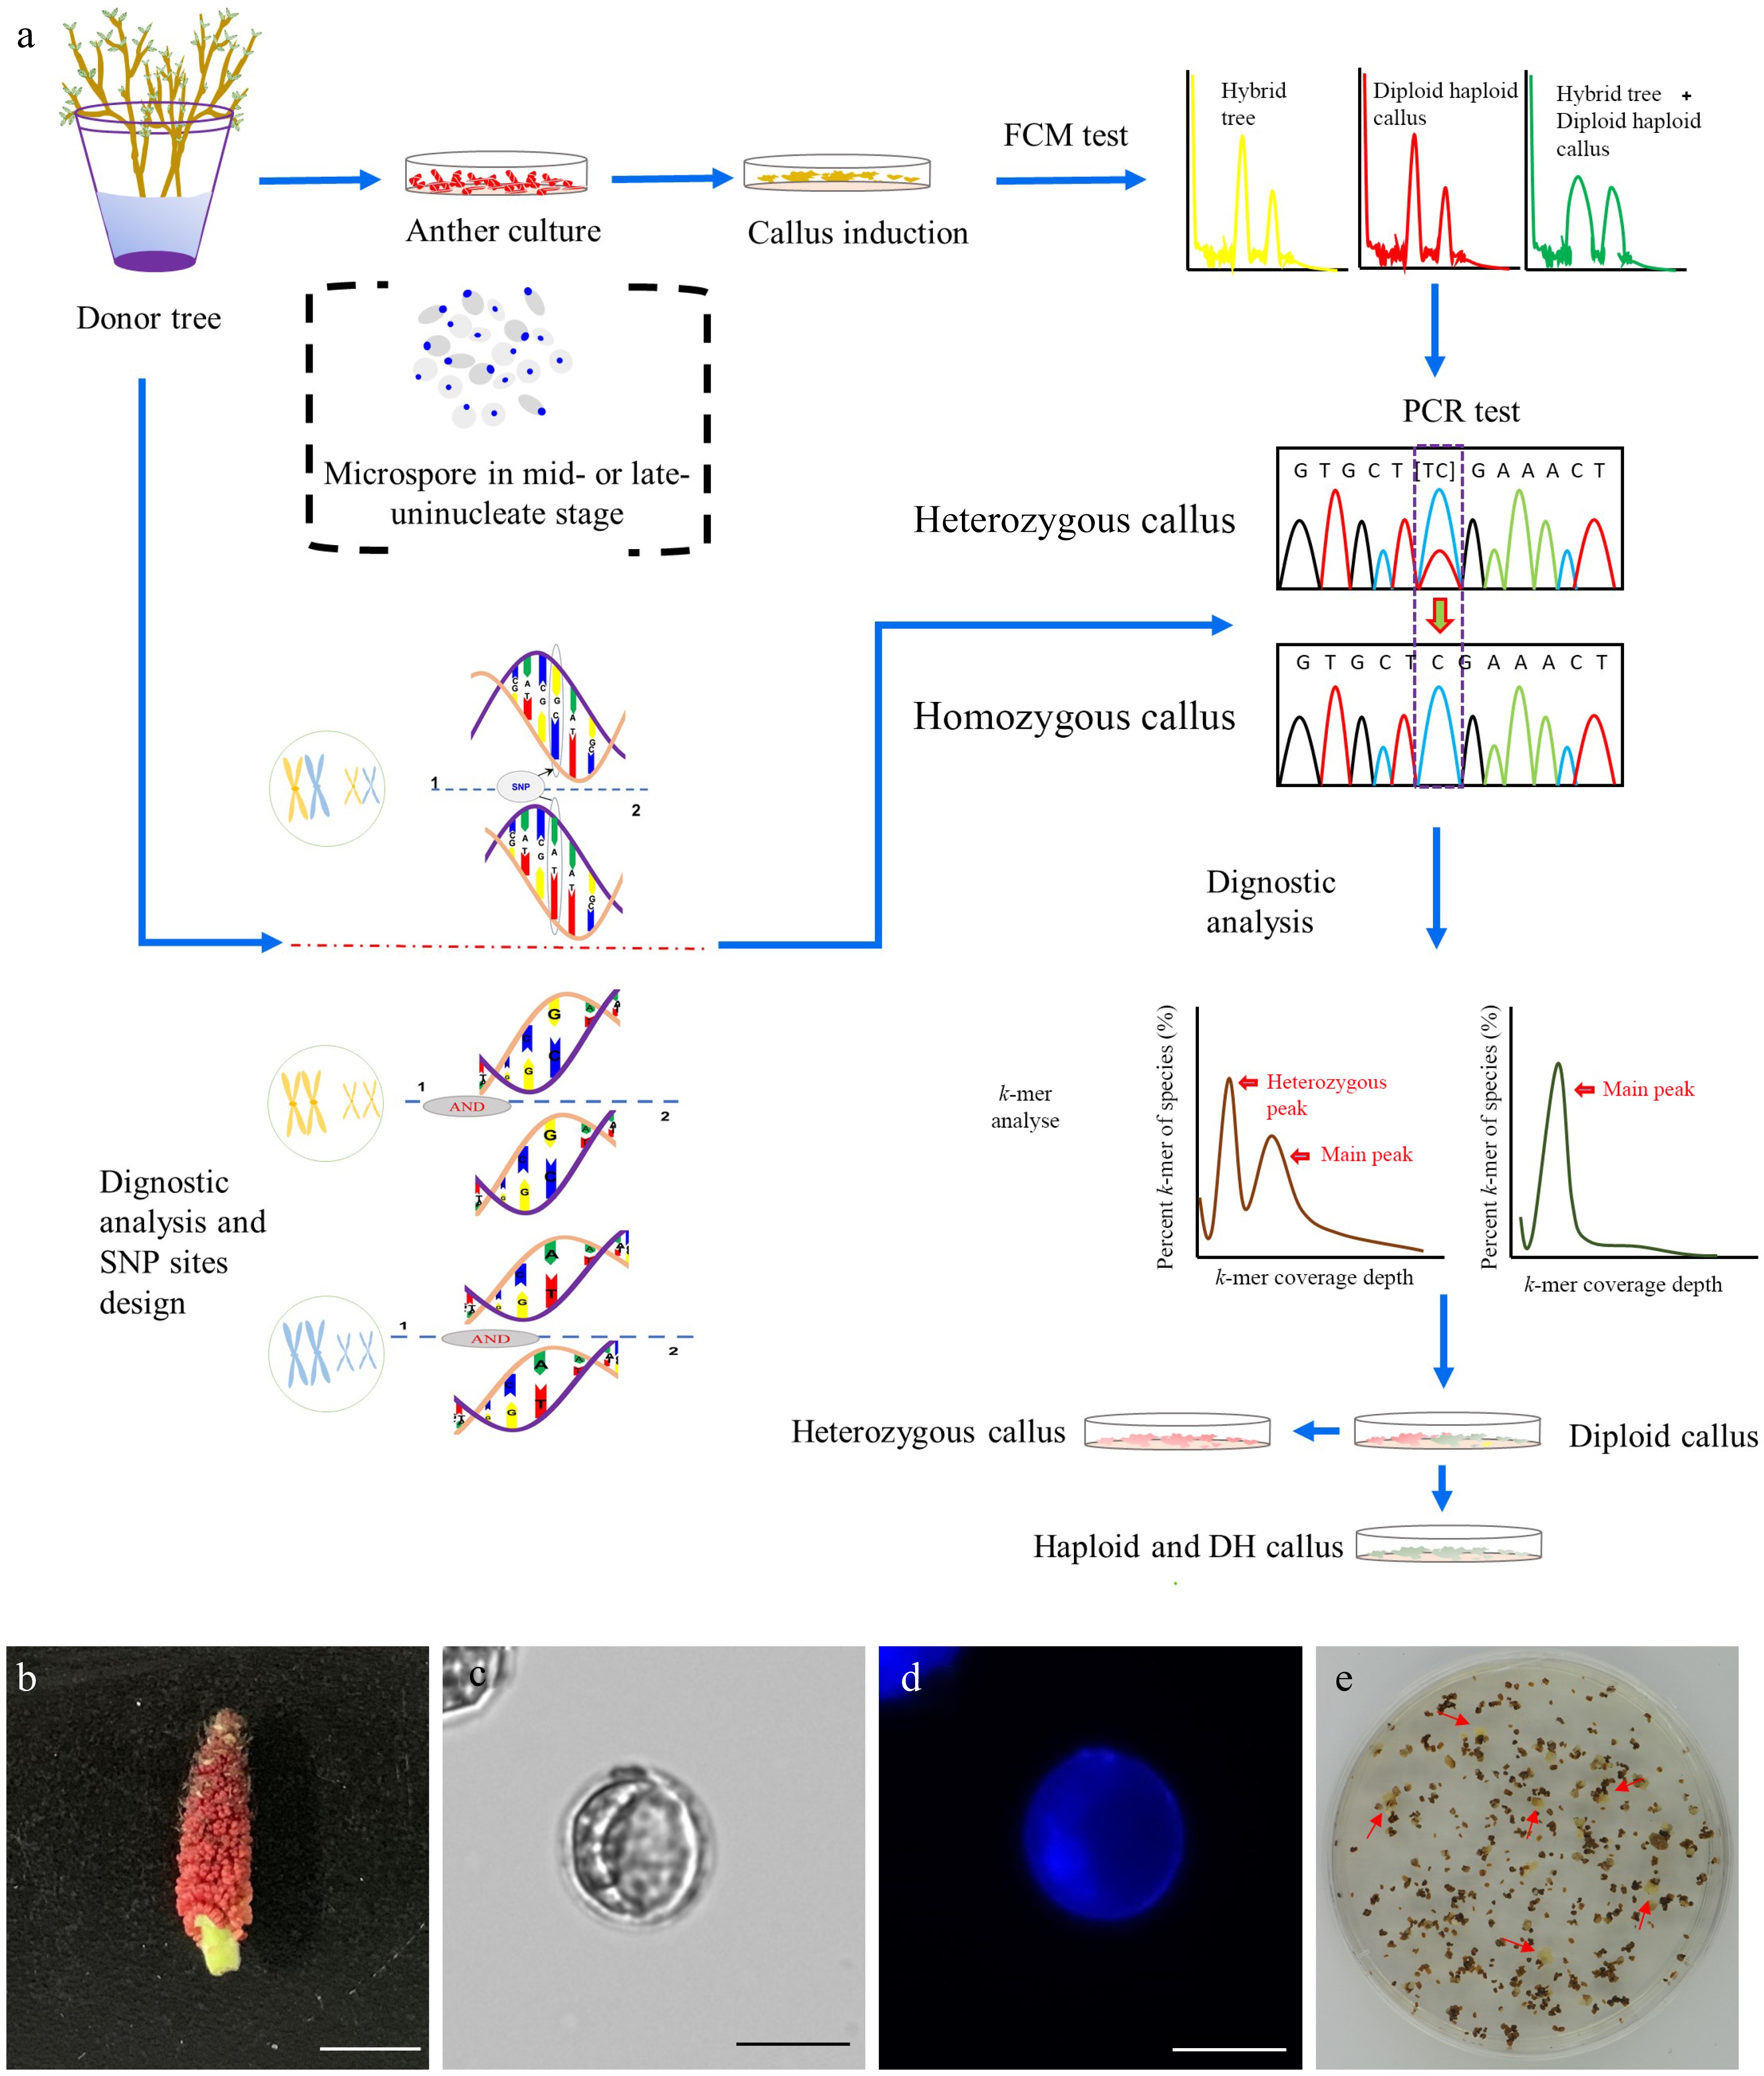
Figure 1.
Induction of doubled haploid (DH) callus lines. (a) Flowchart illustrating the procedure of the DH callus induction and characterization. (b) Floral stage of male catkin used for anther culture. Bar = 1 cm. (c) Mid-to-late uninucleate microspores (unstaining). Bar = 25 μm. (d) DAPI staining of mid-to-late uninucleate microspores. Bar = 25 μm. (e) Callui induced from the anthers that were cultured on the callus induction medium.
-
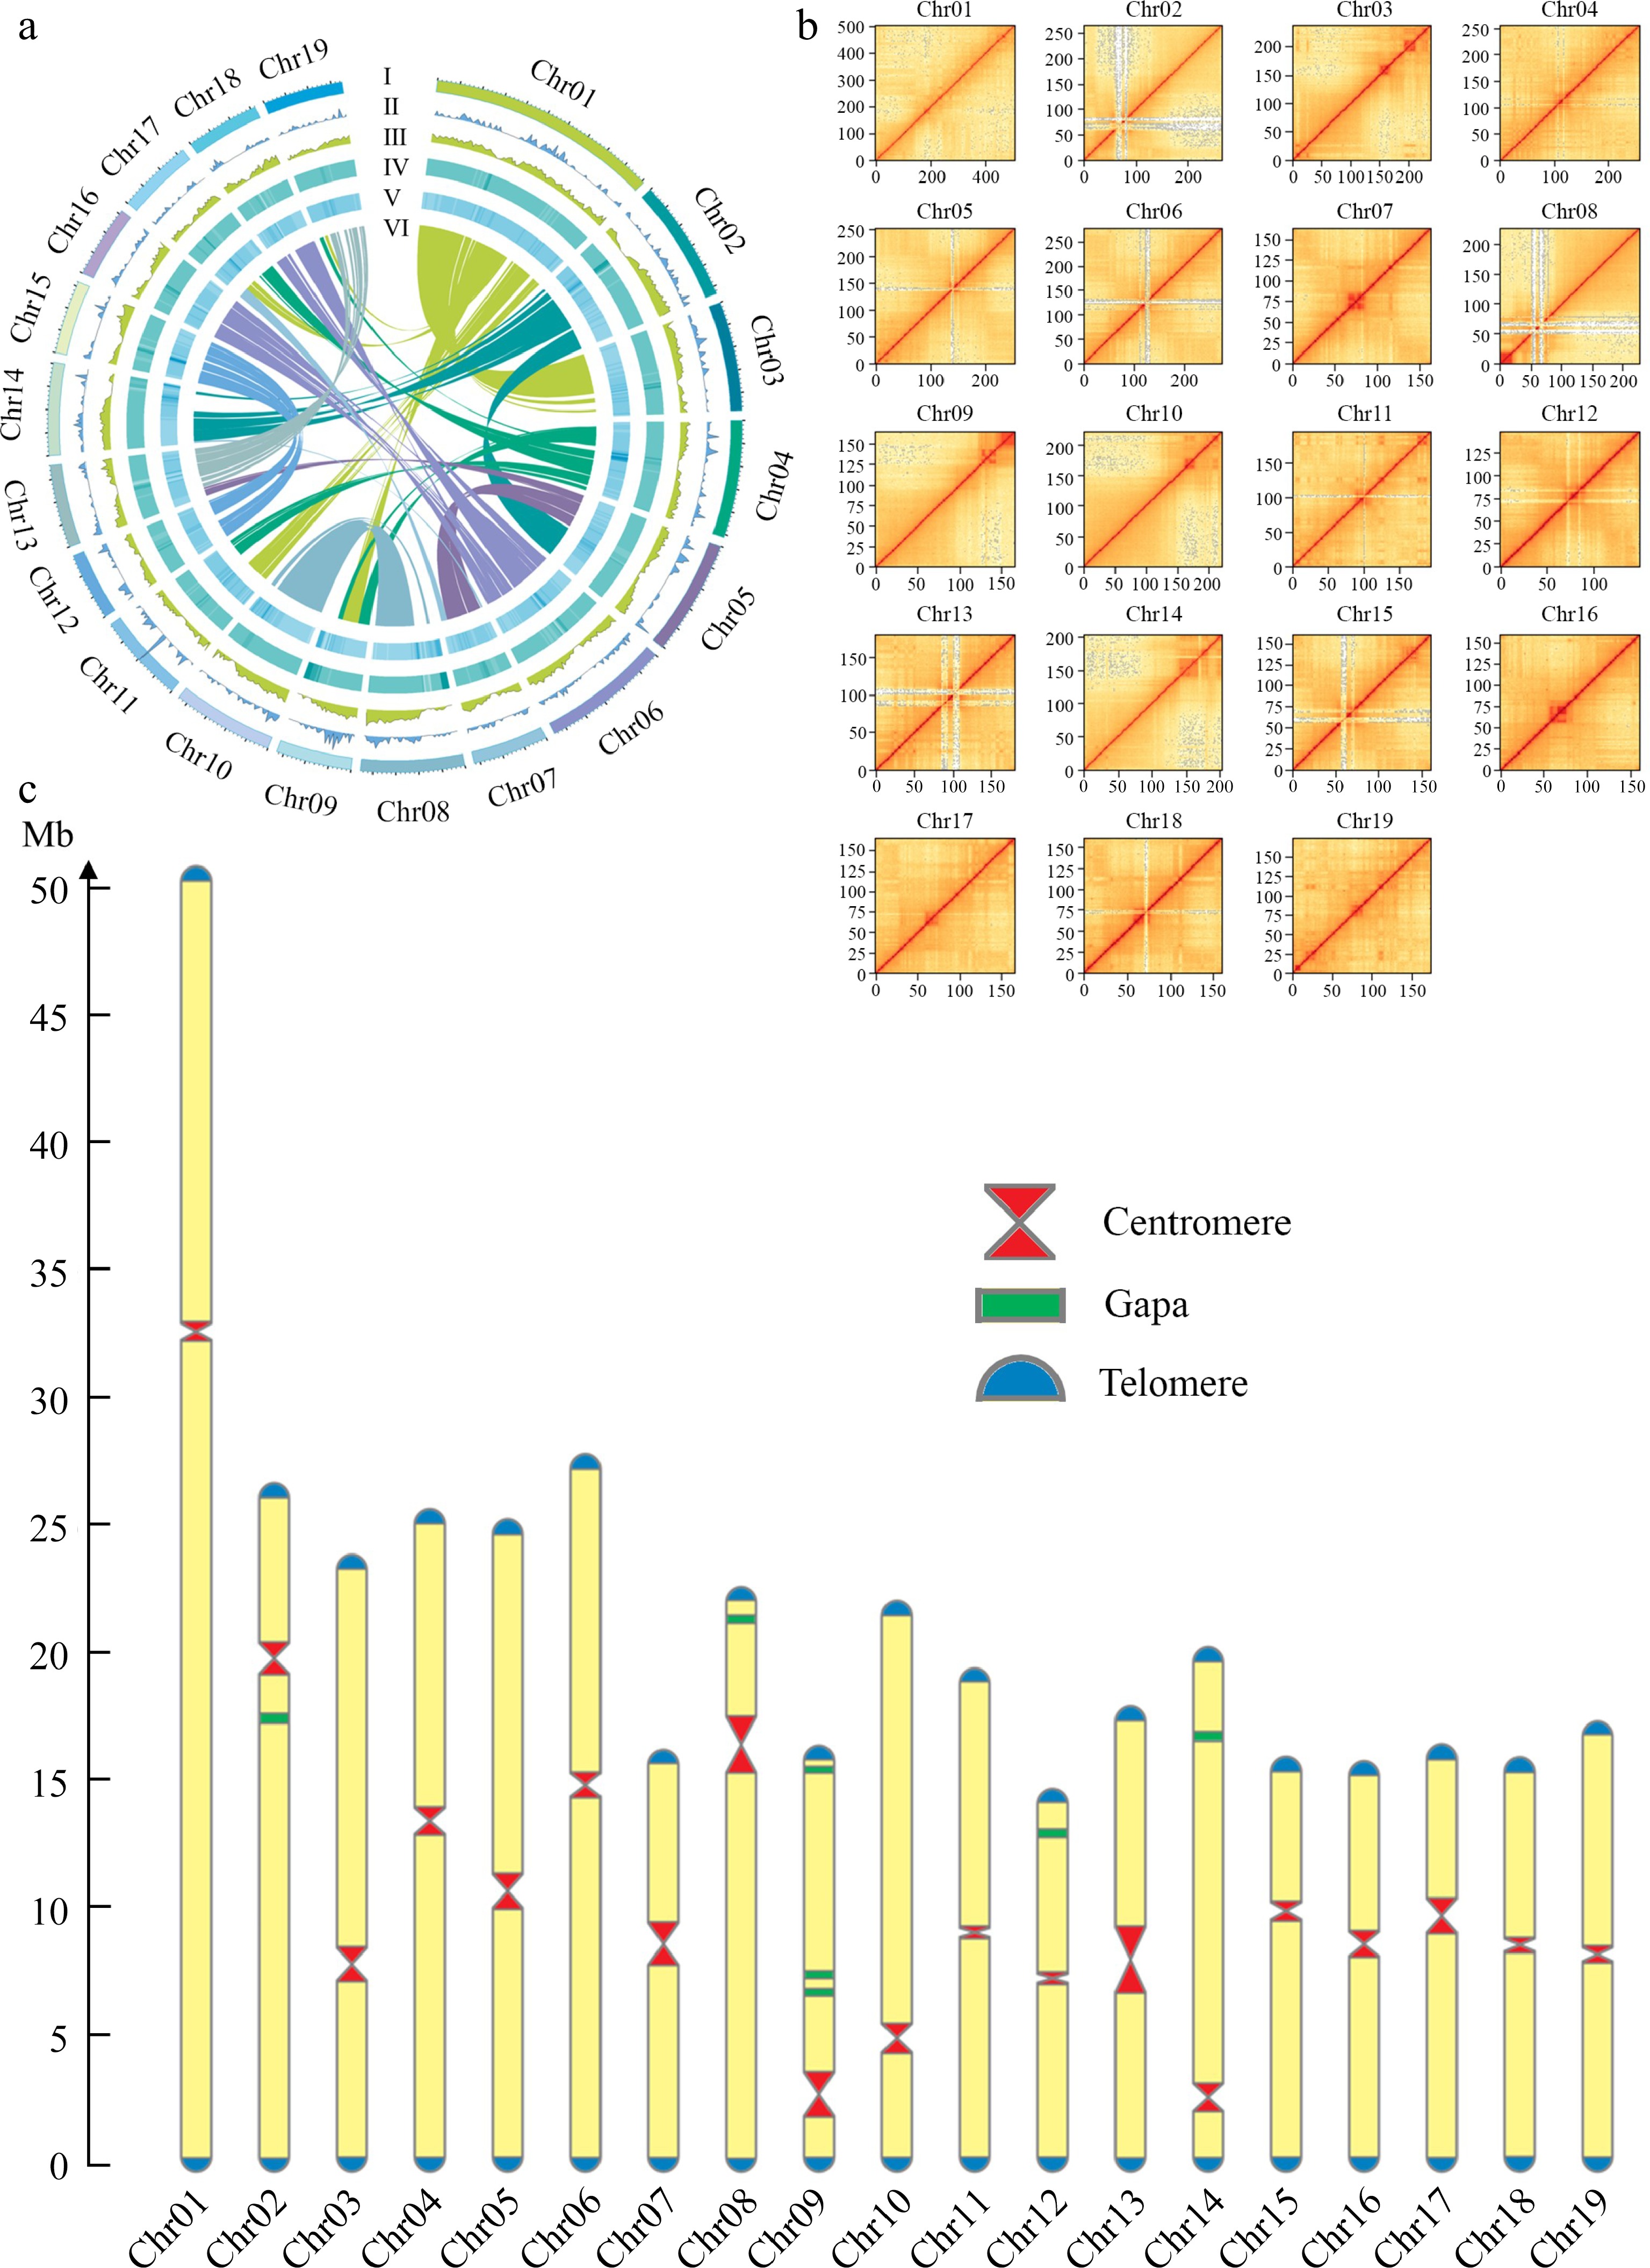
Figure 2.
Chromosomal features of the DH15 genome. (a) Circus diagram of P. ussuriensis DH15 genome. Genome elements are shown in the following scheme (from outer to inner). (I) Chromosome karyotype analysis; (II) Distribution of tRNA (window size, 500 kb); (III) Gene density (window size, 500 kb). (IV) Distribution of GC content (window size, 500 kb); (V) Distribution of transposable element (TE); (VI) Syntenic relationships among different chromosomes of P. ussuriensis. (b) Hi-C interaction heatmap based on the chromosome-scale assembly. The map represents the contact matrices generated by aligning the Hi-C data to the chromosome-scale assembly. Heatmap shows Hi-C interactions under the resolution of 100 kb. (c) Visualization of telomeres, centromeres, and gaps position on chromosomes of P. ussuriensis.
-
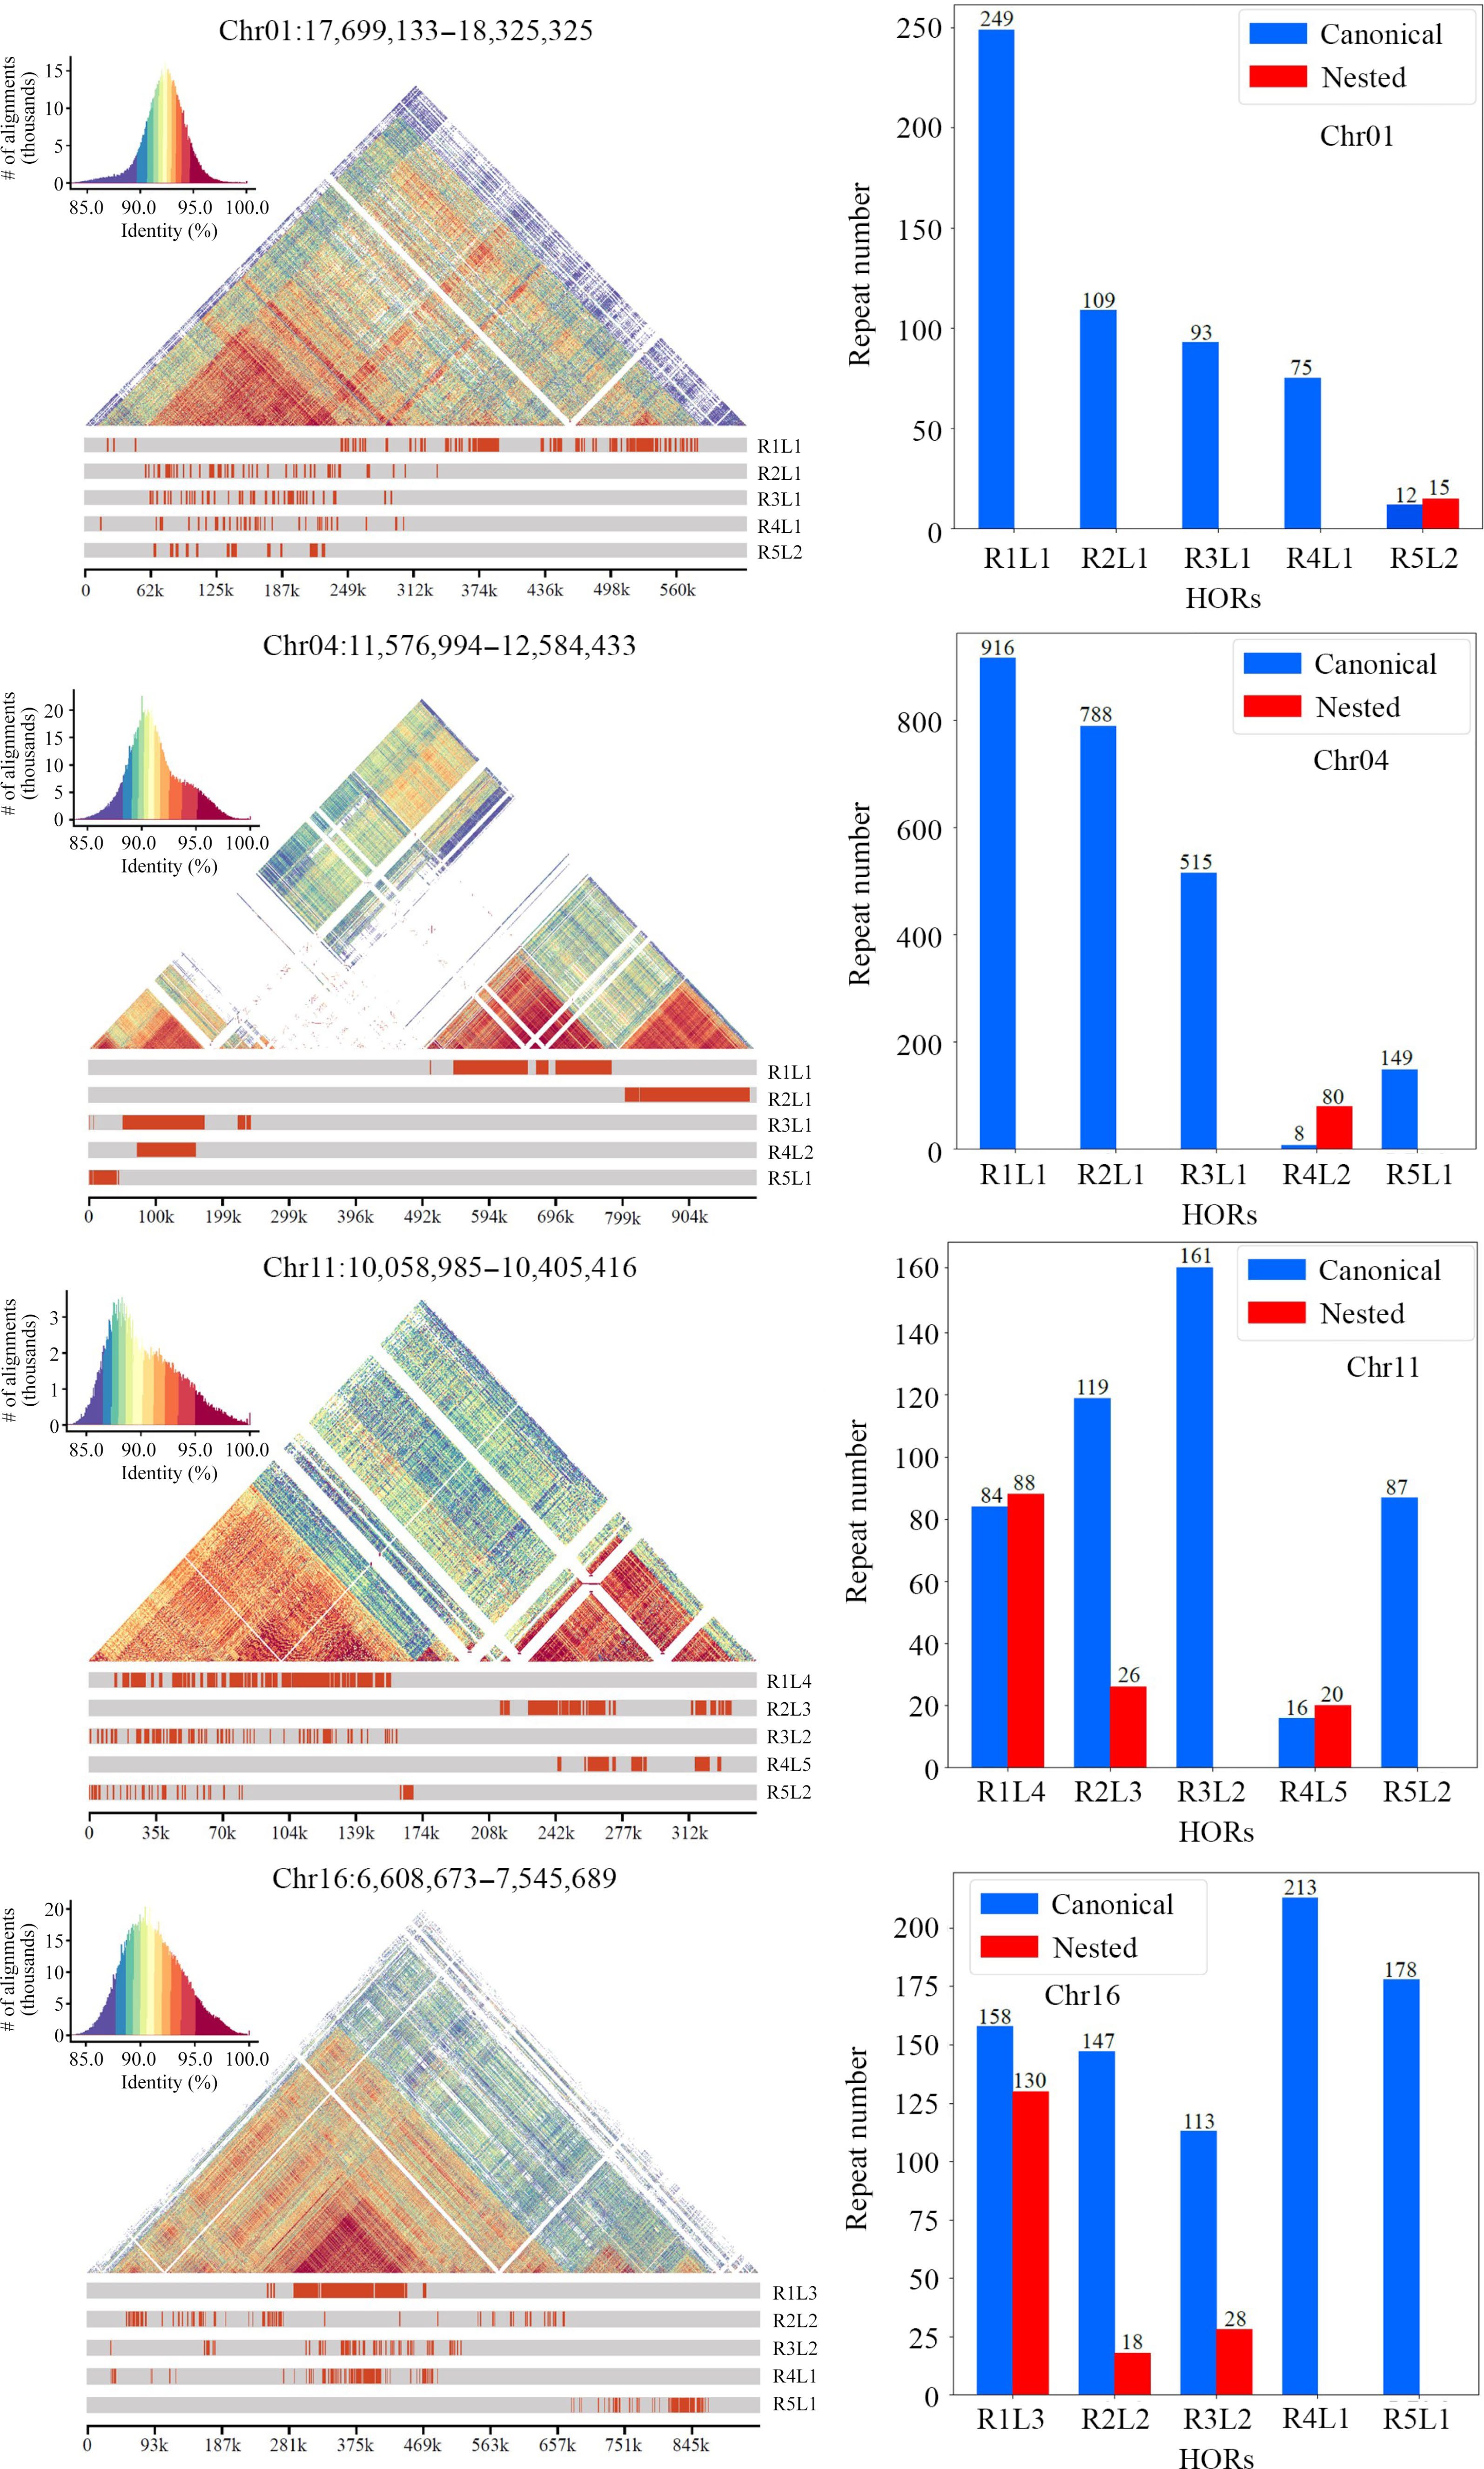
Figure 3.
Number and distribution of each type of higher-order repeats (HORs) present in the centromere of each chromosome in the DH15 genome. Each type of HOR was denoted as 'R + rank of a HOR in the monomer pattern + L + the type of HOR units in a centromere'.
-
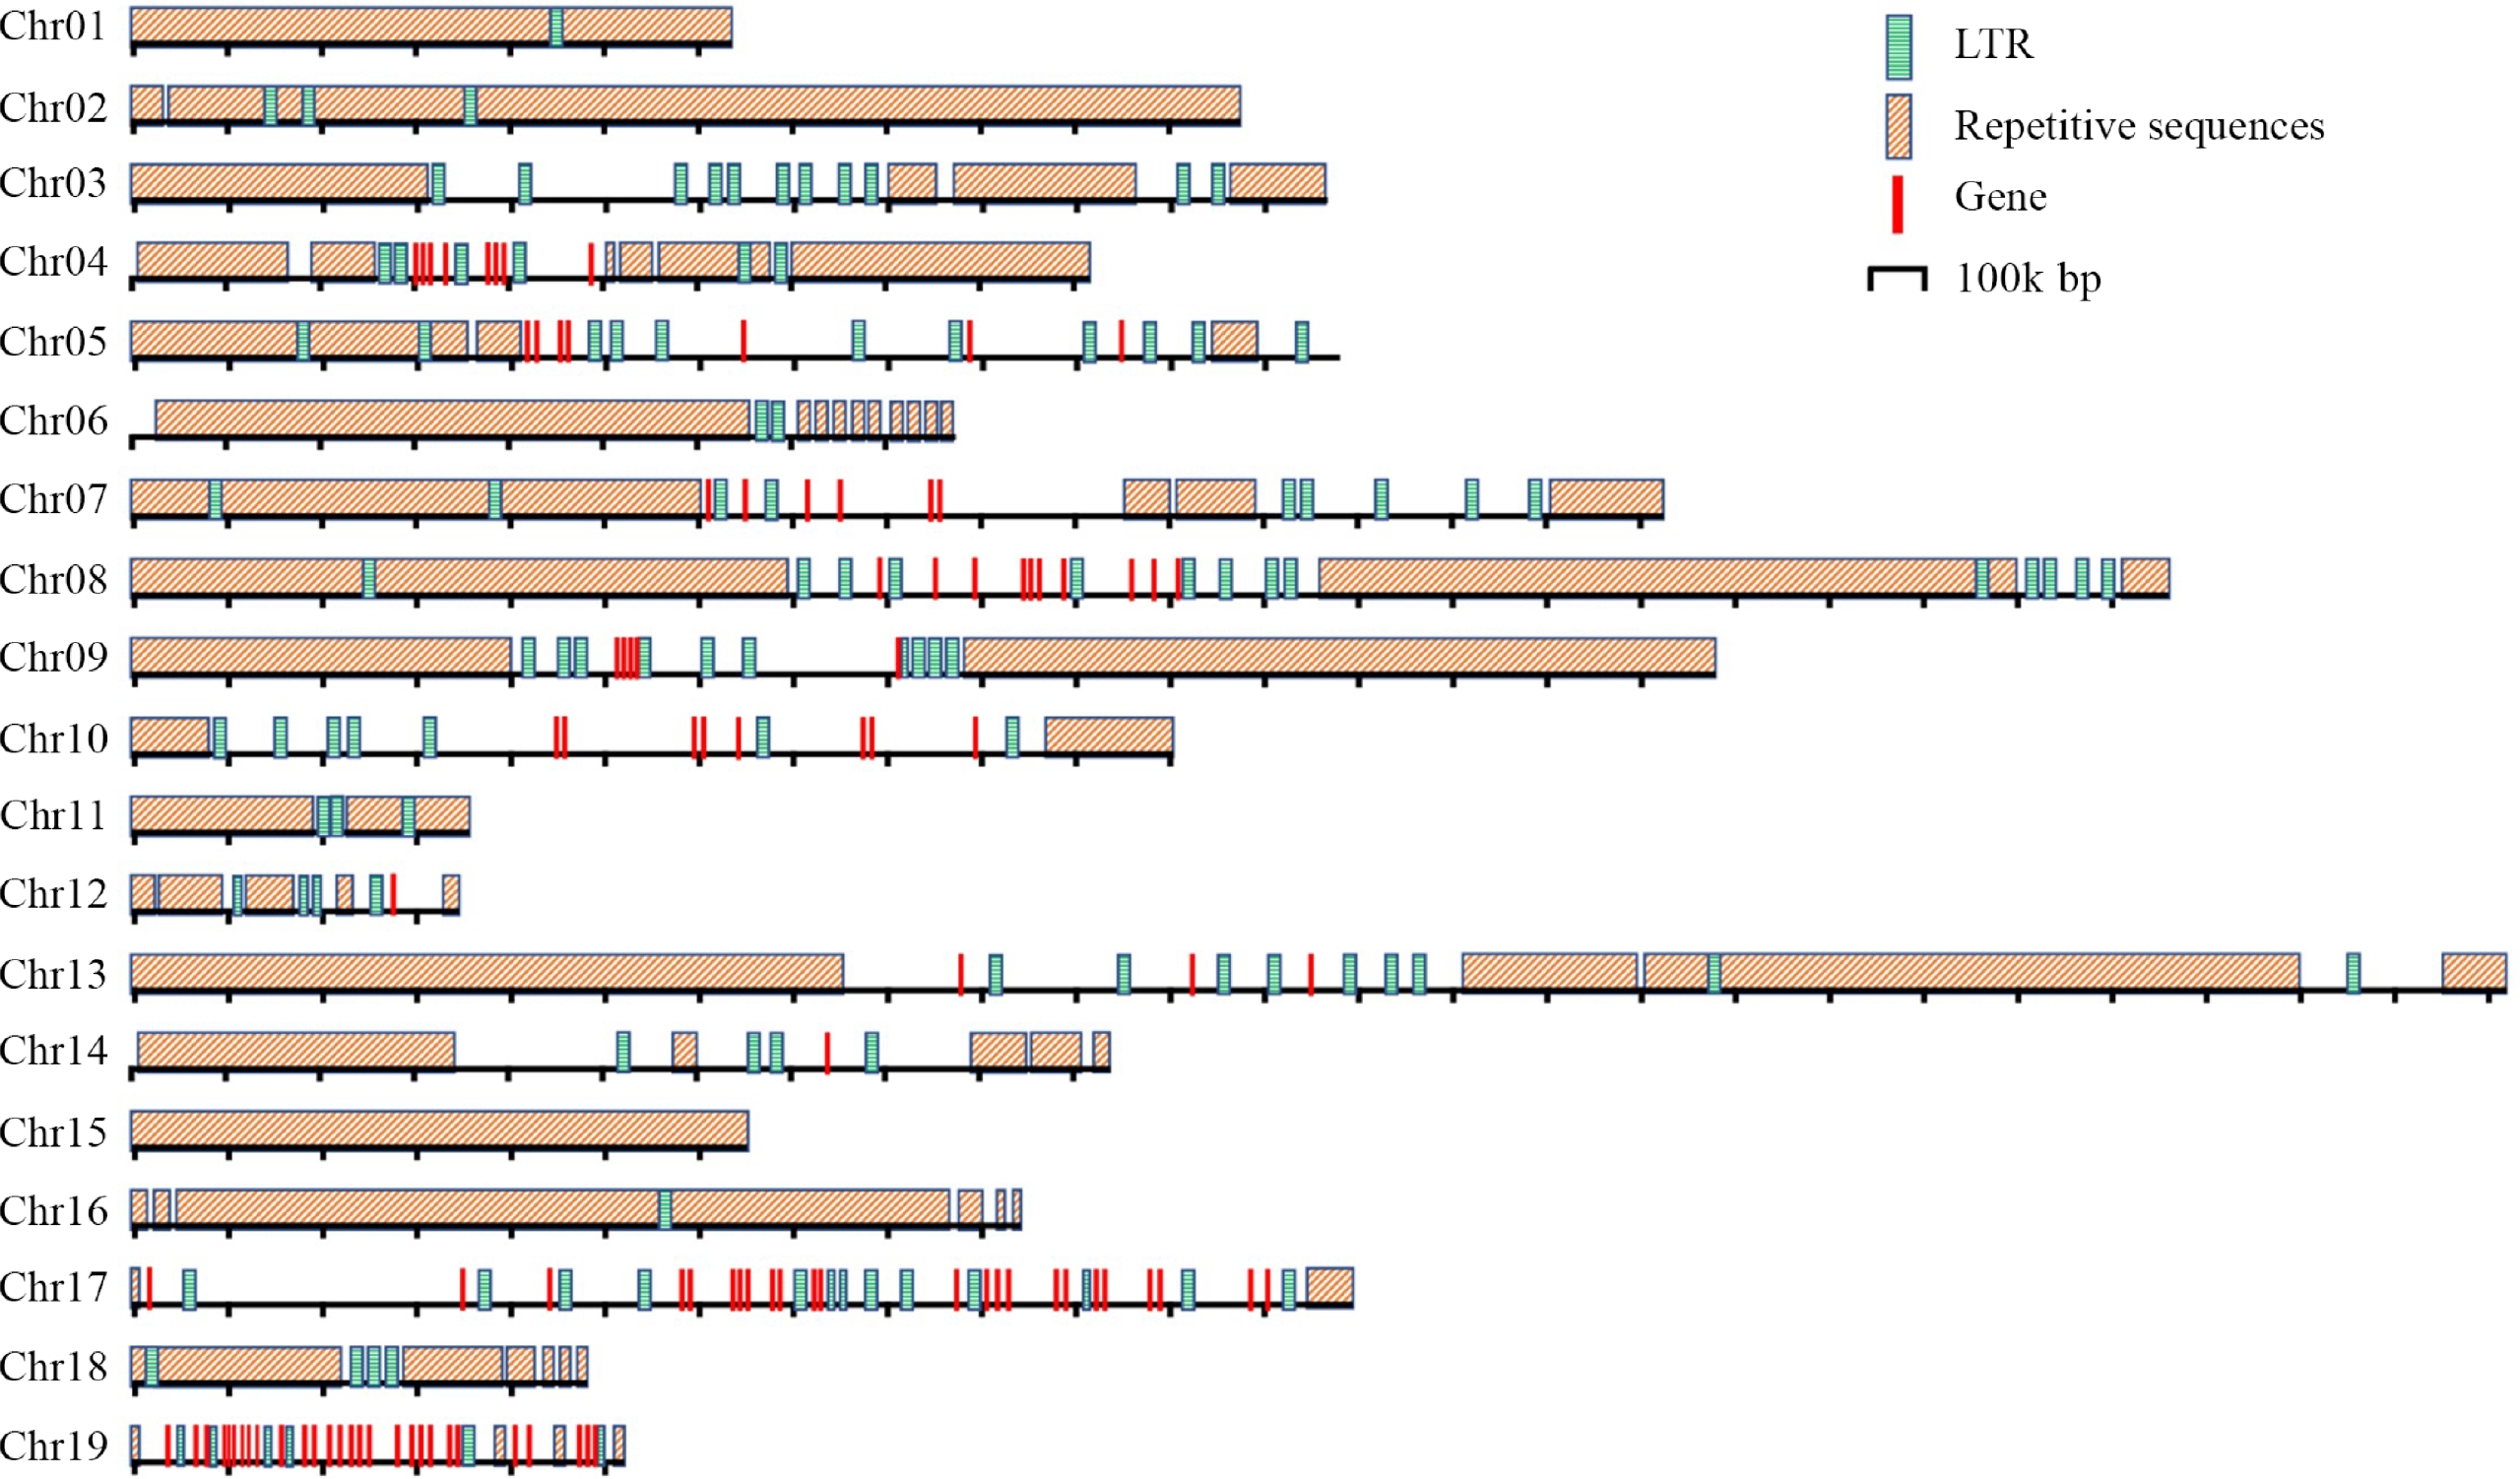
Figure 4.
Distribution of the repetitive sequences, genes and LTRs in the centromeres of P. ussuriensis.
-
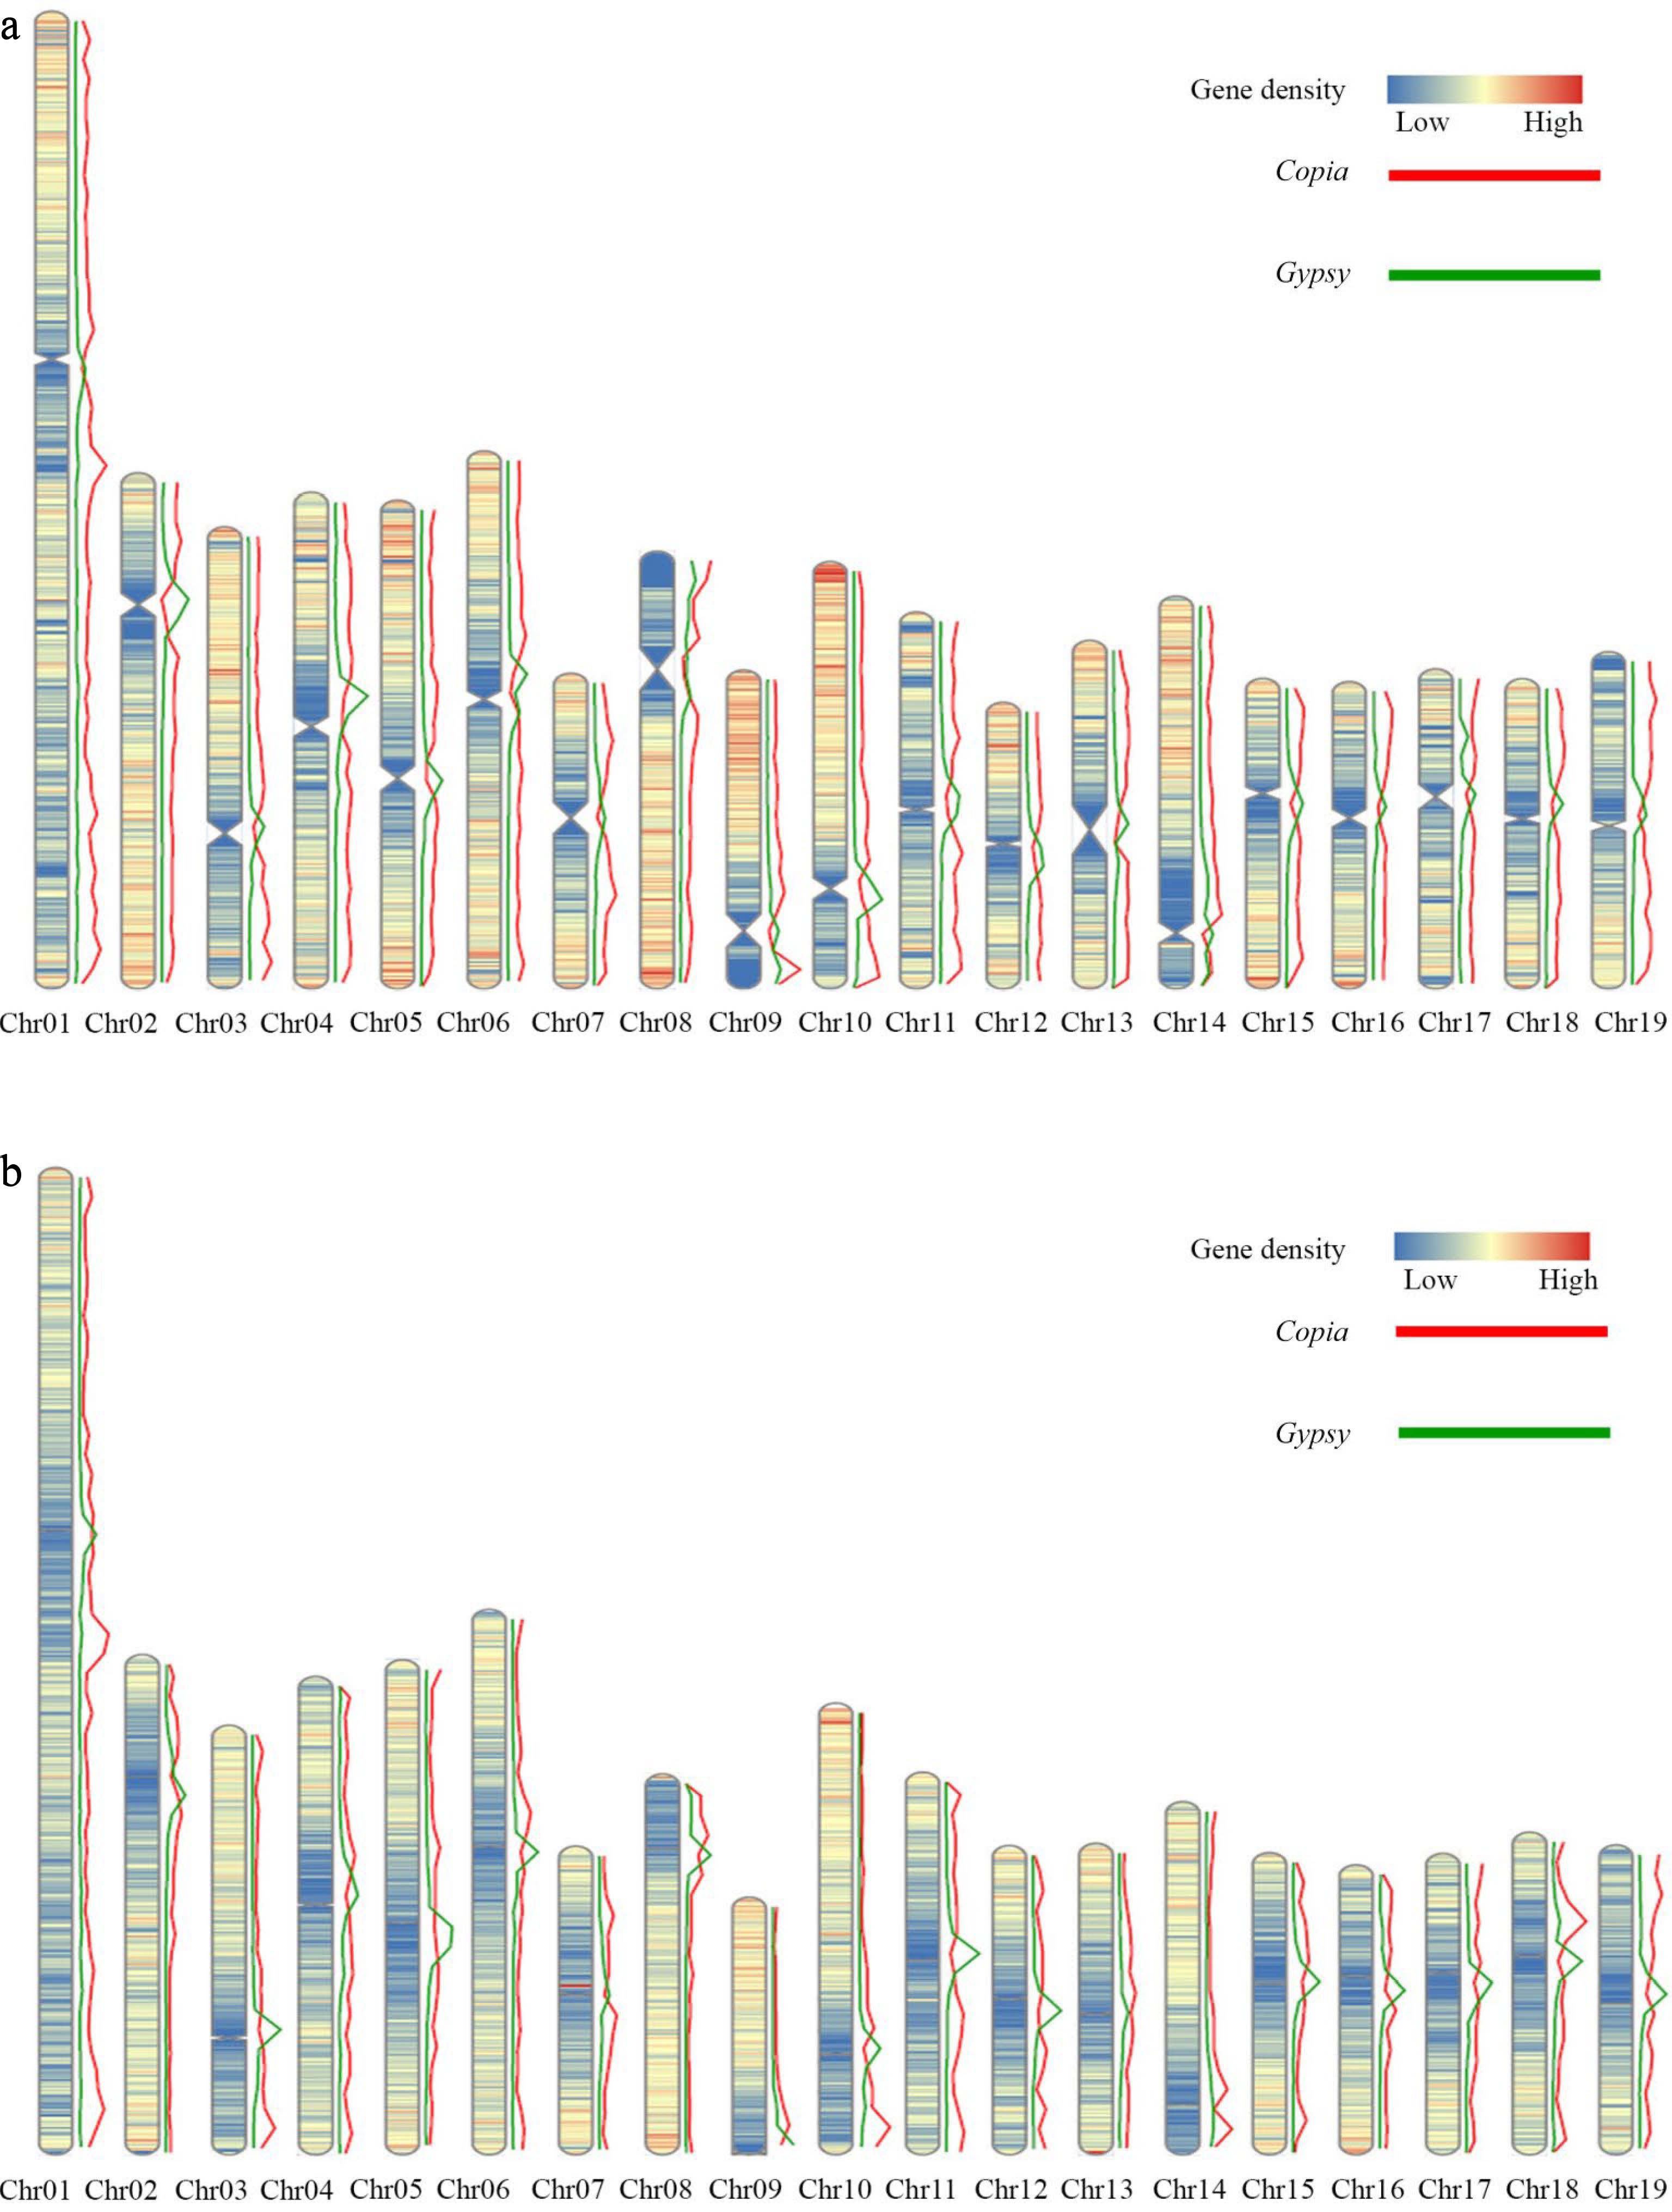
Figure 5.
Distribution of gene density and elements on the DH15 chromosomes. (a) Distribution of gene density and distribution of Copia and Gypsy elements on the chromosomes of P. ussuriensis. (b) Distribution of gene density and distribution of Copia and Gypsy elements on the chromosomes of P. trichocarpa.
-
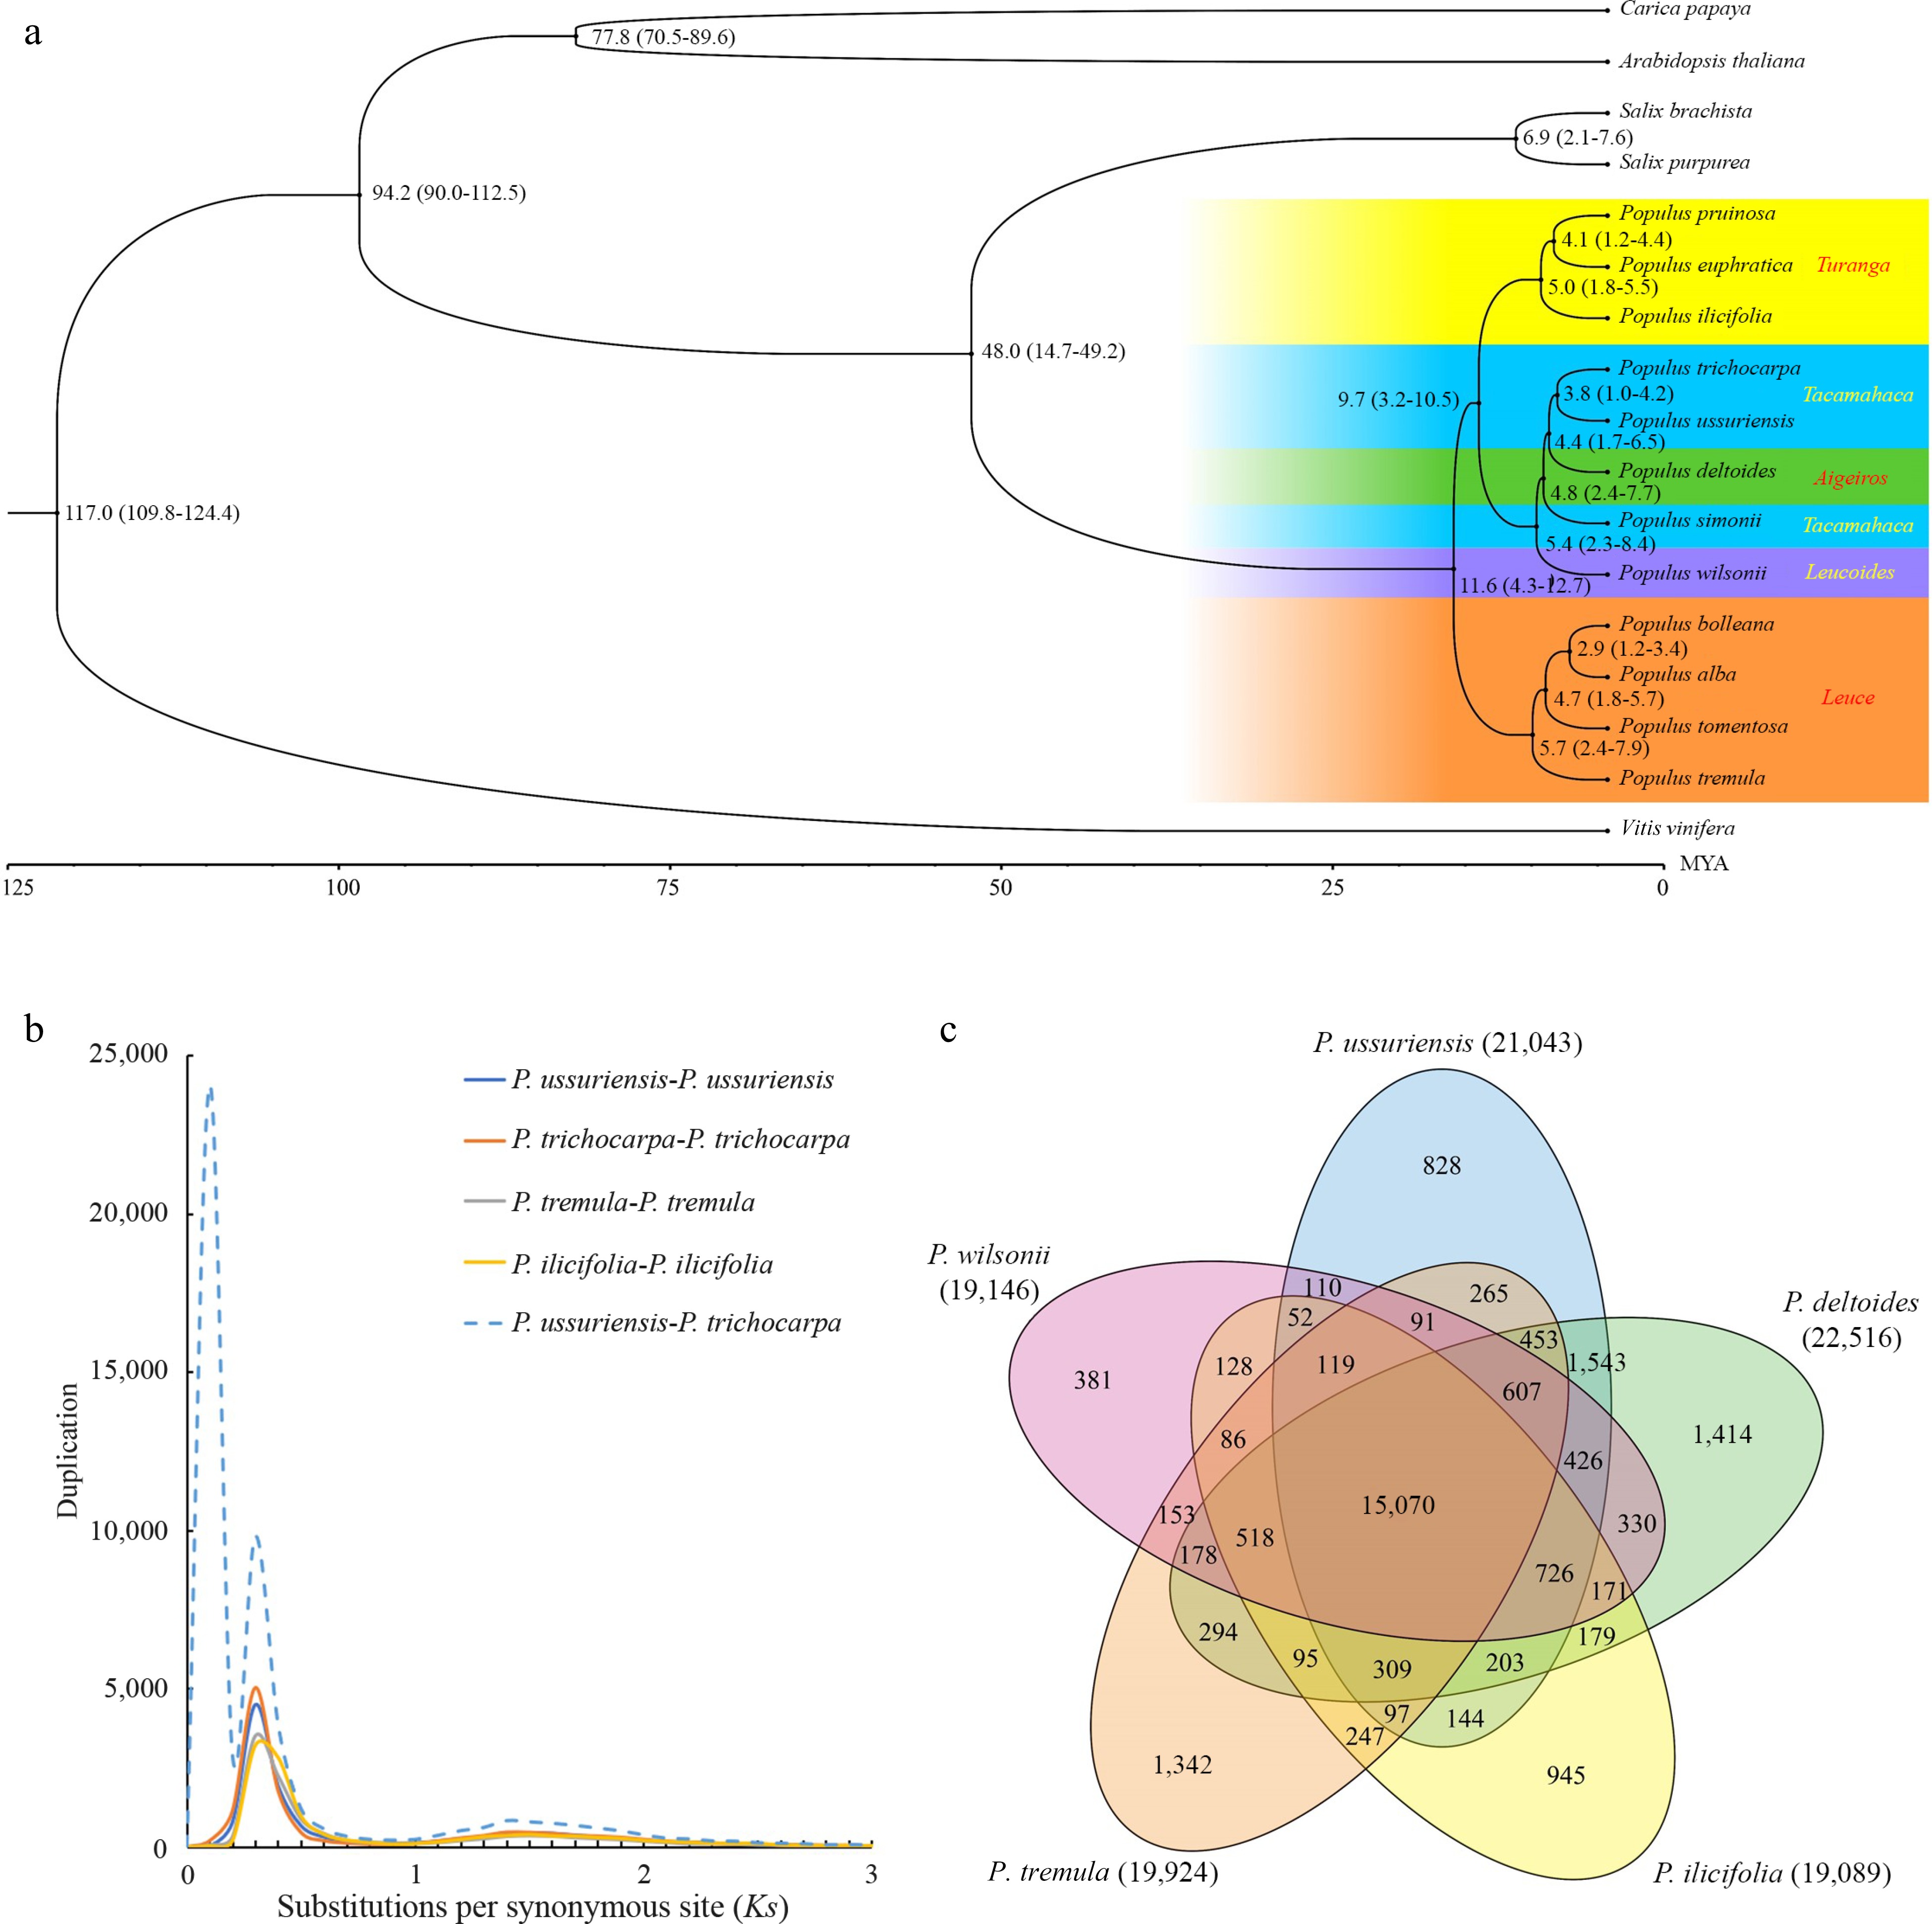
Figure 6.
Evolutionary analysis of the P. ussuriensis genome. (a) Inferred phylogenetic tree of P.ussuriensis and 16 plant species based on protein sequences of single-copy orthologous genes. The numerical value beside each node is the estimated divergent time (million years ago, Mya) while the values in parentheses denote the range of the predicted divergence time). (b) Frequency distributions of synonymous substitutions (Ks) for the paralogous and orthologous genes within each of the following species: P. ussuriensis, P. tremula, P. ilicifolia, P. trichocarpa, and within each species. Additionally, we calculated Ks values between P. ussuriensis and P. trichocarpa. The lines with different colors represent the Ks distribution of different comparisons. (c) Venn diagram of the shared orthologous and paralogous gene families among five species: P. ussuriensis, P. tremula, P. ilicifolia, P. deltoides and P. trichocarpa.
-
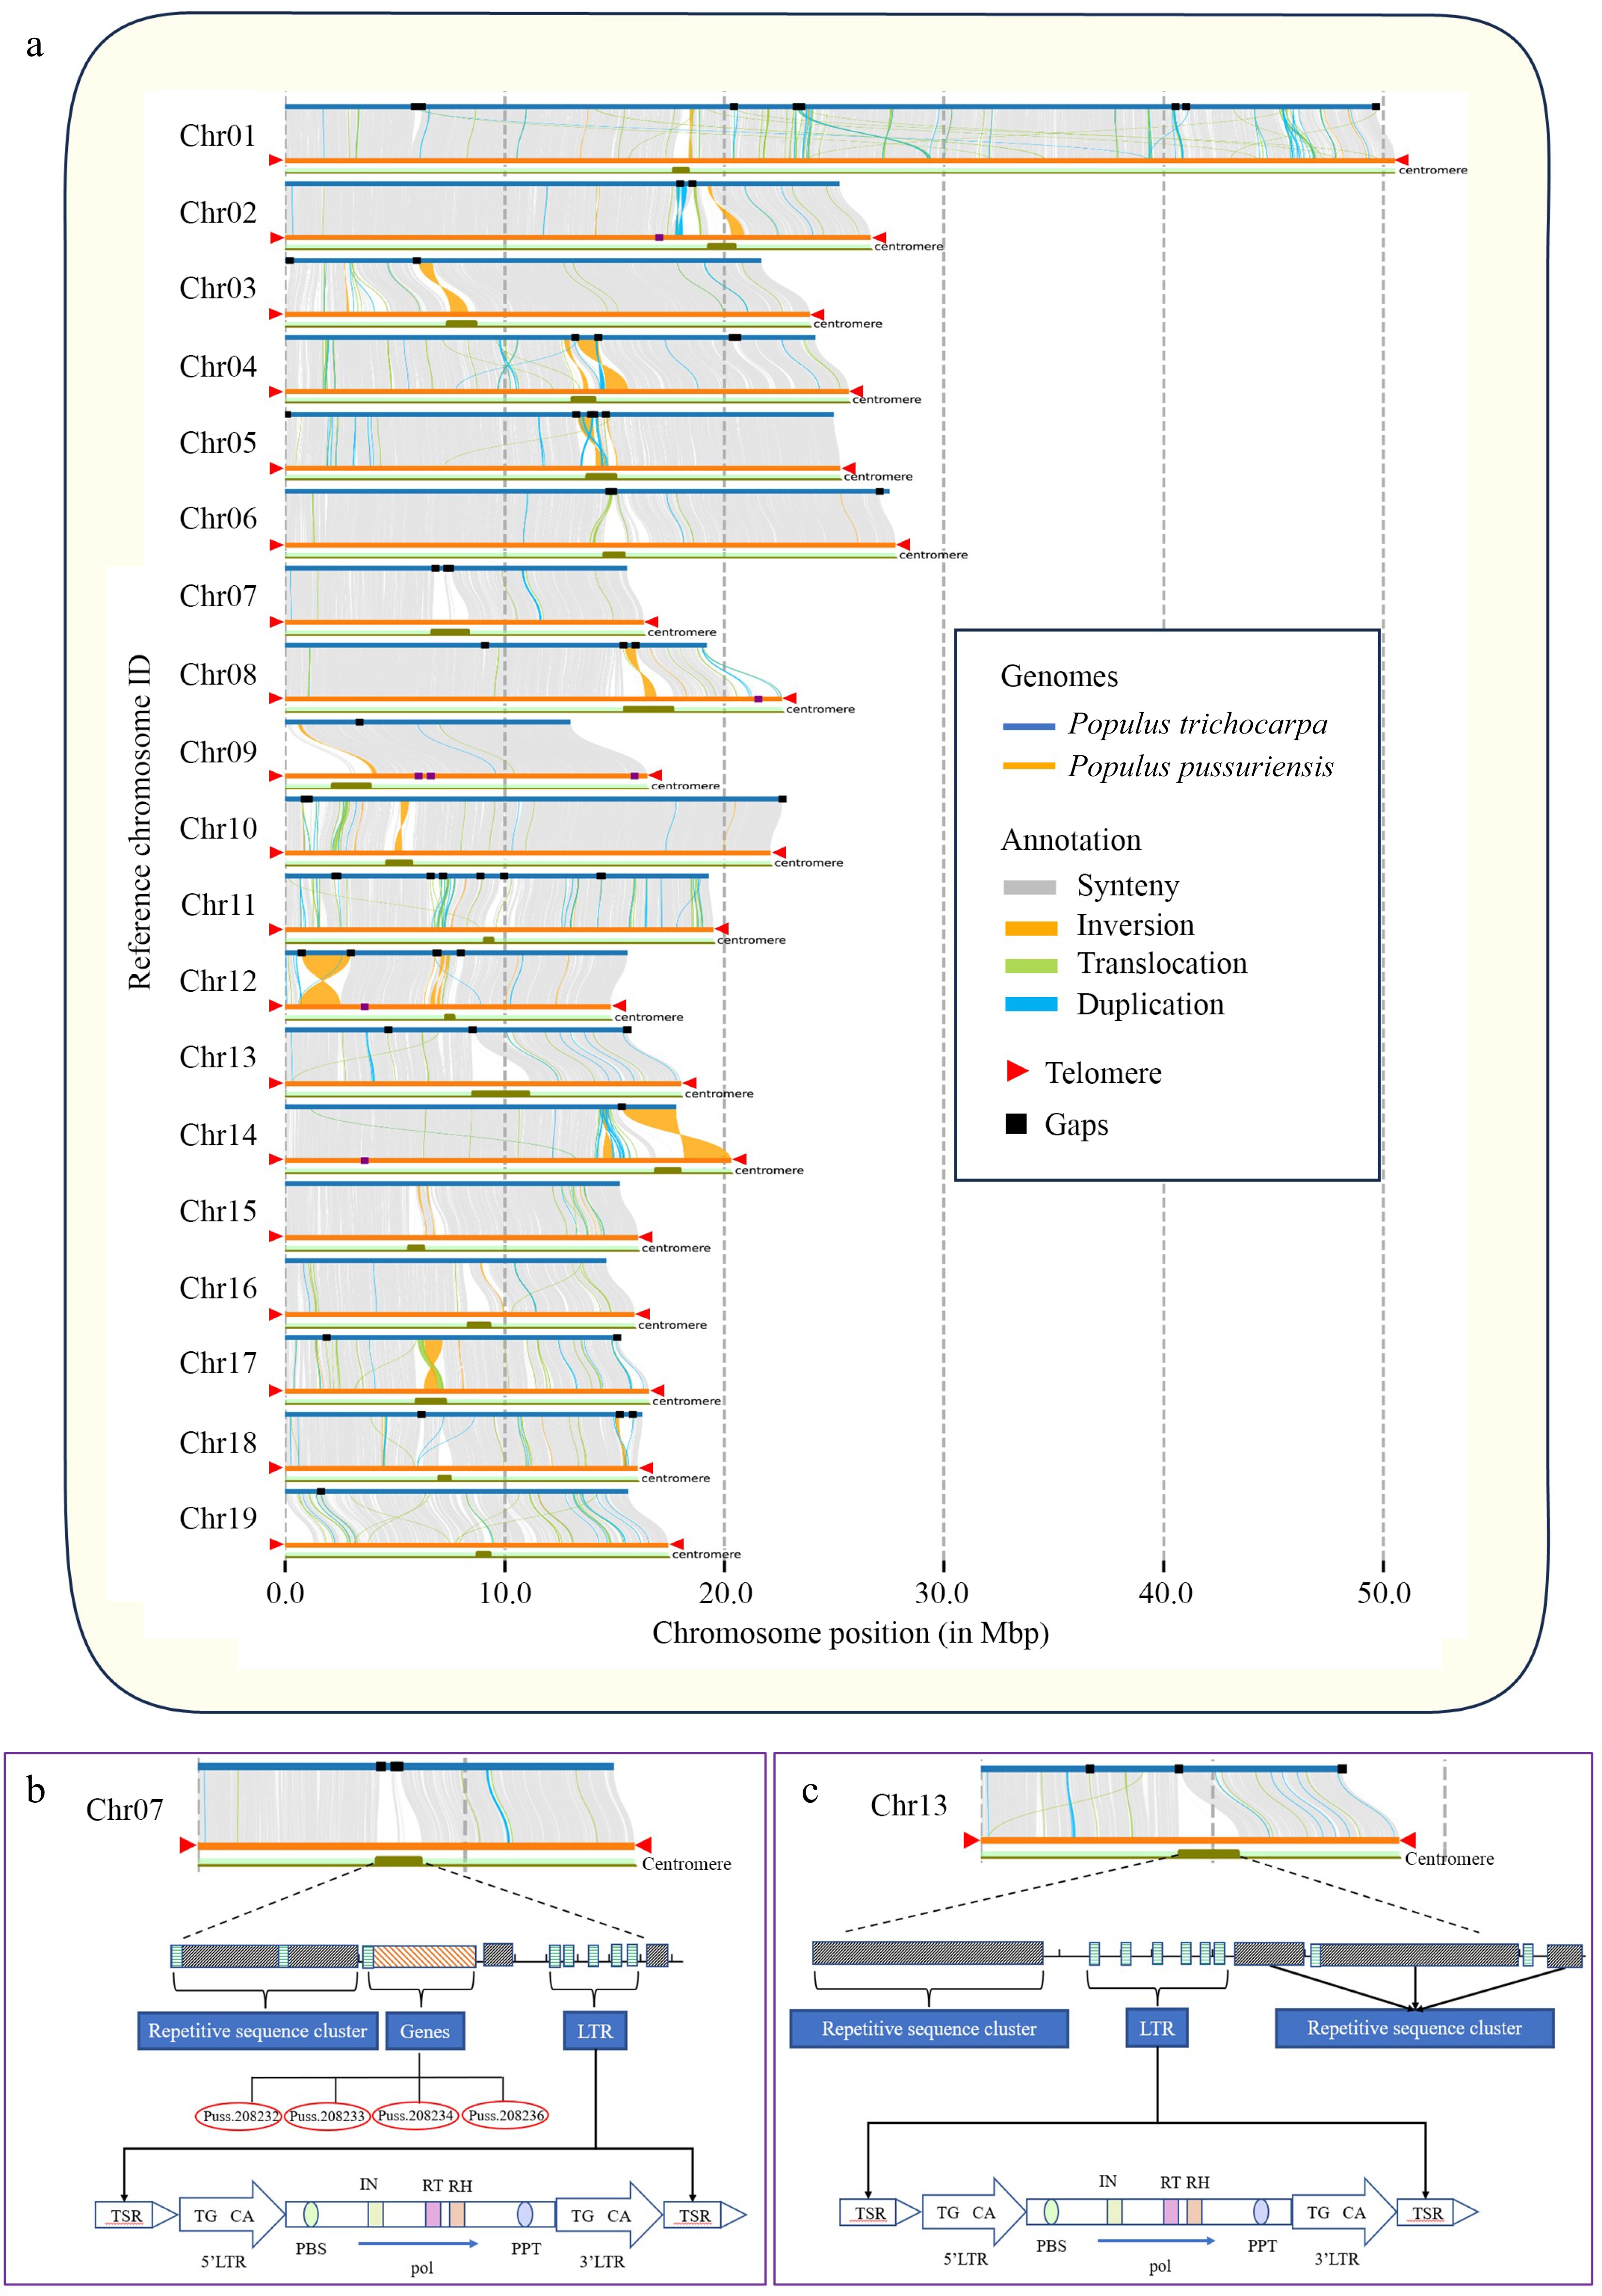
Figure 7.
Genome collinearity, telomer and centromere structures in P. ussuriensis and P. trichocarpa genomes. (a) Collinearity between the genomes of P. ussuriensis and P. trichocarpa (gray lines). The red triangles mark the positions of telomere sequence repeats. The black rectangles illustrate the positions of gaps. (b) Structural delineation of P. ussuriensis Chromosome 07 centromere that corresponds to an unfilled gap in P. trichocarpa genome. (c) Structural delineation of P. ussuriensis Chromosome 13 centromere that corresponds to an unfilled gap in the P. trichocarpa genome.
Figures
(7)
Tables
(0)