-
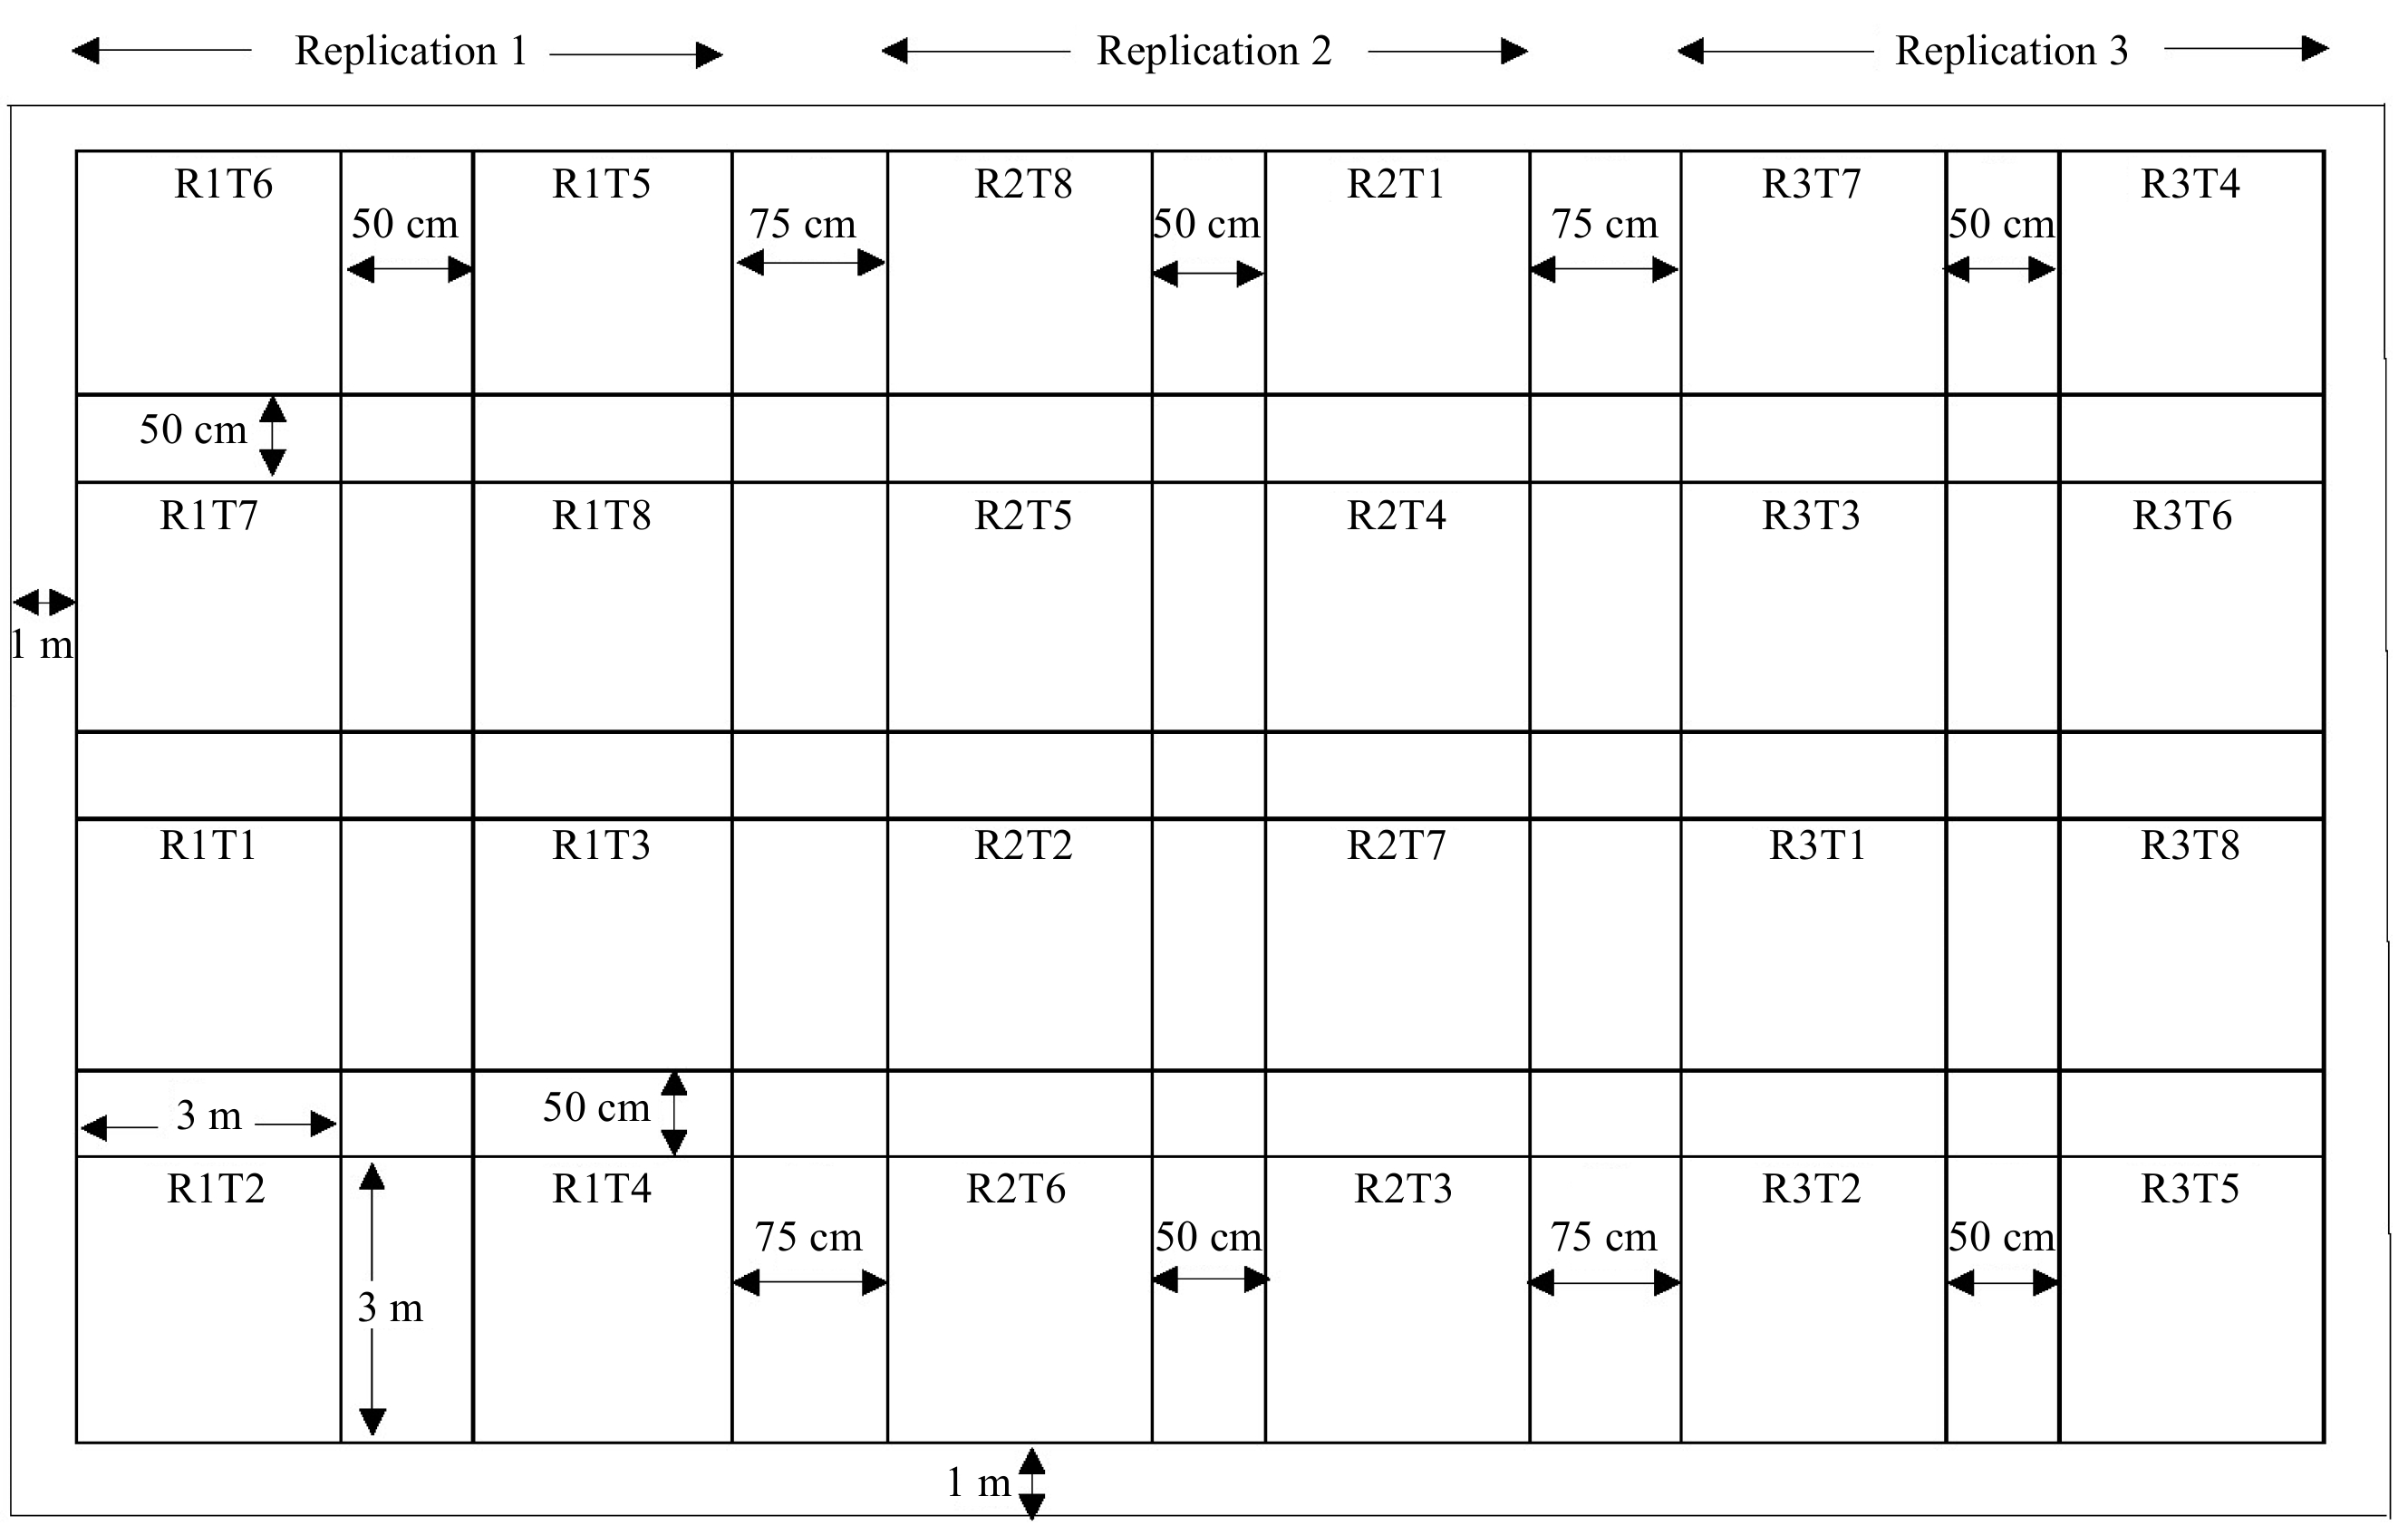
Figure 1.
Experimental layout of the field.
-
S. N Soil status Values 1 Textural class Clay loam (Alluvial) 2 Chemical properties i pH 7.6 (Alkaline) ii Nitrogen (%) 0.09 (Low) iii Phosphorus (kg/ha) (Low) iv Potassium (kg/ha) (Low) v Organic matter (%) 1.95 (Low) Table 1.
Soil nutritional condition of the study site.
-
Treatment Details T1 (M1F0) Mulching and control (without fertilizer) T2 (M1F1) Mulching and FYM only T3 (M1F2) Mulching and RDF of NPK T4 (M1F3) Mulching and combination of FYM and NPK T5 (M2F0) Non-mulching and control T6 (M2F1) Non-mulching and FYM only T7 (M2F2) Non-mulching and RDF of NPK T8 (M2F3) Non-mulching and combination of FYM and NPK RDF stands for Recommended dose of fertilizer (For NPK = 140:40:100 NPK/ha; For farmyard manure = 30 t/ha). Table 2.
Treatment details used in the experiment.
-
Treatment Plant height (cm) 15 DAT 30 DAT 45 DAT Factor A Mulching 33.98a 143.10a 170.80a Non-mulching 28.92b 128.81b 149.16b LSD (0.05) 2.63 3.03 3.033 SEM (±) 0.43 0.93 0.8 F-test ** *** *** CV (%) 9.55 4.74 3.45 Factor B Control 27.29c 119.0c 141.20d FYM 30.50bc 125.87c 149.74c NPK 31.98b 140.29b 167.77b FYM + NPK 36.04a 158.66a 181.23a LSD (0.05) 3.72 3.033 SEM (±) 0.31 0.66 0.56 F-test ** *** *** CV (%) 9.55 4.74 3.45 Grand mean 31.45 135.96 159.98 A × B F-test NS NS ** DAT = Days after transplanting; Data in columns with the same letters in DMRT are not significantly different (p = 0.05); SEM (±) = Standard error of the mean; CV = Coefficient of variation; LSD = Least significant difference; ** = significant at p < 0.01; *** = significant at p < 0.001. Table 3.
Effect of mulching and fertilizers on plant height of cucumber.
-
Plant height (cm) at 45 DAT Treatments Mulching Non-mulching Control 145.69ef 136.71f FYM 156.39d 143.08ef NPK 184.89b 150.66de FYM + NPK 196.25a 166.21c SEM (±) 0.4 LSD (0.05) 9.68 F-test ** CV (%) 3.45 Grand mean 159.98 DAT = Days after transplanting; Data in columns with the same letters in DMRT are not significantly different (p = 0.05); SEM (±) = Standard error of the mean; CV = Coefficient of variation; LSD = Least significant difference; ** = significant at p < 0.01. Table 4.
Interaction effect of mulching and fertilizer on plant height at 45 DAT.
-
Treatment Number of branches 15 DAT 30 DAT 45 DAT Factor A Mulching 1.50 4.70a 5.35a Non-mulching 1.79 3.43b 4.29b LSD (0.05) 0.30 0.21 0.429 SEM (±) 0.05 0.04 0.07 F-test NS *** *** CV (%) 21.09 6.13 10.17 Factor B Control 1.58 4.02ab 4.47b FYM 1.50 4.29a 5.41a NPK 1.70 4.16a 4.81ab FYM + NPK 1.79 3.79b 4.58b LSD (0.05) 0.43 0.309 0.607 SEM (±) 0.04 0.03 0.05 F-test NS * * CV (%) 21.09 6.13 10.17 Grand mean 1.64 4.06 4.82 A × B F-test NS NS NS DAT = Days after transplanting; Data in columns with the same letters in DMRT are not significantly different (p = 0.05); SEM (±) = Standard error of the mean; CV = Coefficient of variation; LSD = Least significant difference; * = significant at p < 0.05; NS = Non-significant. Table 5.
Effect of mulching and fertilizers on number of branches of cucumber.
-
Treatment Number of leaves 15 DAT 30 DAT 45 DAT Factor A Mulching 4.89a 39.62a 51.96a Non-mulching 4.18b 27.20b 37.96b LSD (0.05) 0.29 3.67 3.35 SEM (±) 0.05 0.61 0.55 F-test *** *** *** CV (%) 7.51 12.55 8.52 Factor B Control 4.45ab 29.12b 38.08c FYM 4.70a 35.04a 45.29b NPK 4.75a 32.54ab 43.96b FYM + NPK 4.25b 36.95a 52.50a LSD (0.05) 0.42 5.19 4.74 SEM (±) 0.03 0.43 0.39 F-test NS * *** CV (%) 7.51 12.55 16.89 Grand mean 4.54 33.41 44.96 A × B F-test NS NS NS DAT = Days after transplanting; Data in columns with the same letters in DMRT are not significantly different (p = 0.05); SEM (±) = Standard error of the mean; CV = Coefficient of variation; LSD = Least significant difference; * = significant at p < 0.05; *** = significant at p < 0.001; NS = Non-significant. Table 6.
Effect of mulching and fertilizers on number of leaves of cucumber.
-
Treatment Fruit set/plant Fruit length
(cm)Fruit diameter
(cm)Factor A Mulching 13.73a 20.68a 5.29a Non-mulching 10.82b 19.28b 5.23a LSD (0.05) 1.06 1.19 0.41 SEM (±) 0.17 0.20 0.07 F-test *** NS NS CV (%) 9.94 6.85 9.02 Factor B Control 9.99c 19.33 5.20 FYM 12.16b 20.21 5.25 NPK 12.26b 19.86 5.27 FYM + NPK 14.68a 20.54 5.31 LSD (0.05) 1.51 1.69 0.59 SEM (±) 0.122 0.14 0.05 F-test ** NS NS CV (%) 9.94 6.85 9.01 Grand mean 12.27 19.98 5.26 A × B F-test NS NS NS Data in columns with the same letters in DMRT are not significantly different (p = 0.05); SEM (±) = Standard error of the mean; CV = Coefficient of variation; LSD = Least significant difference; ** = significant at p < 0.01; *** = significant at p < 0.001; NS = Non-significant. Table 7.
Effect of mulching and fertilizers on fruit set, fruit length and fruit diameter of cucumber.
-
Treatment Yield/plant (g) Yield (t/ha) Factor A Mulching 1,047.43a 25.93a Non-mulching 673.33b 18.37b LSD (0.05) 164.45 3.27 SEM (±) 27.10 0.54 F-test *** *** CV (%) 21.82 16.87 Factor B Control 878.93ab 14.53c FYM 783.72b 23.71ab NPK 745.14b 22.39b FYM + NPK 1,033.74a 27.97a LSD (0.05) 232.57 4.62 SEM (±) 19.169 0.38 F-test * *** CV (%) 21.82 16.87 Grand mean 860.38 22.15 A × B F-test NS NS Data in columns with the same letters in DMRT are not significantly different (p = 0.05); SEM (±) = Standard error of the mean; CV = Coefficient of variation; LSD = Least significant difference; * = significant at p < 0.05; *** = significant at p < 0.001; NS = Non-significant. Table 8.
Effect of mulching and fertilizers on yield of cucumber.
-
Treatments Total production
costs (NRs./ha)Yield (t/ha) Average price of
cucumber (NRs/kg)Gross return
(NRs.)Net return
(NRs.)BCR Mulching 154,500 25.93 20 518,600 364,100 2.35 Non-mulching 120,200 18.37 20 367,400 246,900 2.04 Control 125,500 14.53 20 290,600 165,100 1.31 FYM 138,303 23.71 20 474,200 335,897 2.42 NPK 142,500 22.39 20 447,800 305,300 2.14 FYM + NPK 155,303 27.97 20 559,400 404,097 2.6 Table 9.
Economic analysis of mulching and fertilizer combinations on cucumber growth and production.
Figures
(1)
Tables
(9)