-
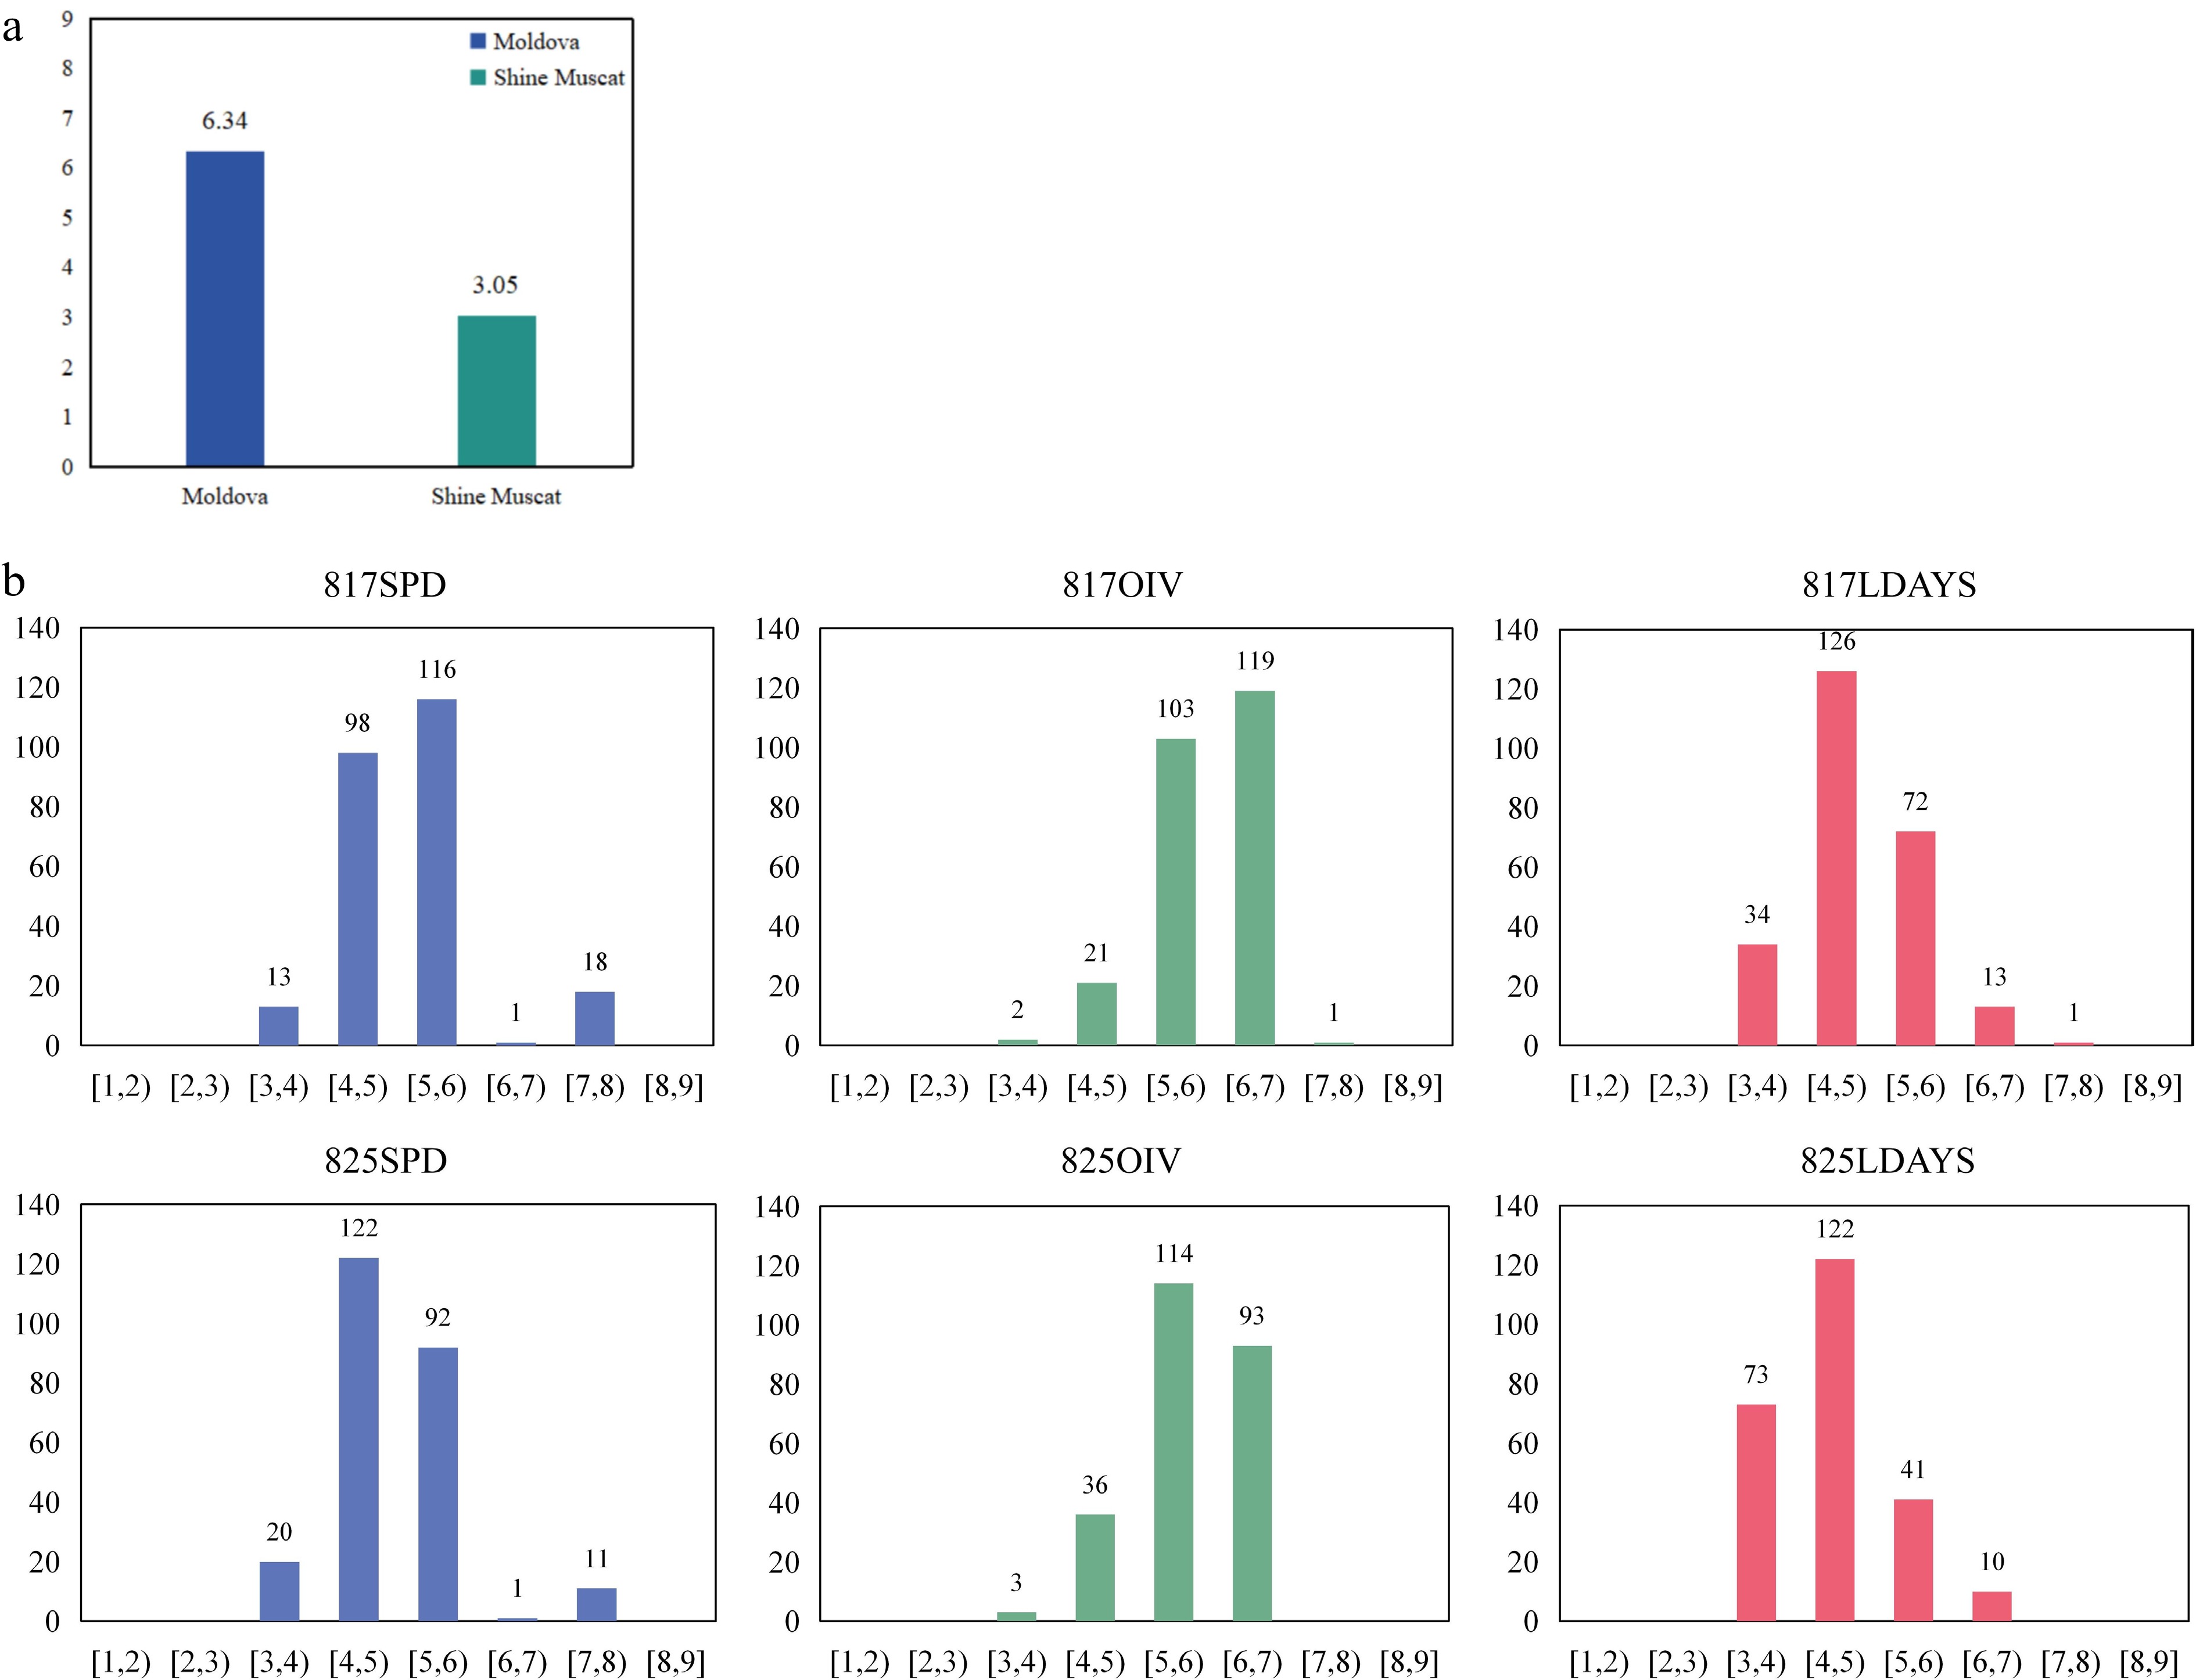
Figure 1.
The phenotype of parents and F1 population. (a) The P. viticola resistance level of the parents. The Y axis indicates the resistance level. (b) Phenotypic distribution of P. viticola resistance for F1 population from 'Moldova' × 'Shine Muscat'. The Y axis indicates the number of vines, and the X axis indicates the range of disease resistance level.
-
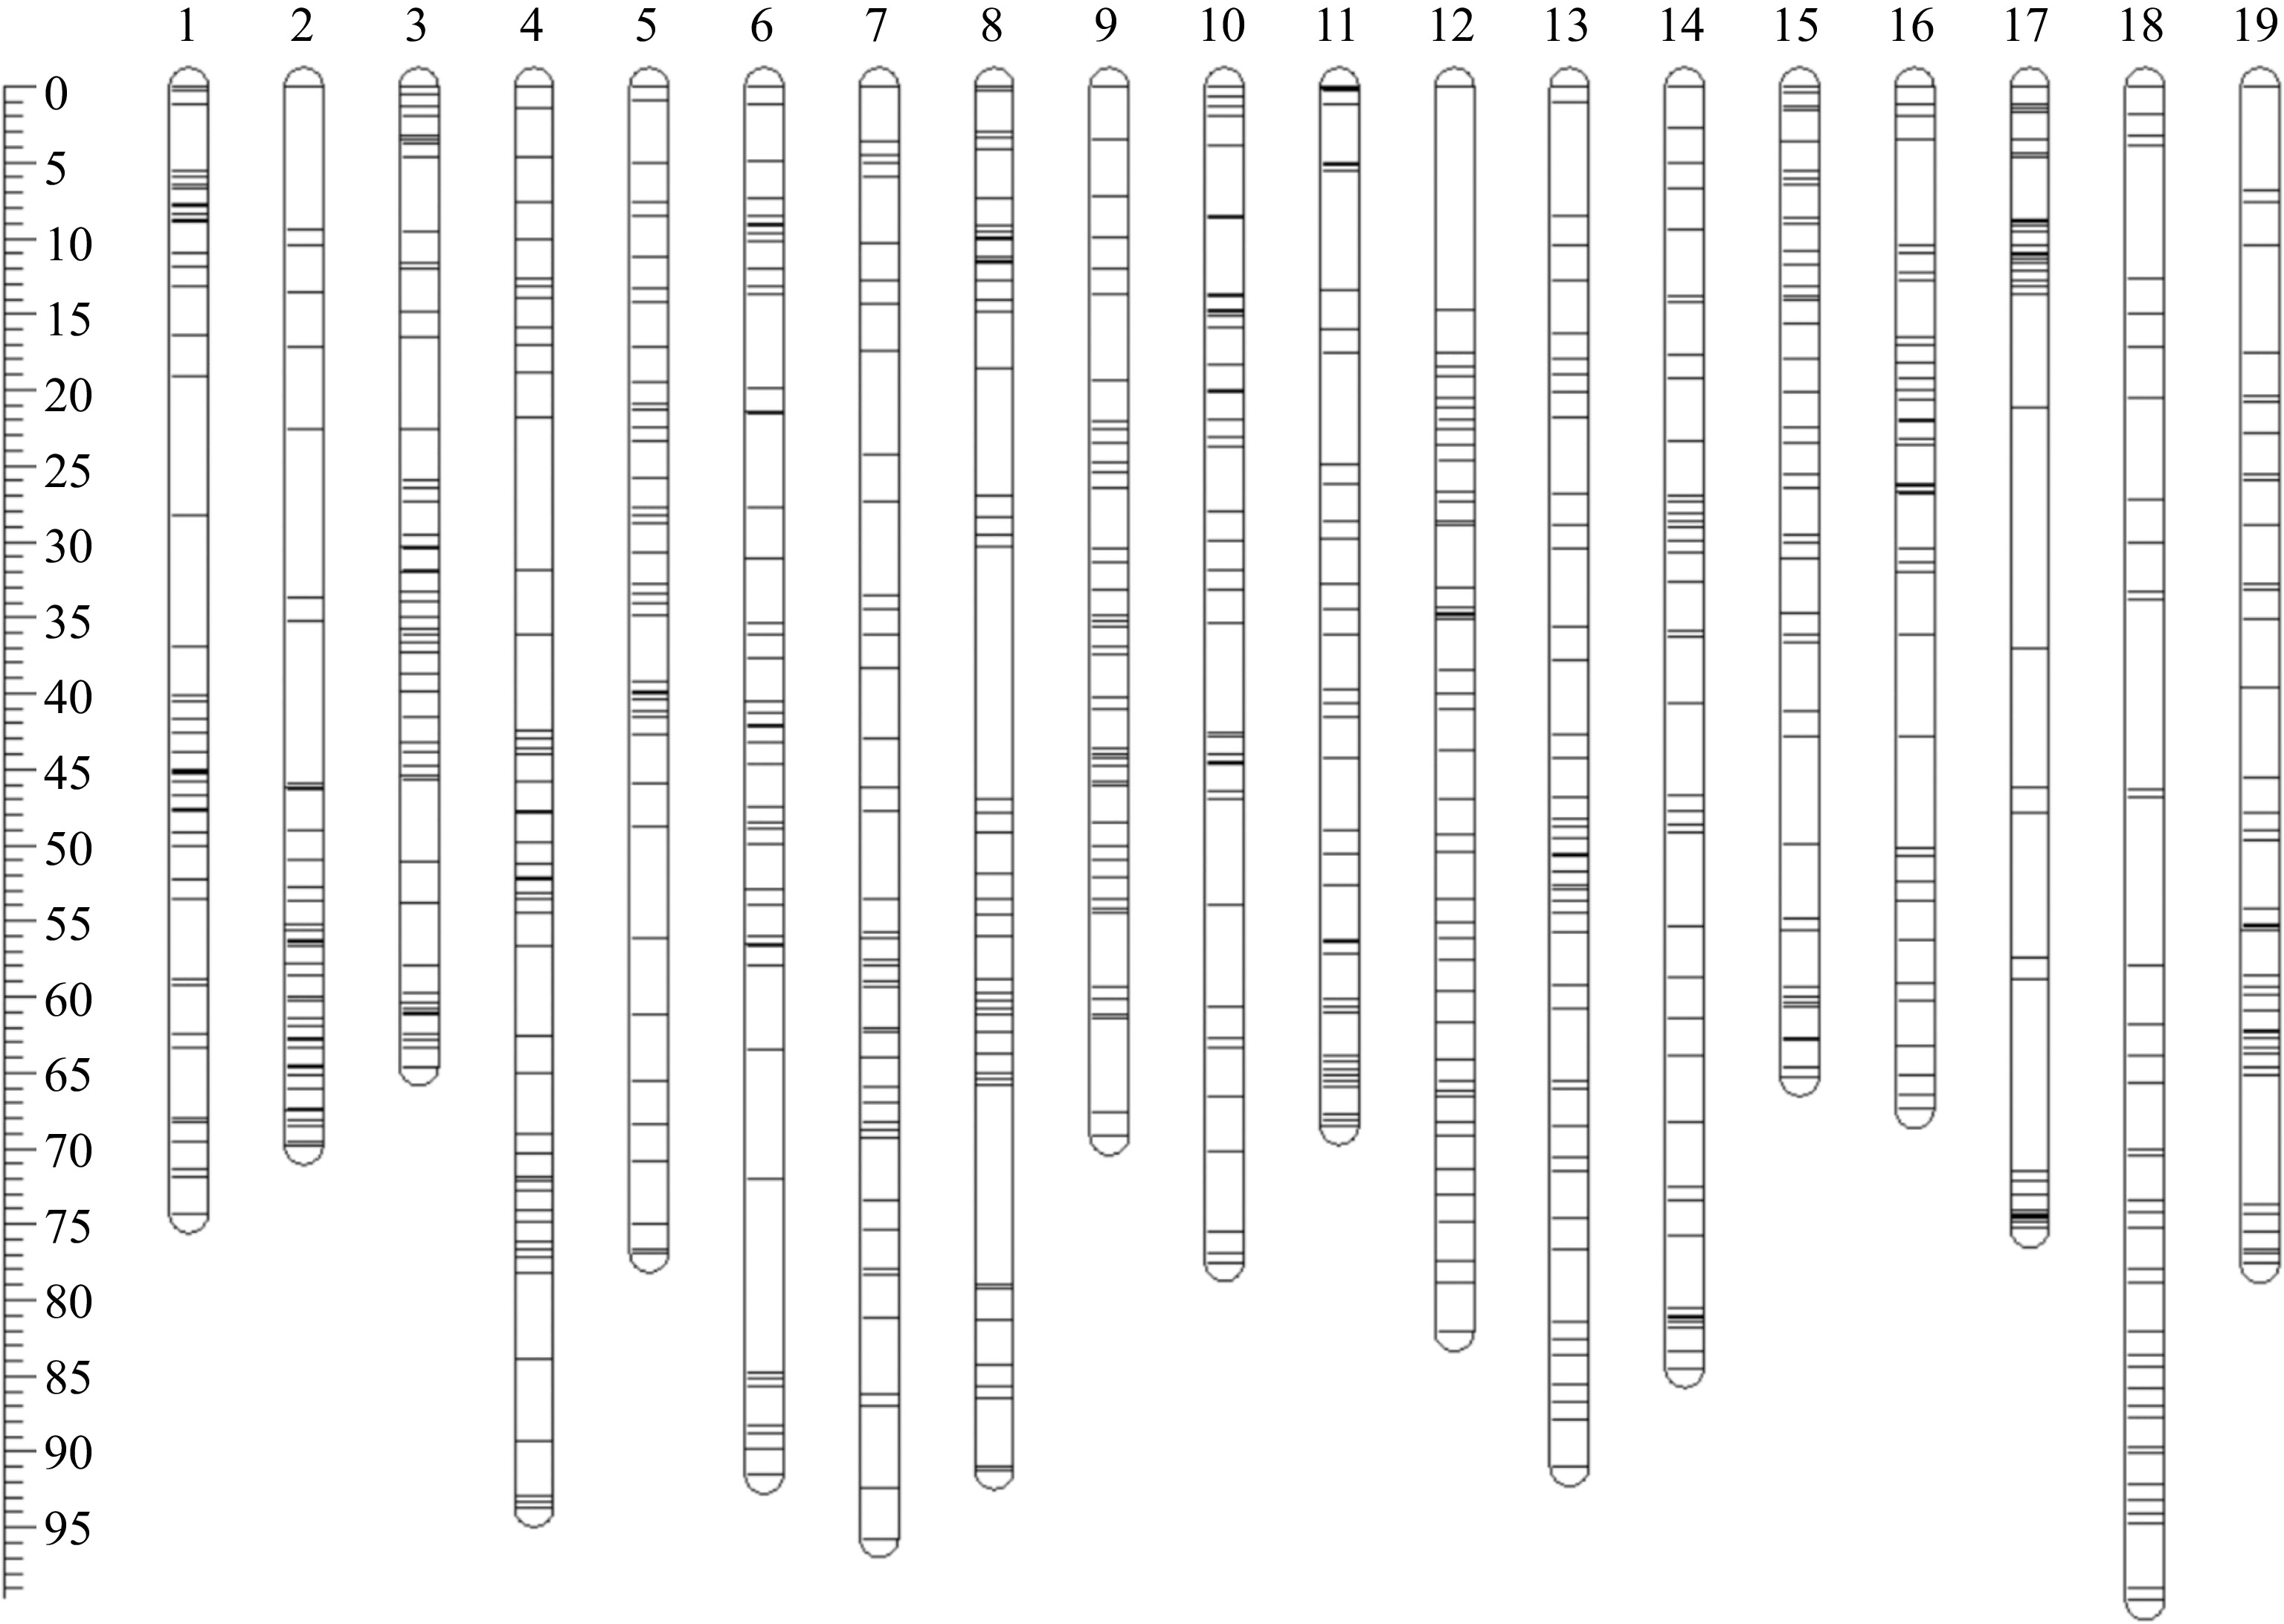
Figure 2.
Genetic map of hybrid population crosses from 'Moldova' × 'Shine Muscat'. LG1 to LG19 represents 19 linkage groups respectively, and each bar represents a SNP marker. The ruler on the left is the genetic distance (cM).
-
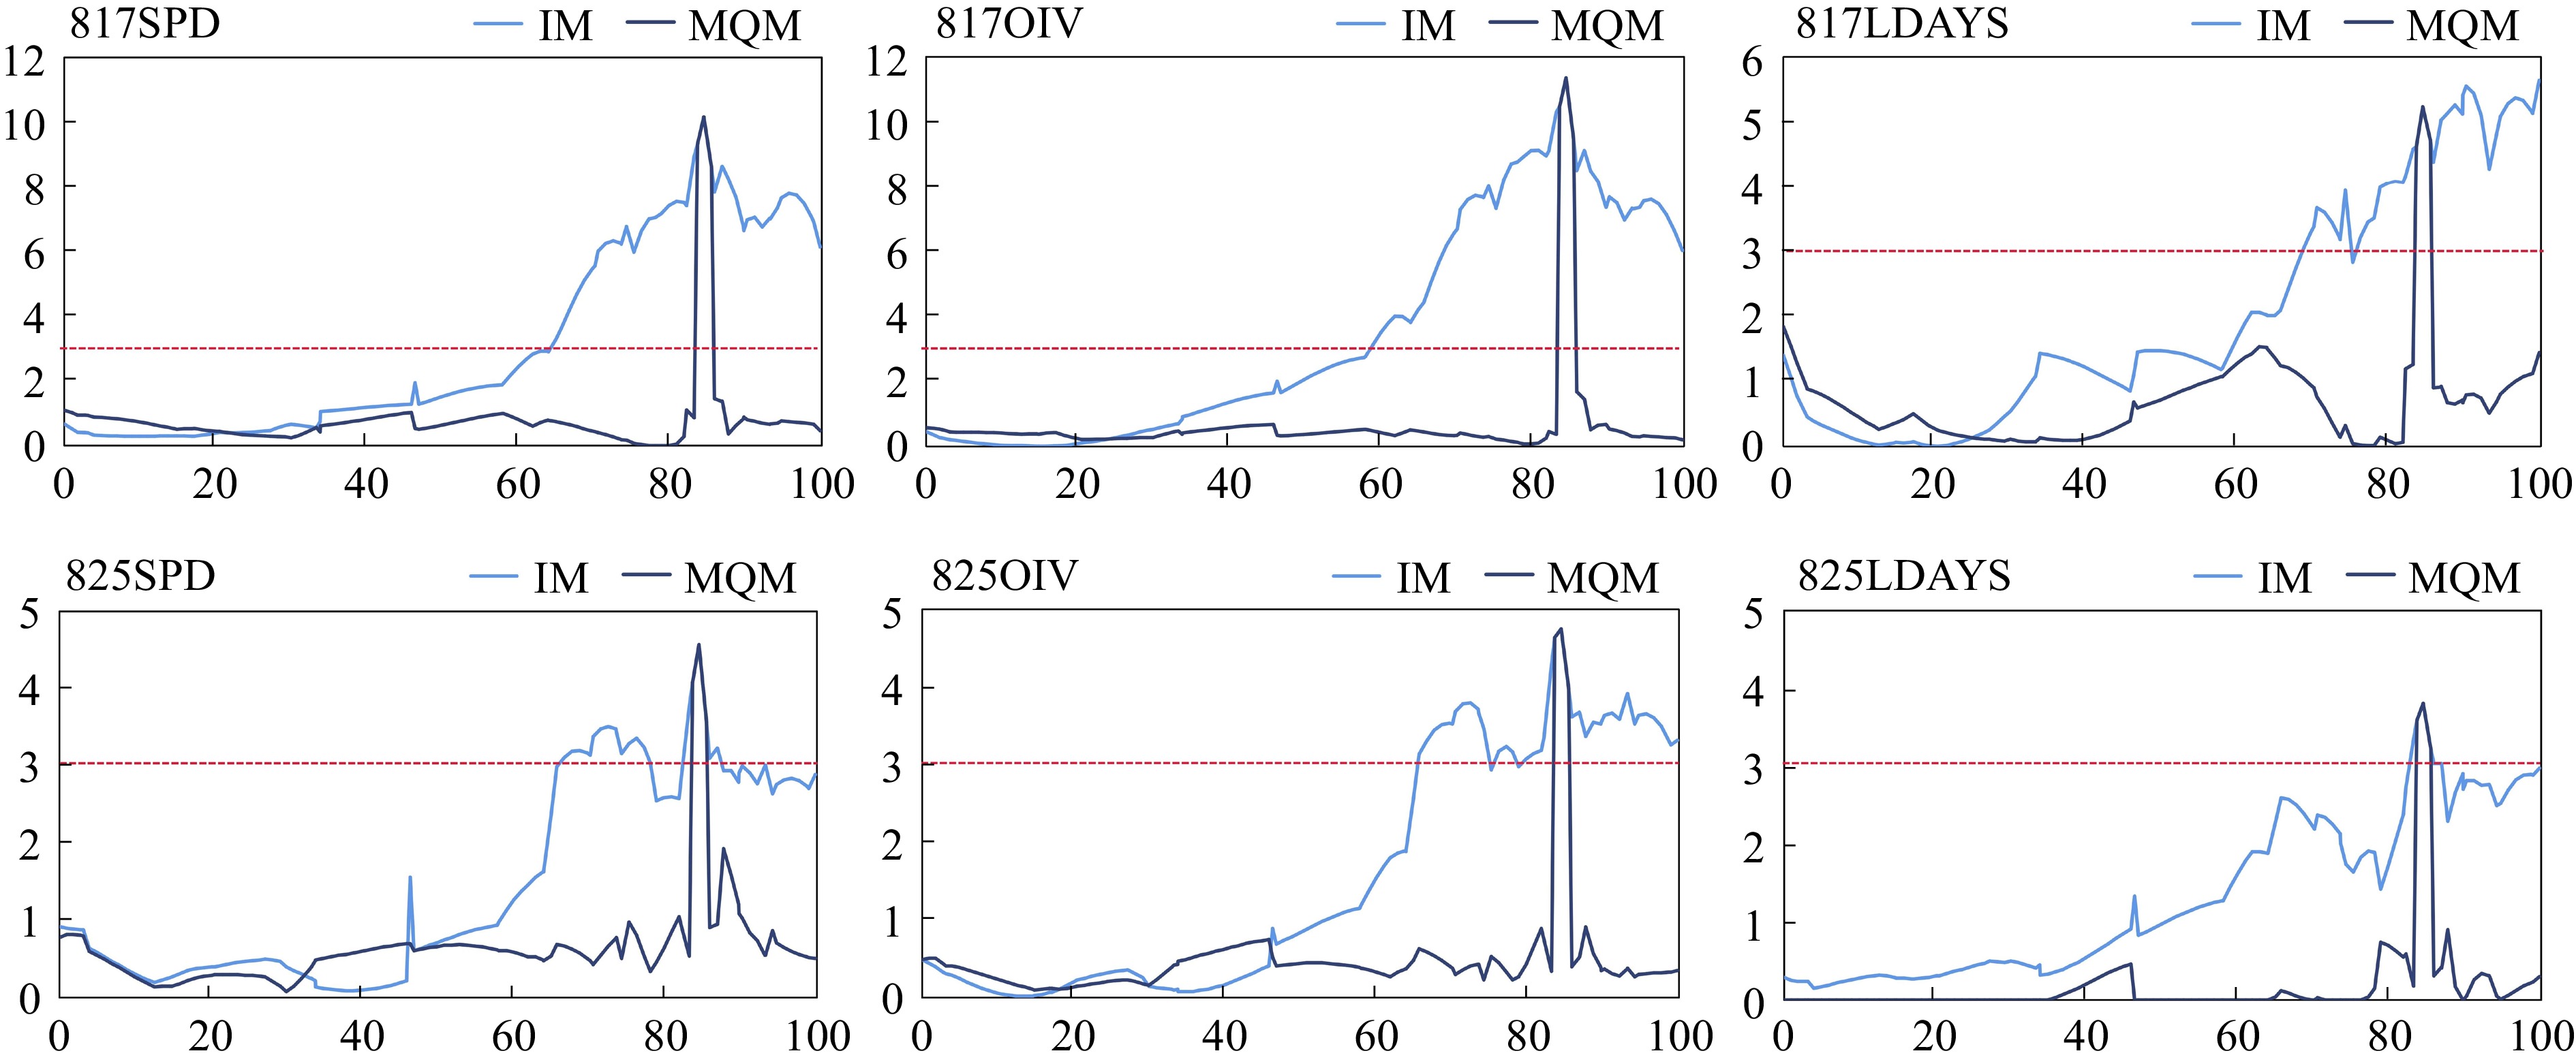
Figure 3.
Mapping of P. viticola resistance QTL on chr18. The light blue lines are mapping based on interval mapping, the dark blue lines are mapping based on multiple-QTL mapping. The red lines are threshold (LOD = 3.0) of locus.
-
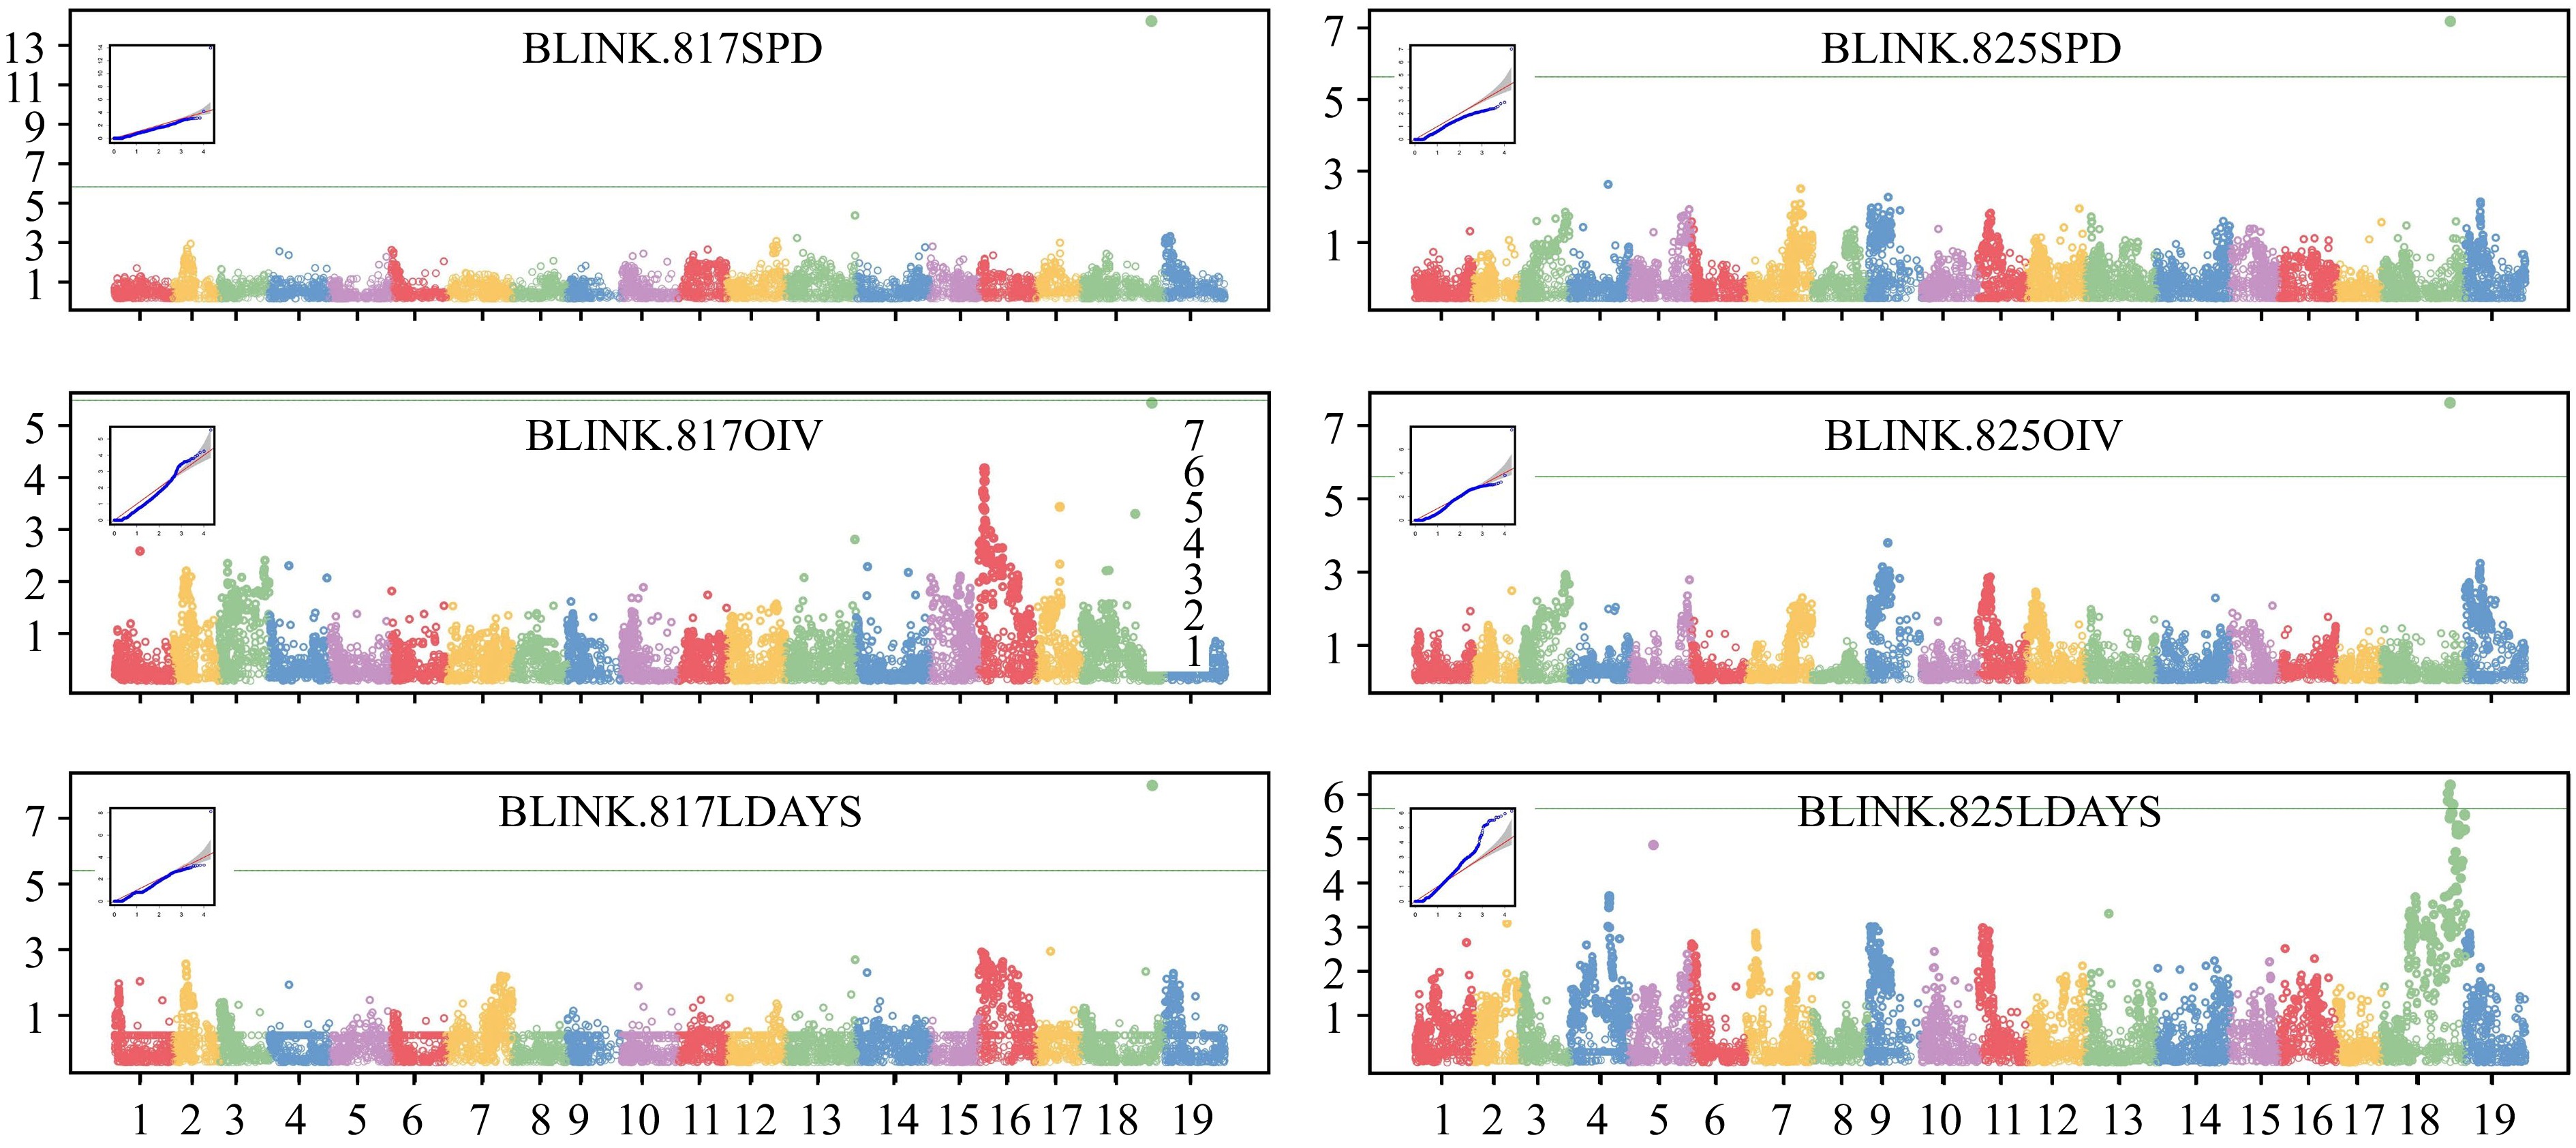
Figure 4.
GWAS analysis of P. viticola resistance locus. Manhattan plots and QQ plots were drawn based on Blink model. The vertical axis of the Manhattan map is the −log10(p) of each marker. The green lines are threshold (LOD = 5.7) of high related markers.
-
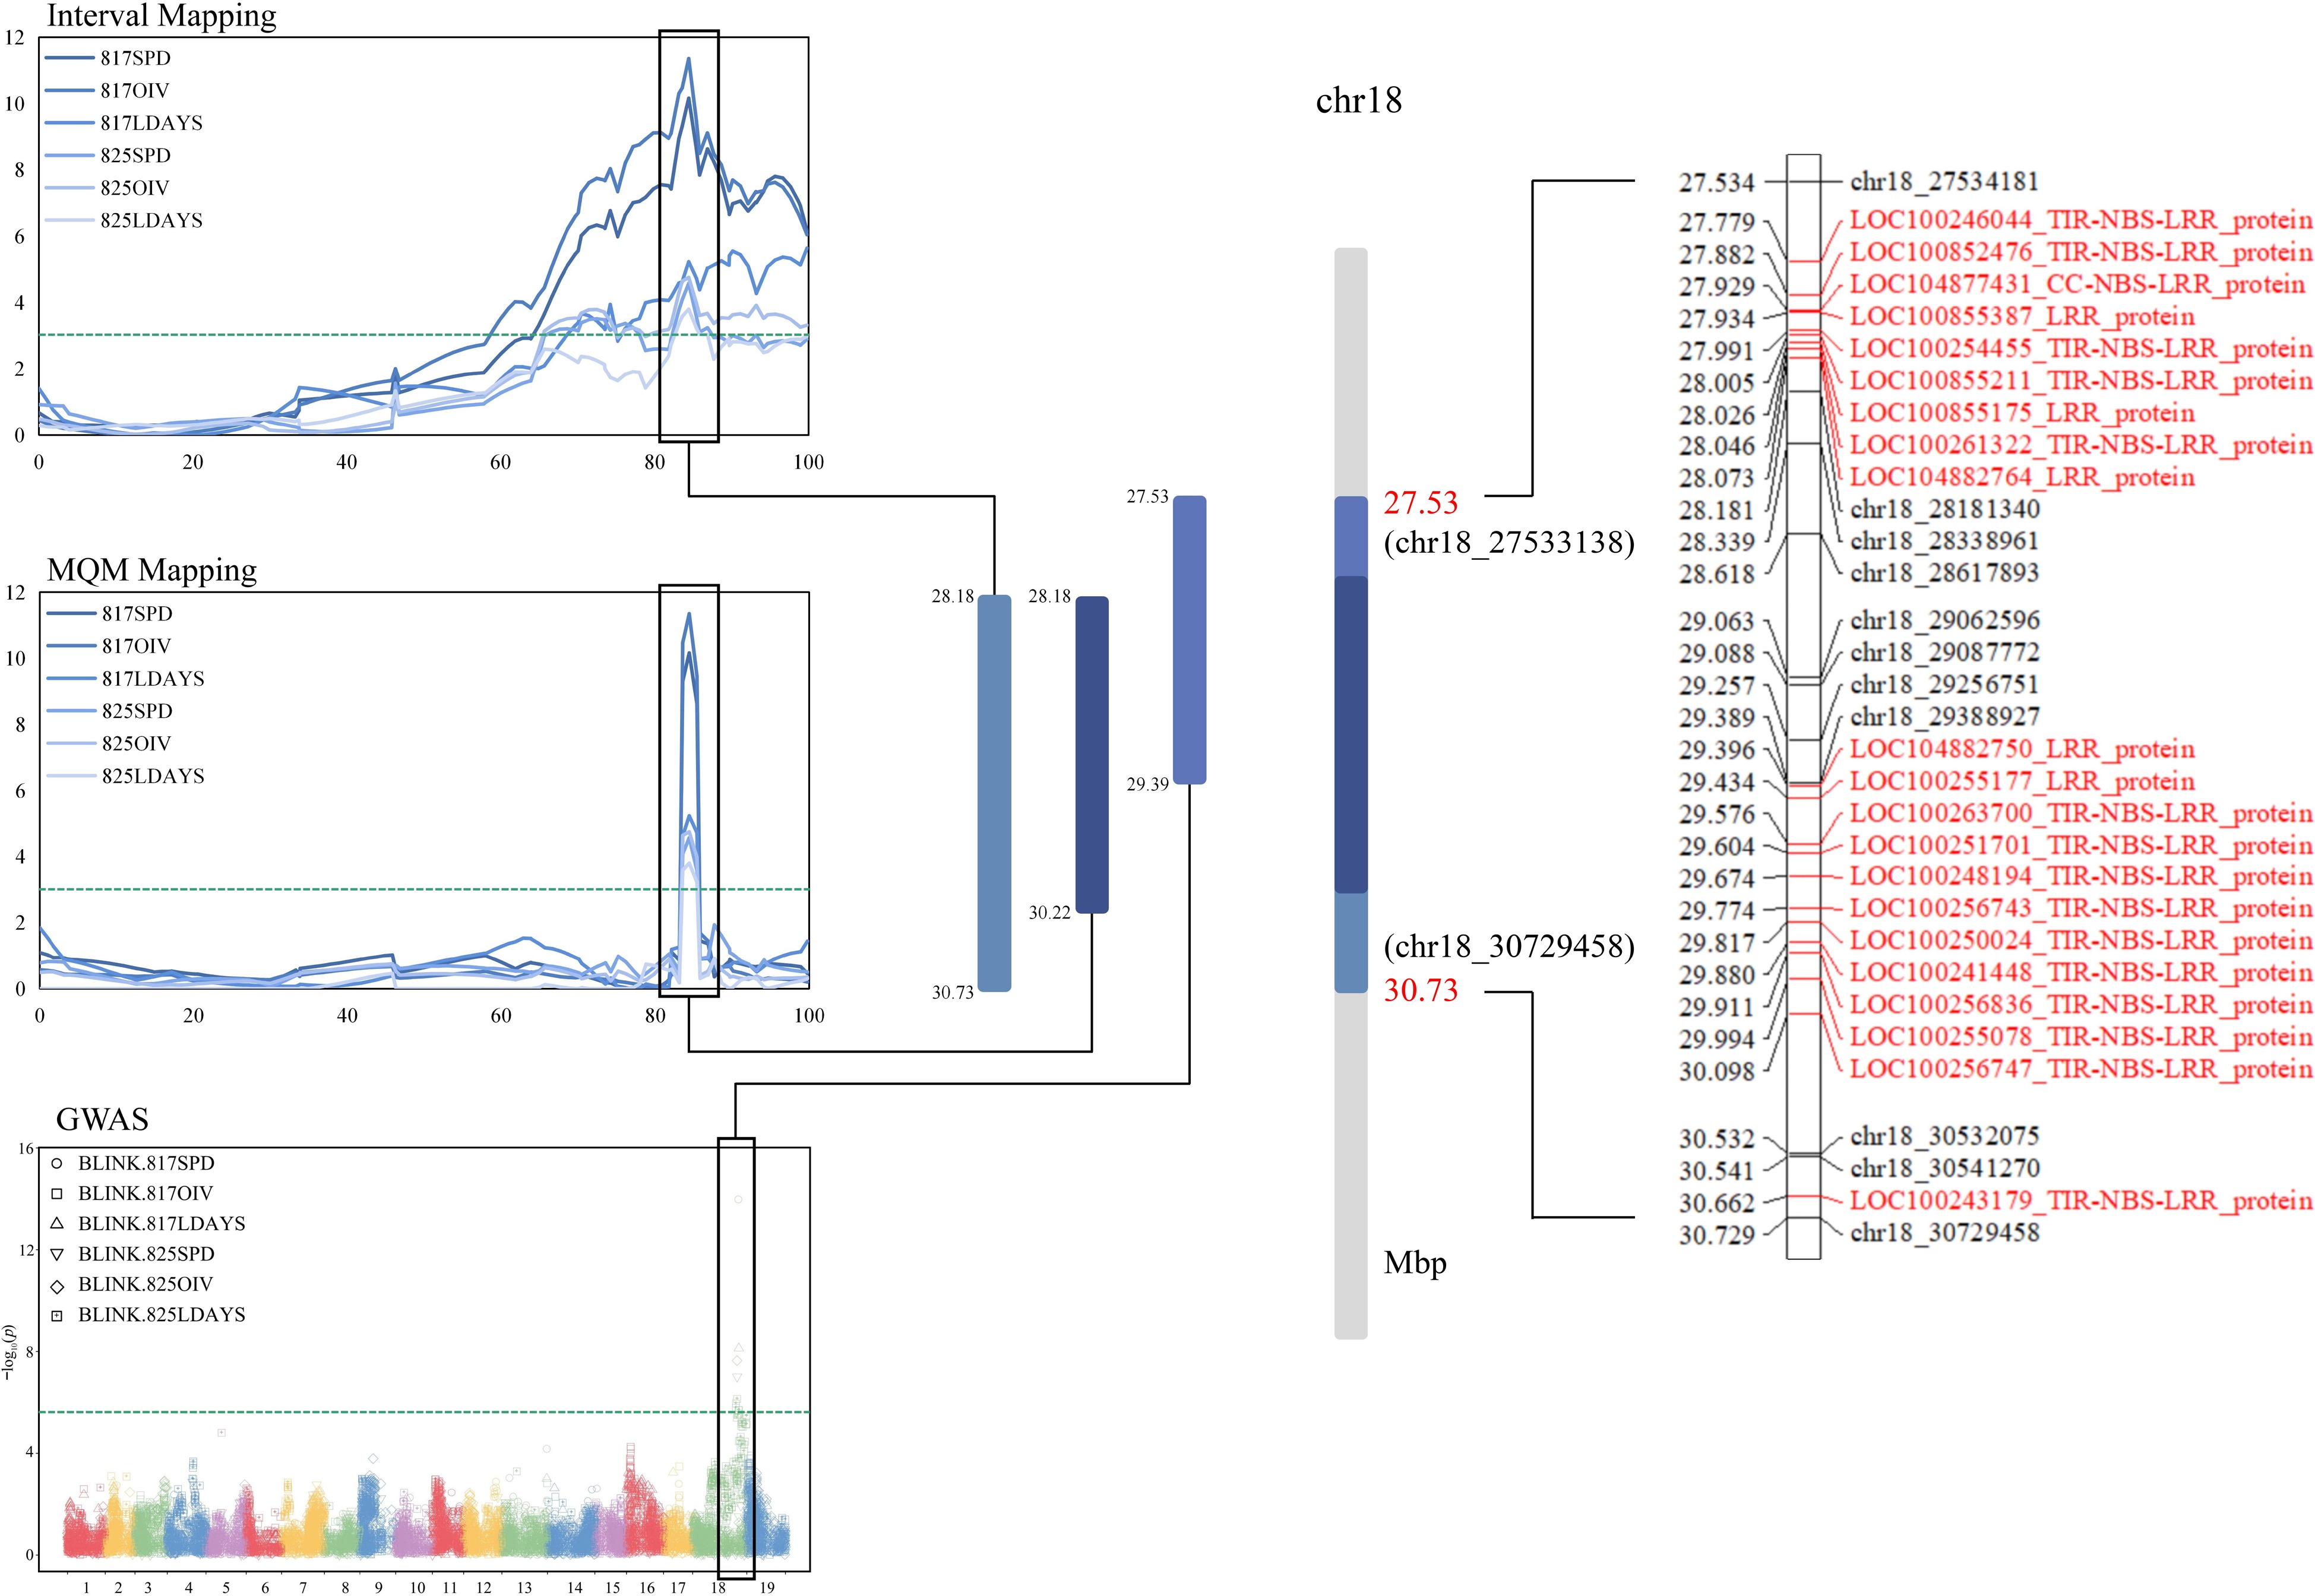
Figure 5.
Joint analysis of QTL and GWAS results. The overlap region is based on the union of IM, MQM and GWAS. Candidate RGAs were selected by reference genome of grape (PN40024). The green lines were threshold (3.0 in MapQTL and 5.7 in GWAS). The RGA in the locus has been marked with red font.
-
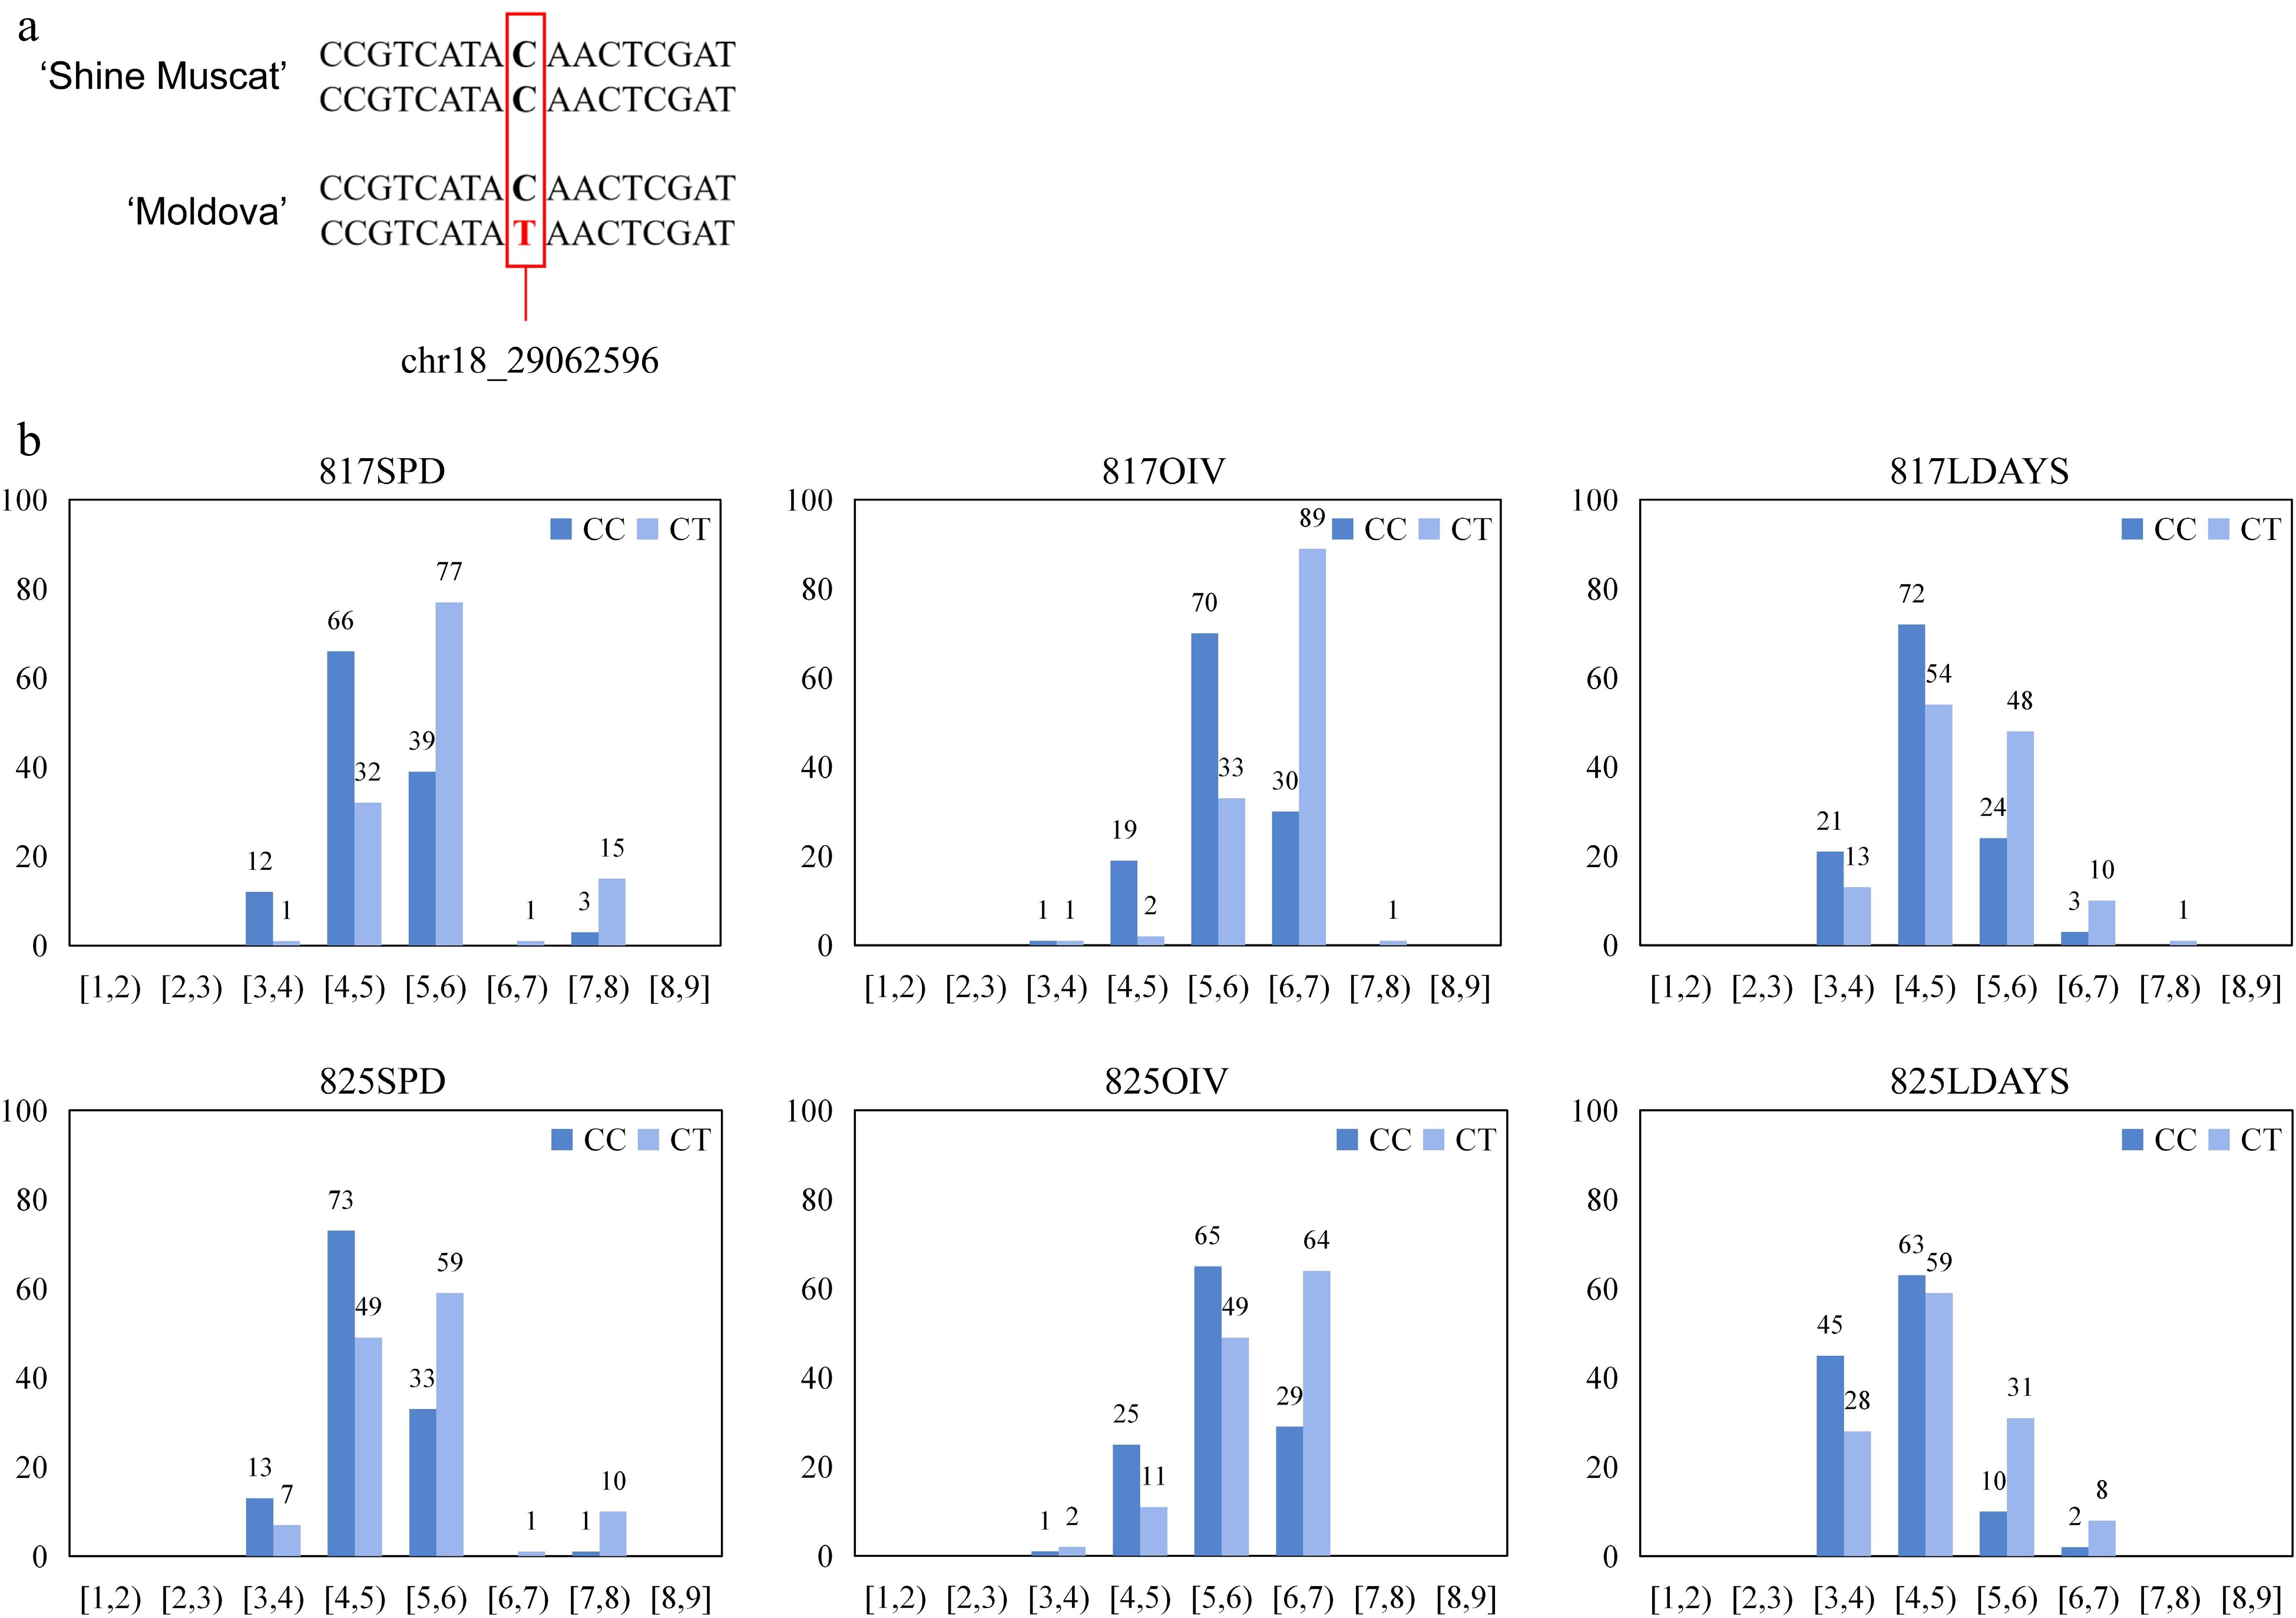
Figure 6.
Analysis of the highest correlation SNP for P. viticola resistance. (a) Base information of 'chr18_29062596' allele and its flanking sequence. (b) Distributions of P. viticola levels among the hybrids were separated by the genotypes of 'chr18_29062596'.
-
LGs Covered length (cM) No. of SNPs Average distance (cM) Max interval (cM) 1 74.31 47 1.58 5.38 2 69.84 44 1.59 11.05 3 64.64 51 1.27 6.04 4 93.67 49 1.91 10.10 5 76.93 40 1.92 7.29 6 91.52 46 1.99 12.71 7 95.74 43 2.23 6.27 8 91.2 47 1.94 13.23 9 69.24 43 1.61 6.11 10 77.53 41 1.89 7.23 11 68.46 40 1.71 7.83 12 82.07 48 1.71 14.67 13 90.96 45 2.02 7.52 14 84.52 41 2.06 6.31 15 65.32 42 1.56 7.06 16 67.41 40 1.69 7.27 17 75.29 39 1.93 15.74 18 99.78 40 2.49 12.48 19 77.56 40 1.94 8.66 Total 1,515.99 826 1.84 15.74 Table 1.
Characteristics of genetic map of hybrid population crosses from 'Moldova' × 'Shine Muscat'.
Figures
(6)
Tables
(1)