-
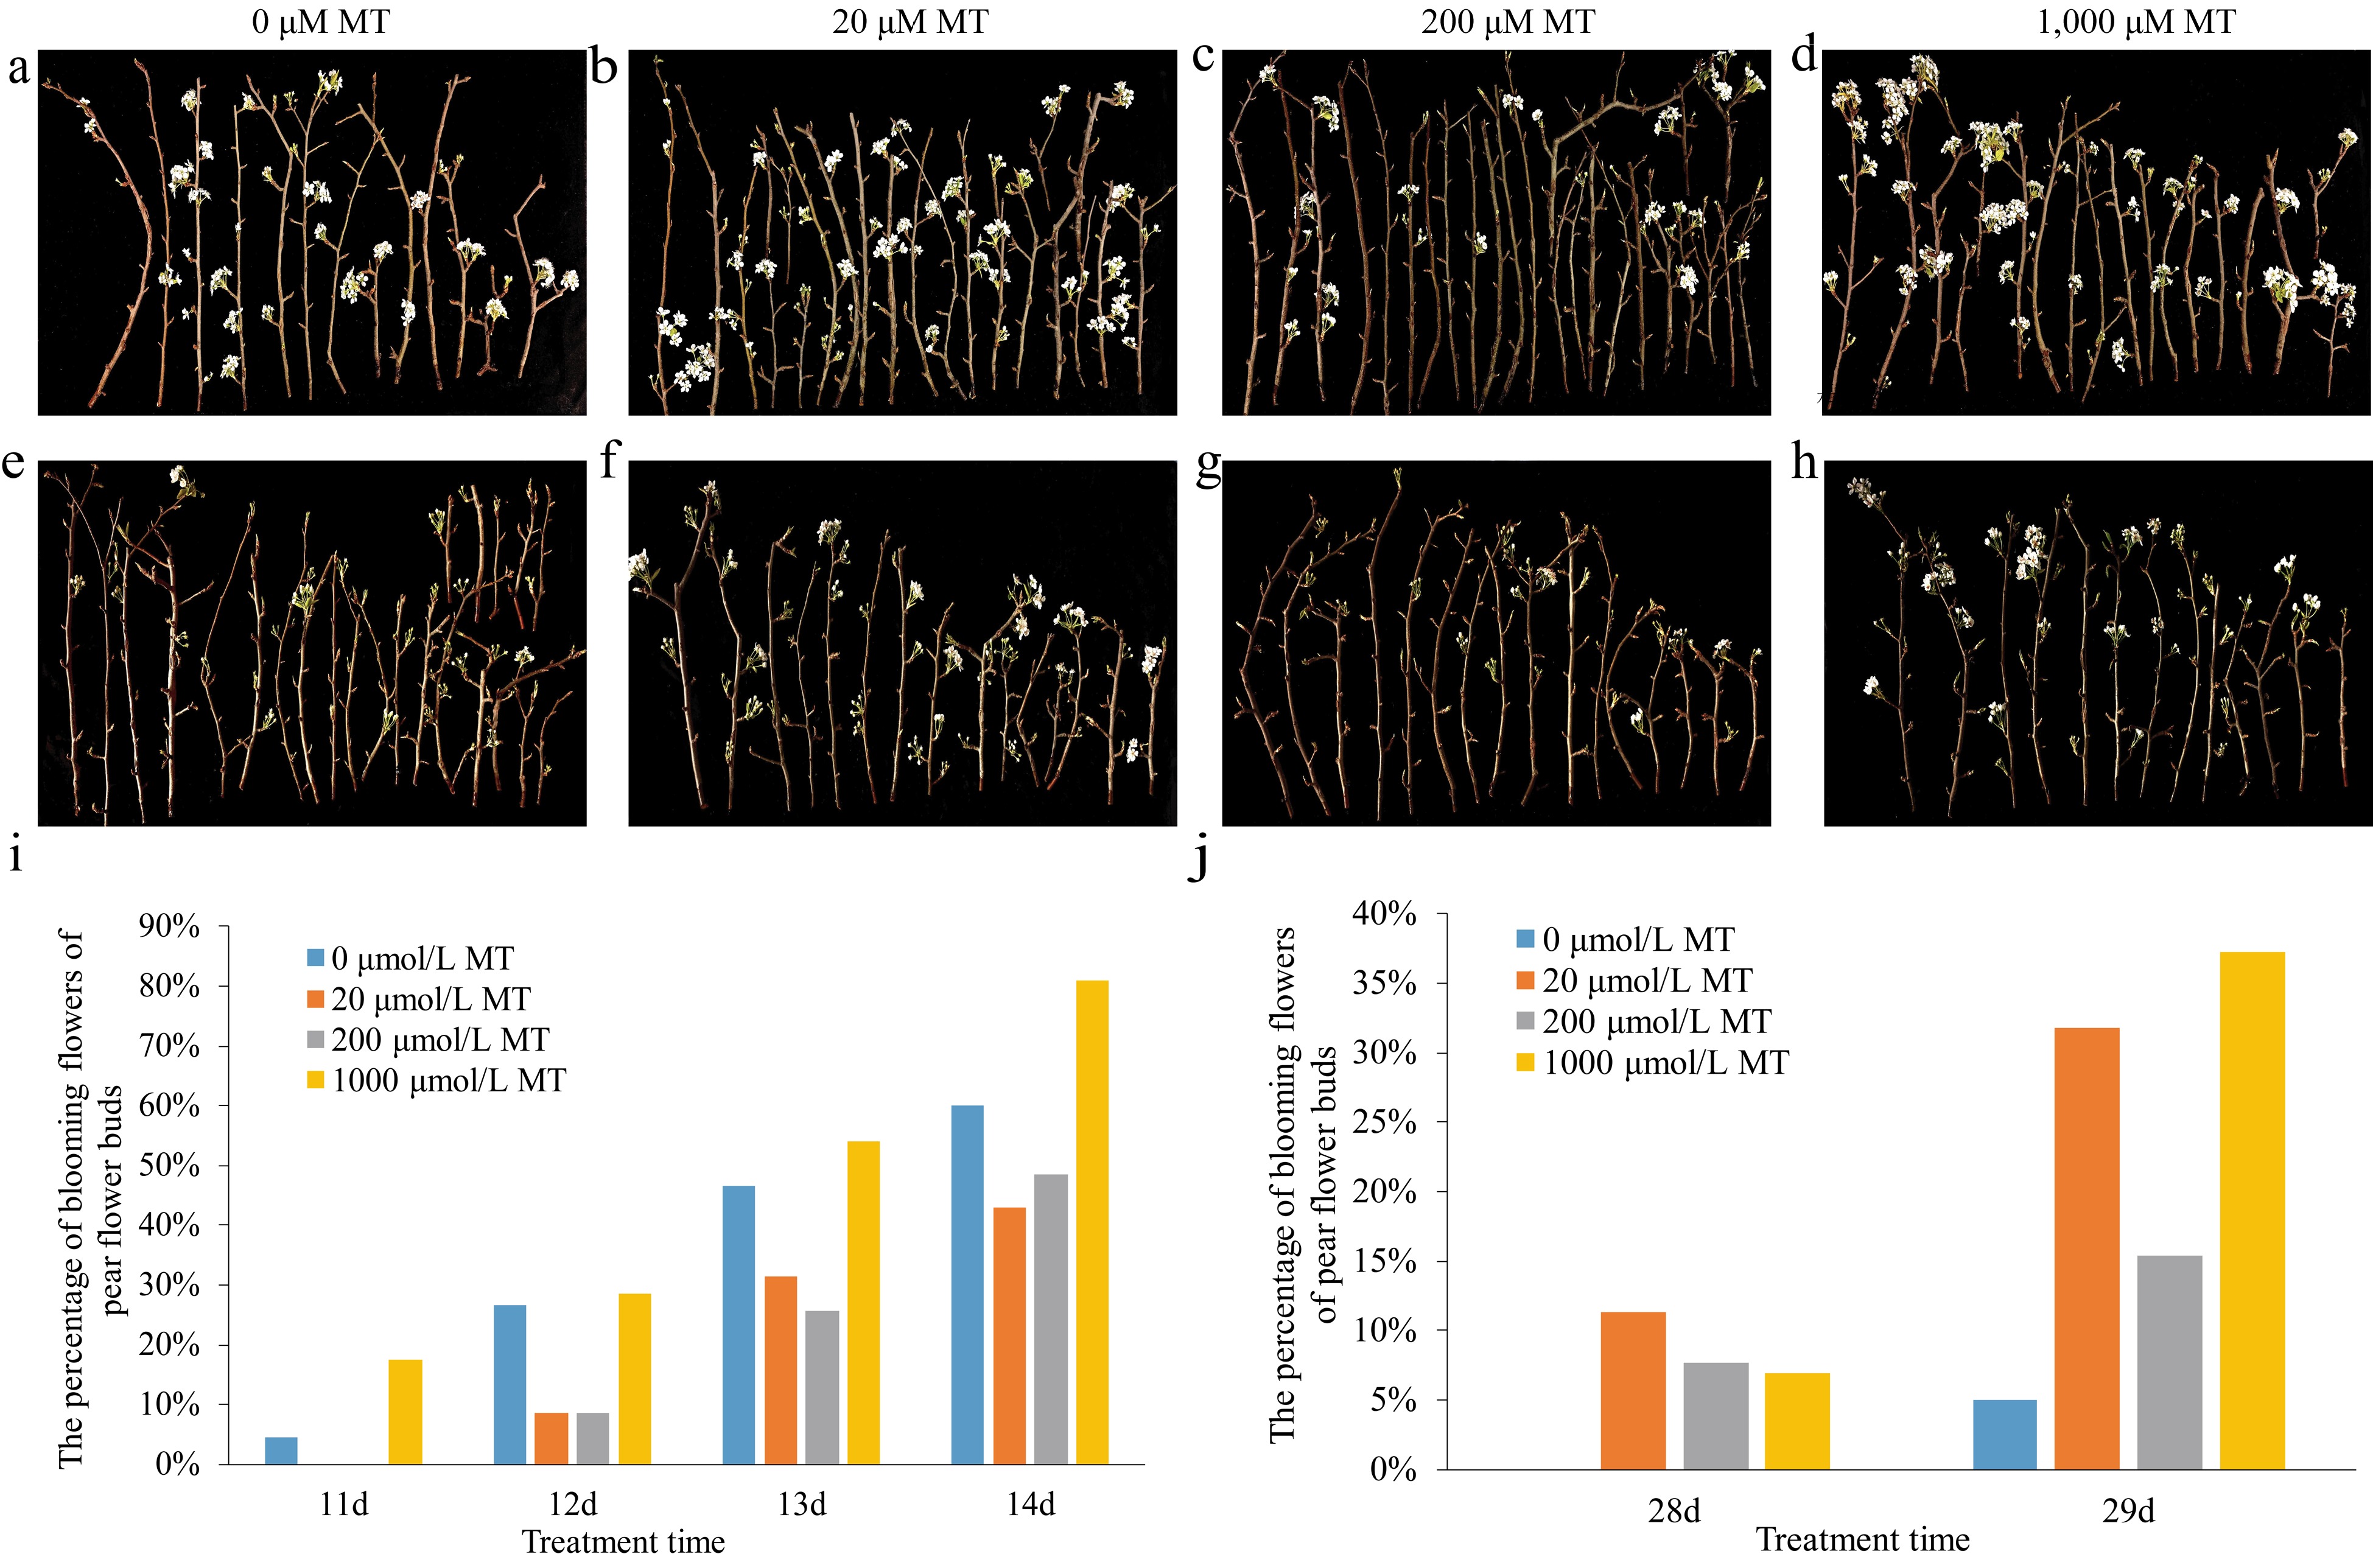
Figure 1.
Effects of exogenous melatonin on the phenotypes of pear flower opening and on the percentage of blooming flowers of pear flower buds at different temperatures. (a)−(d) Phenotypes of pear flower opening at higher temperature. (e)−(h) Phenotypes of pear flowers opening at lower temperature. (i) Percentage of blooming flowers of pear flower buds treated with melatonin of different concentrations at higher temperature. (j) Percentage of blooming flowers of pear flower buds treated with melatonin of different concentrations at lower temperature.
-
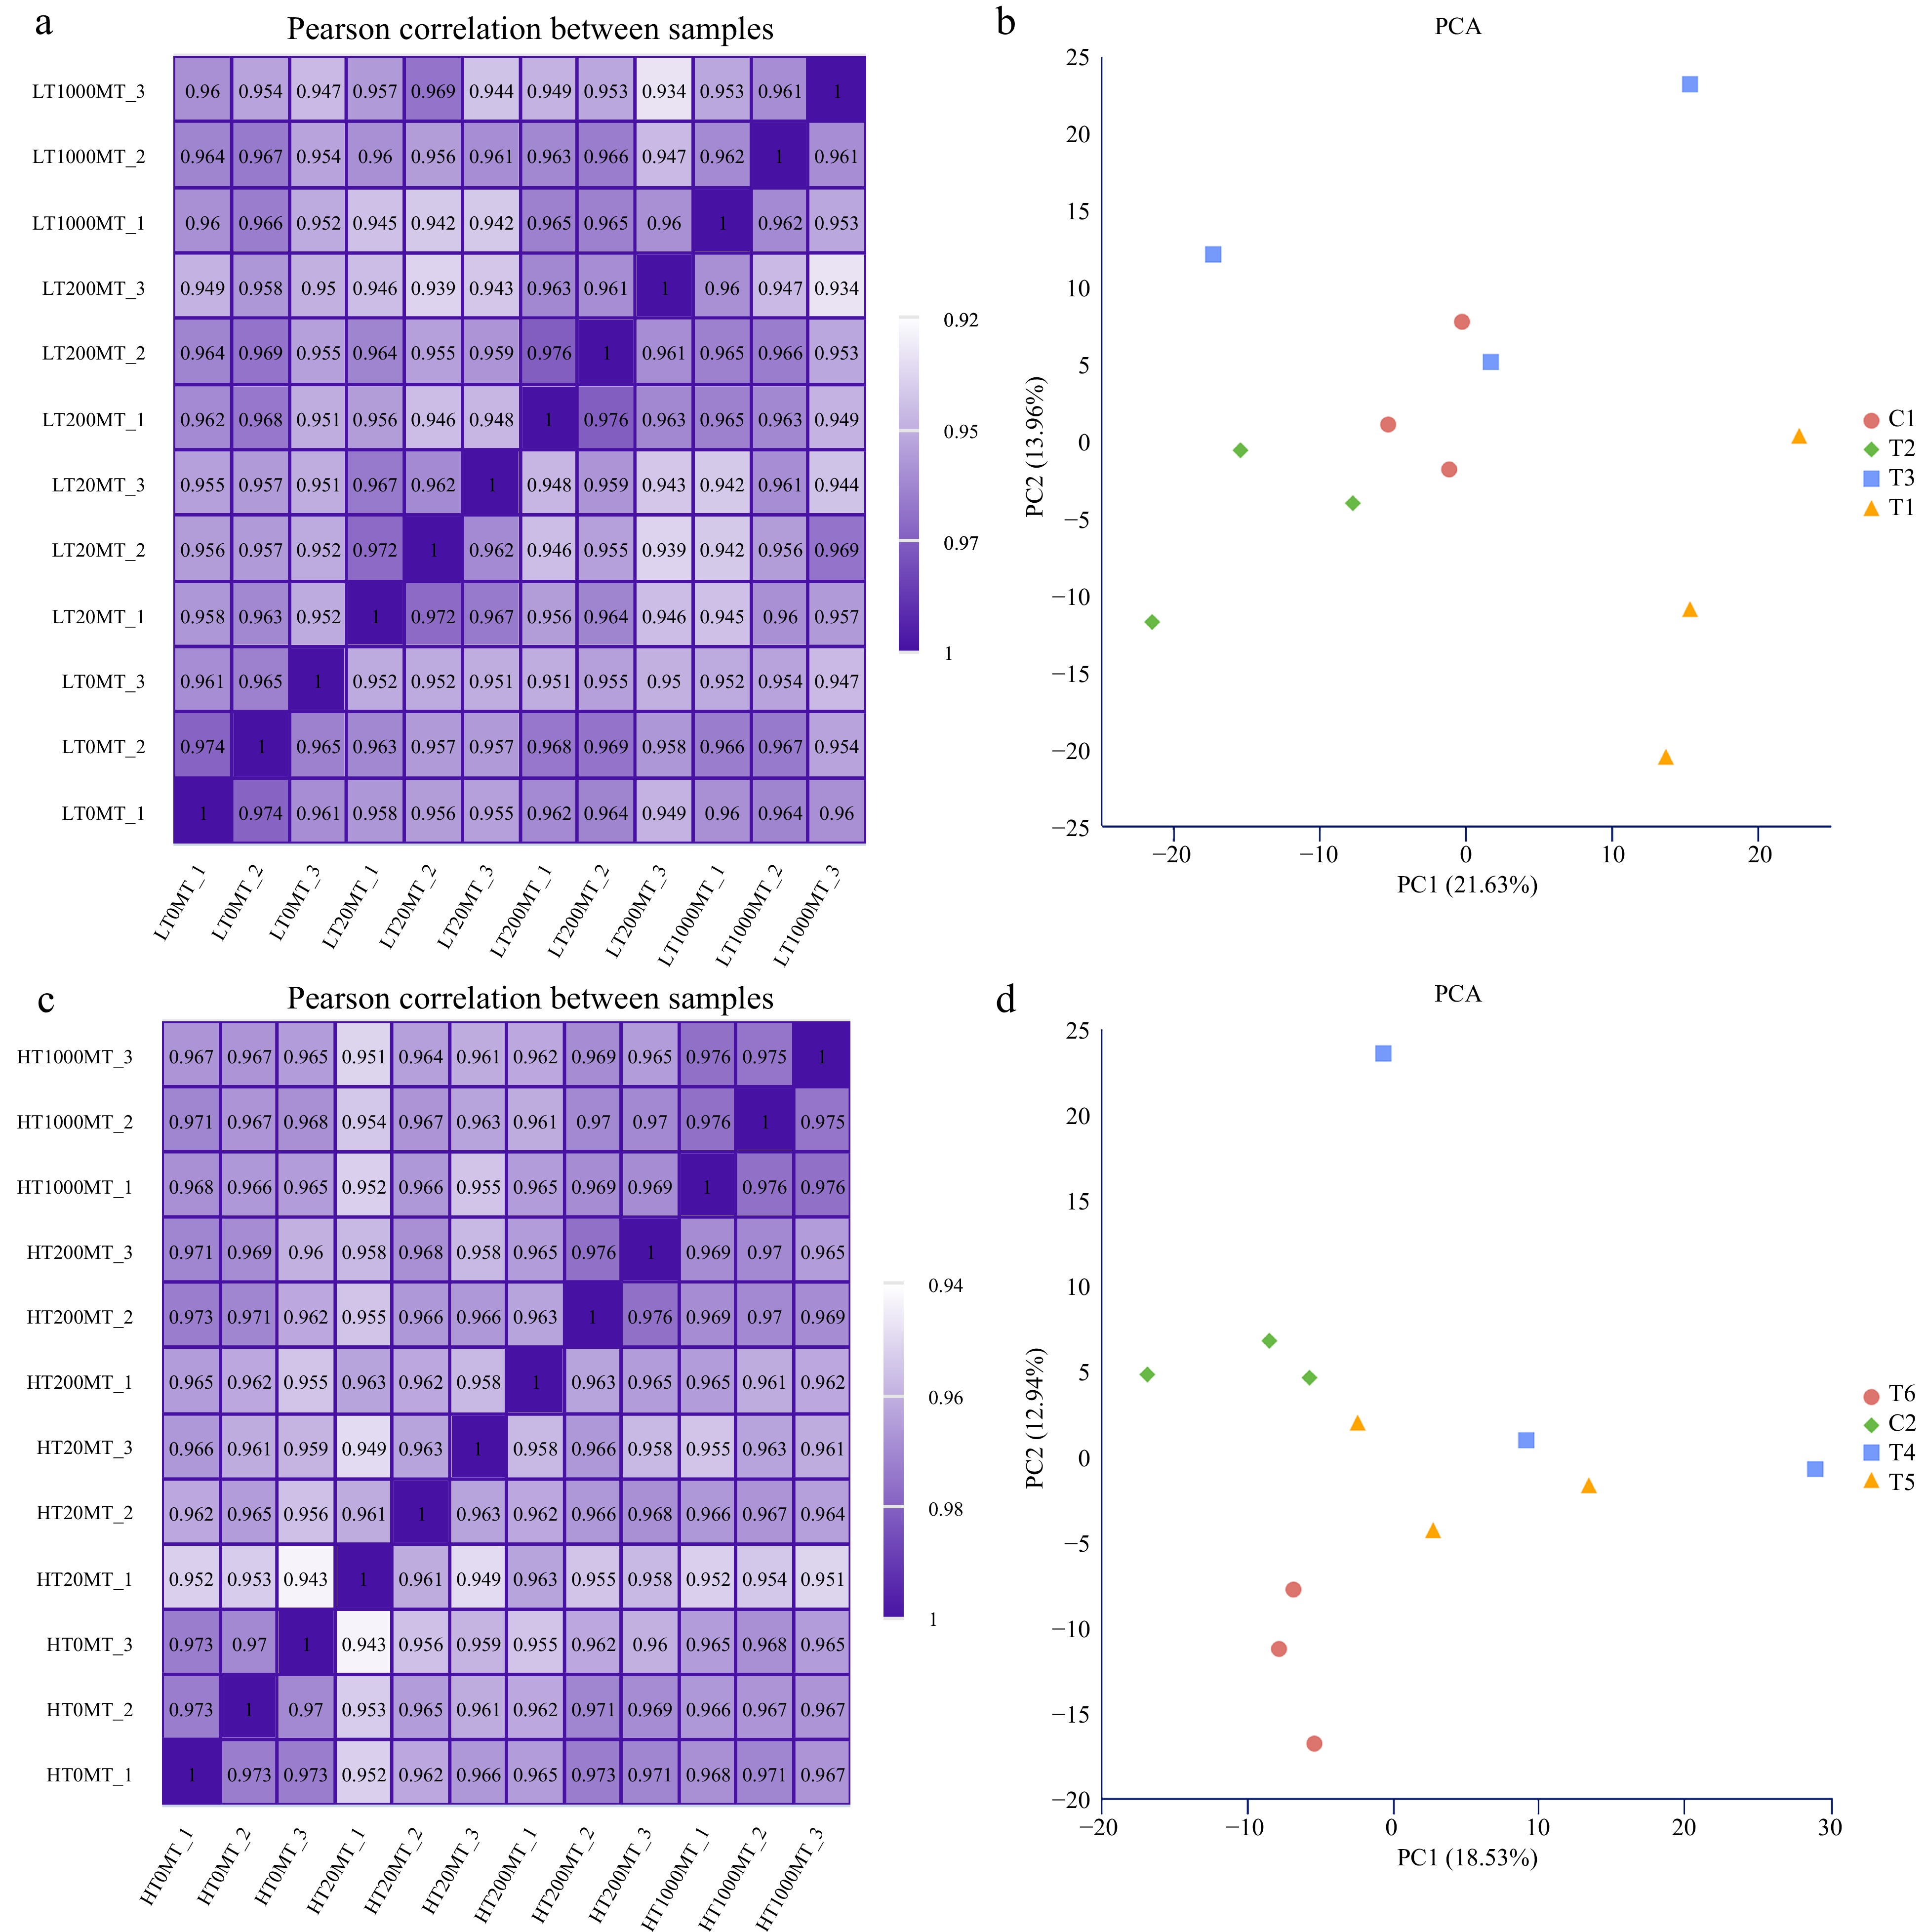
Figure 2.
Overview of transcriptome samples. (a) Pearson correlation analysis heat map of samples treated at lower temperature. (b) Principal component analysis of samples treated at lower temperature. (c) Pearson correlation analysis heat map of samples treated at higher temperature. (d) Principal component analysis of samples treated at higher temperature
-
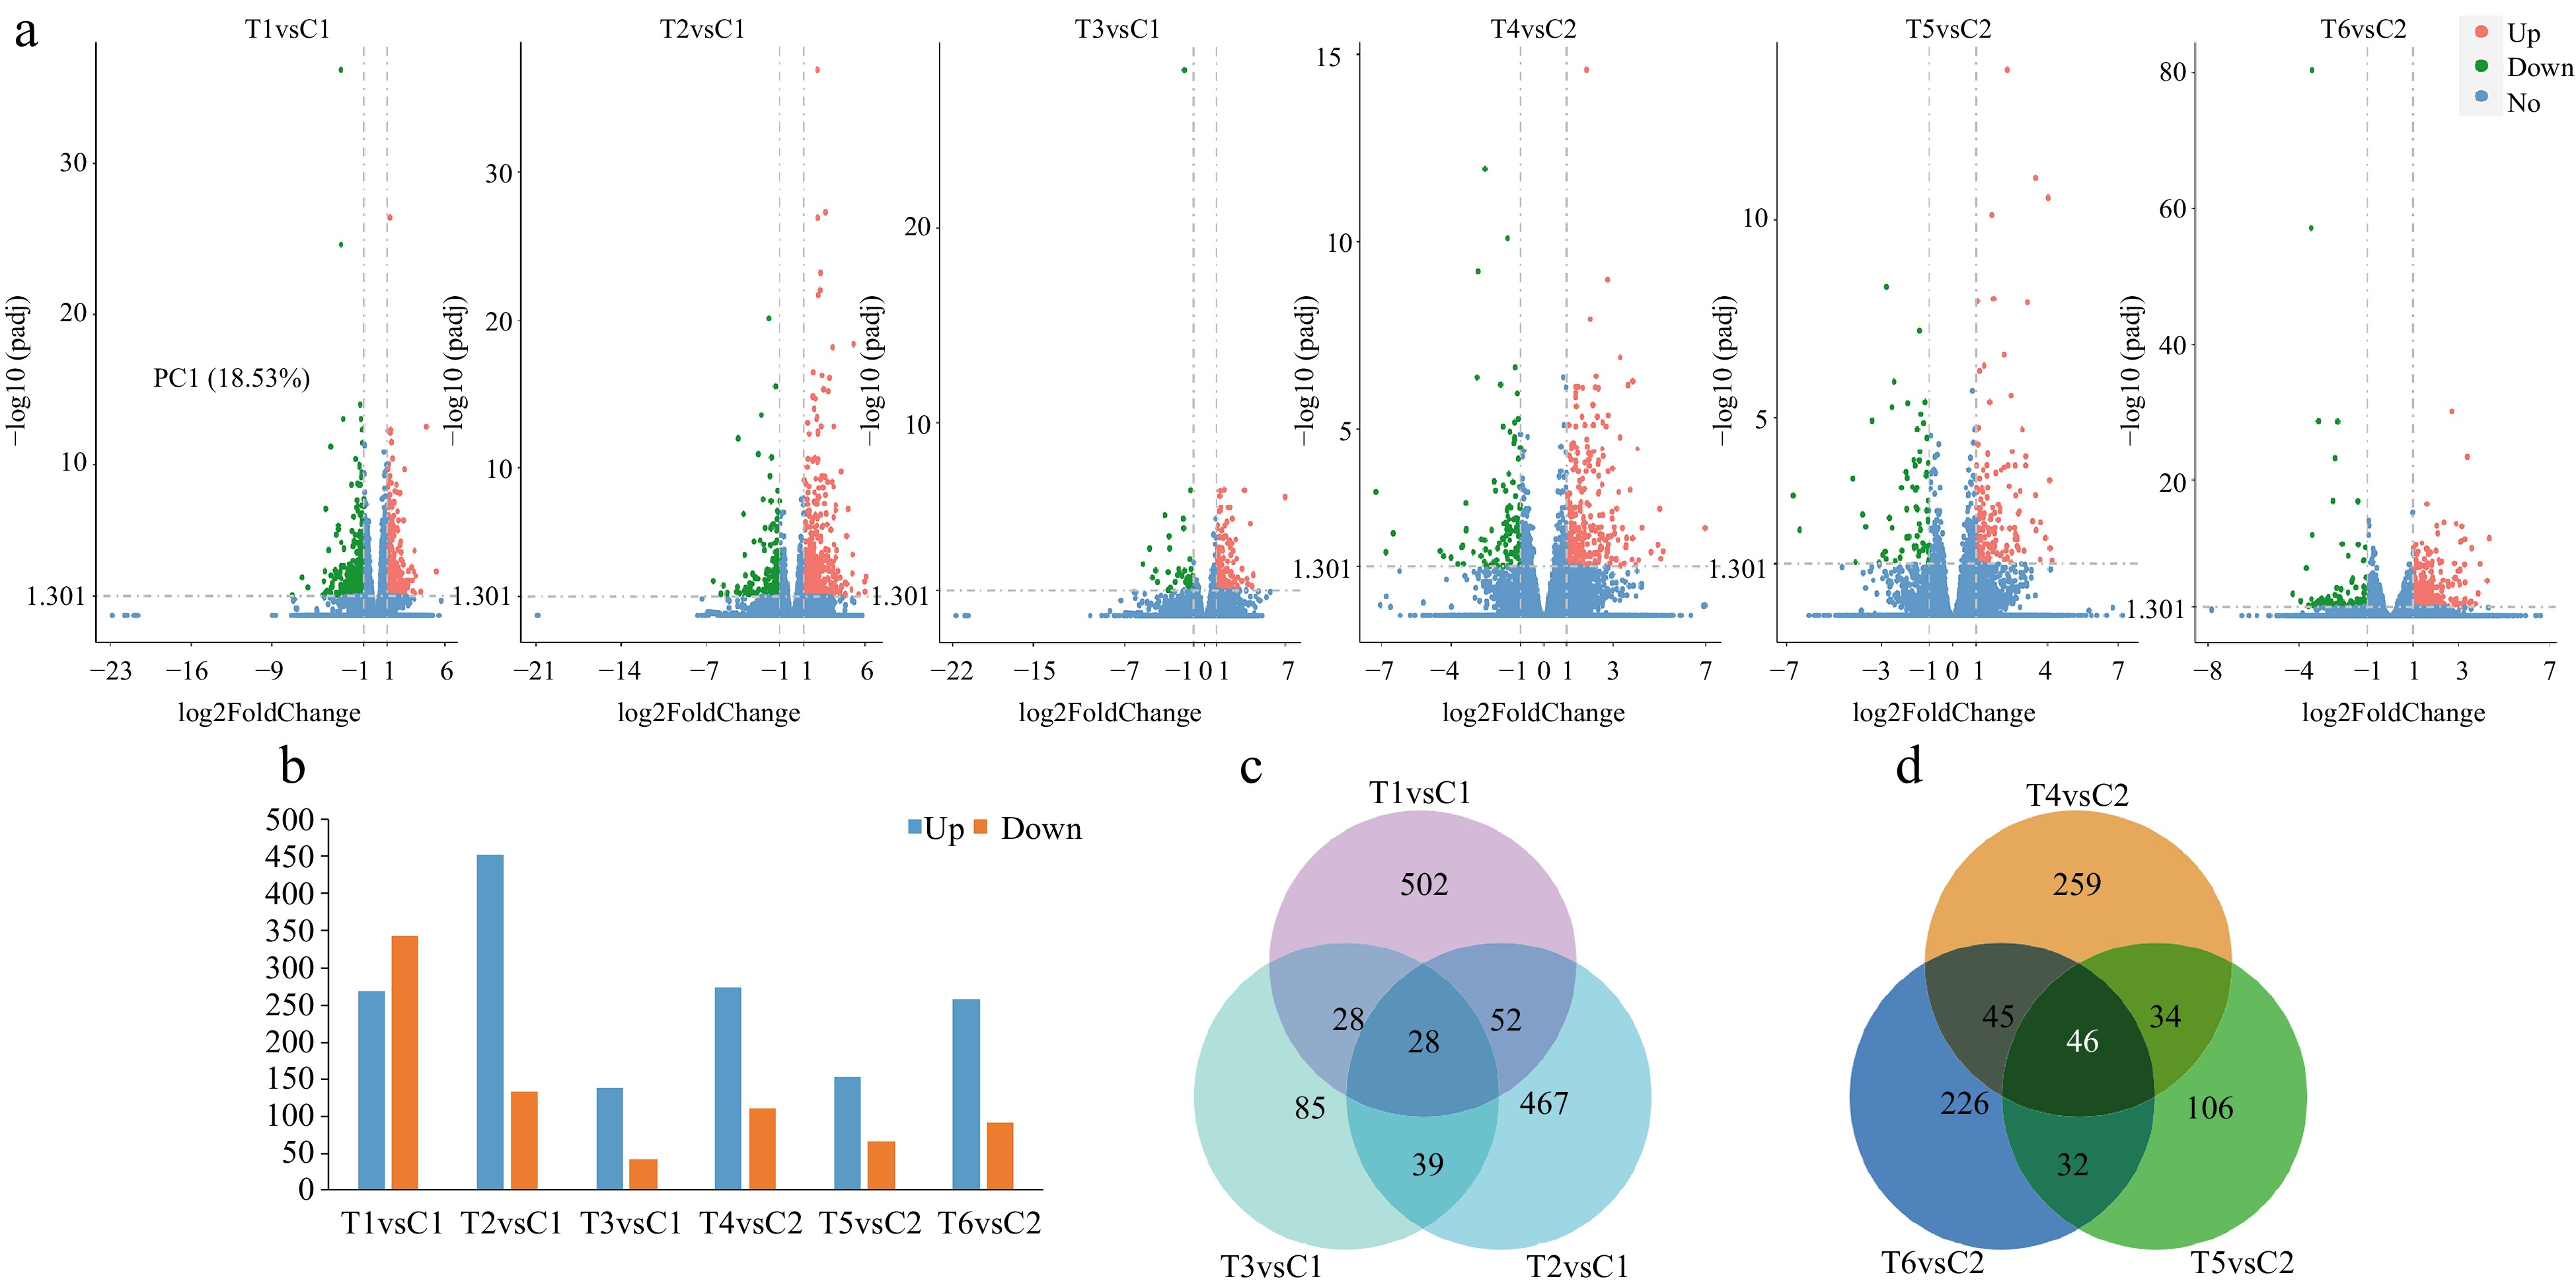
Figure 3.
Identification of the number of differentially expressed genes (DEGs) among different treatments at lower or higher temperatures. (a) The number of DEGs presented by volcanic maps of all the pair treatments. (b) The number of up-regulated and down-regulated DEGs in each pair treatment. (c) DEGs among the three pair treatments presented by a Venn diagram at lower temperature. (d) DEGs among the three pair treatments presented by a Venn diagram at higher temperature.
-
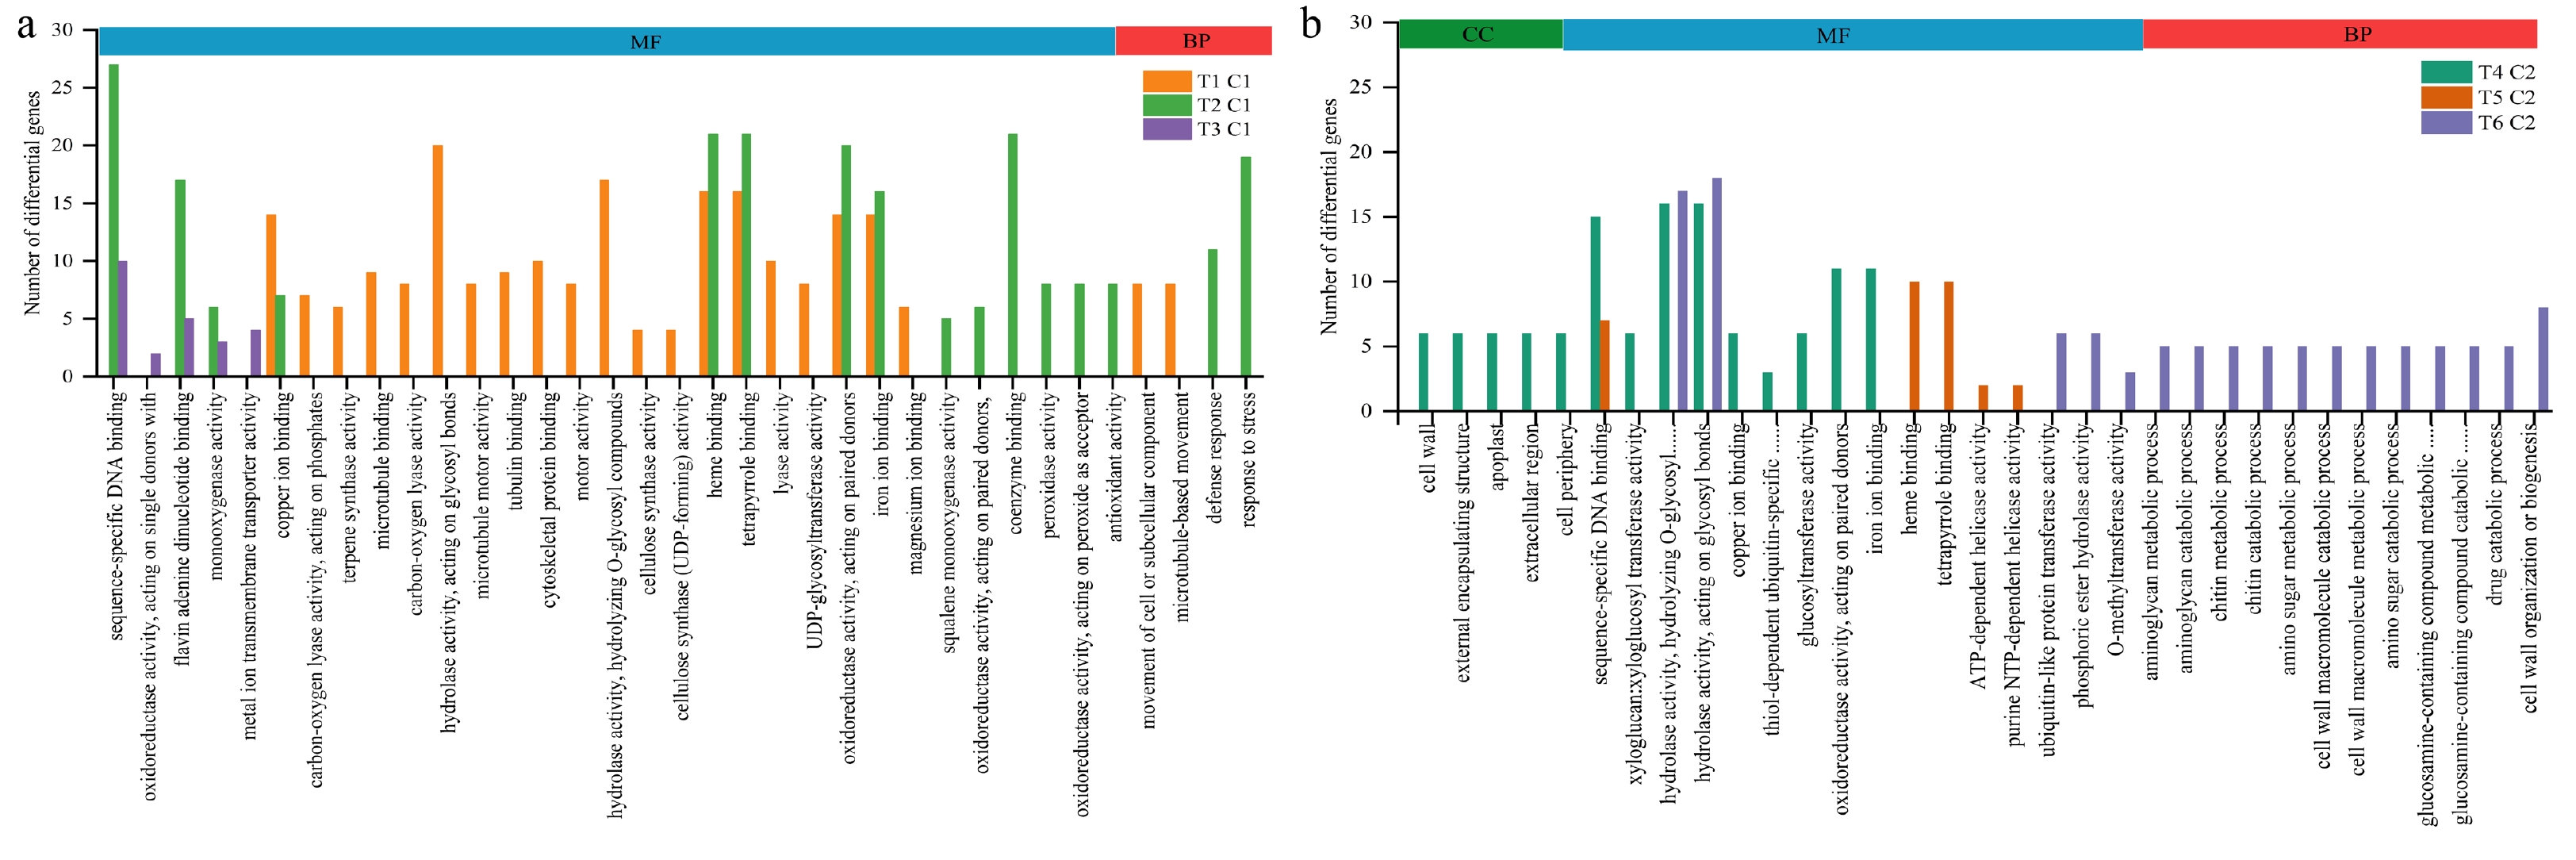
Figure 4.
GO enrichment histogram between groups. (a) Histogram of gene ontology annotation analysis between different paired groups at lower temperature. (b) Histogram of gene ontology annotation analysis between different paired groups at higher temperature.
-
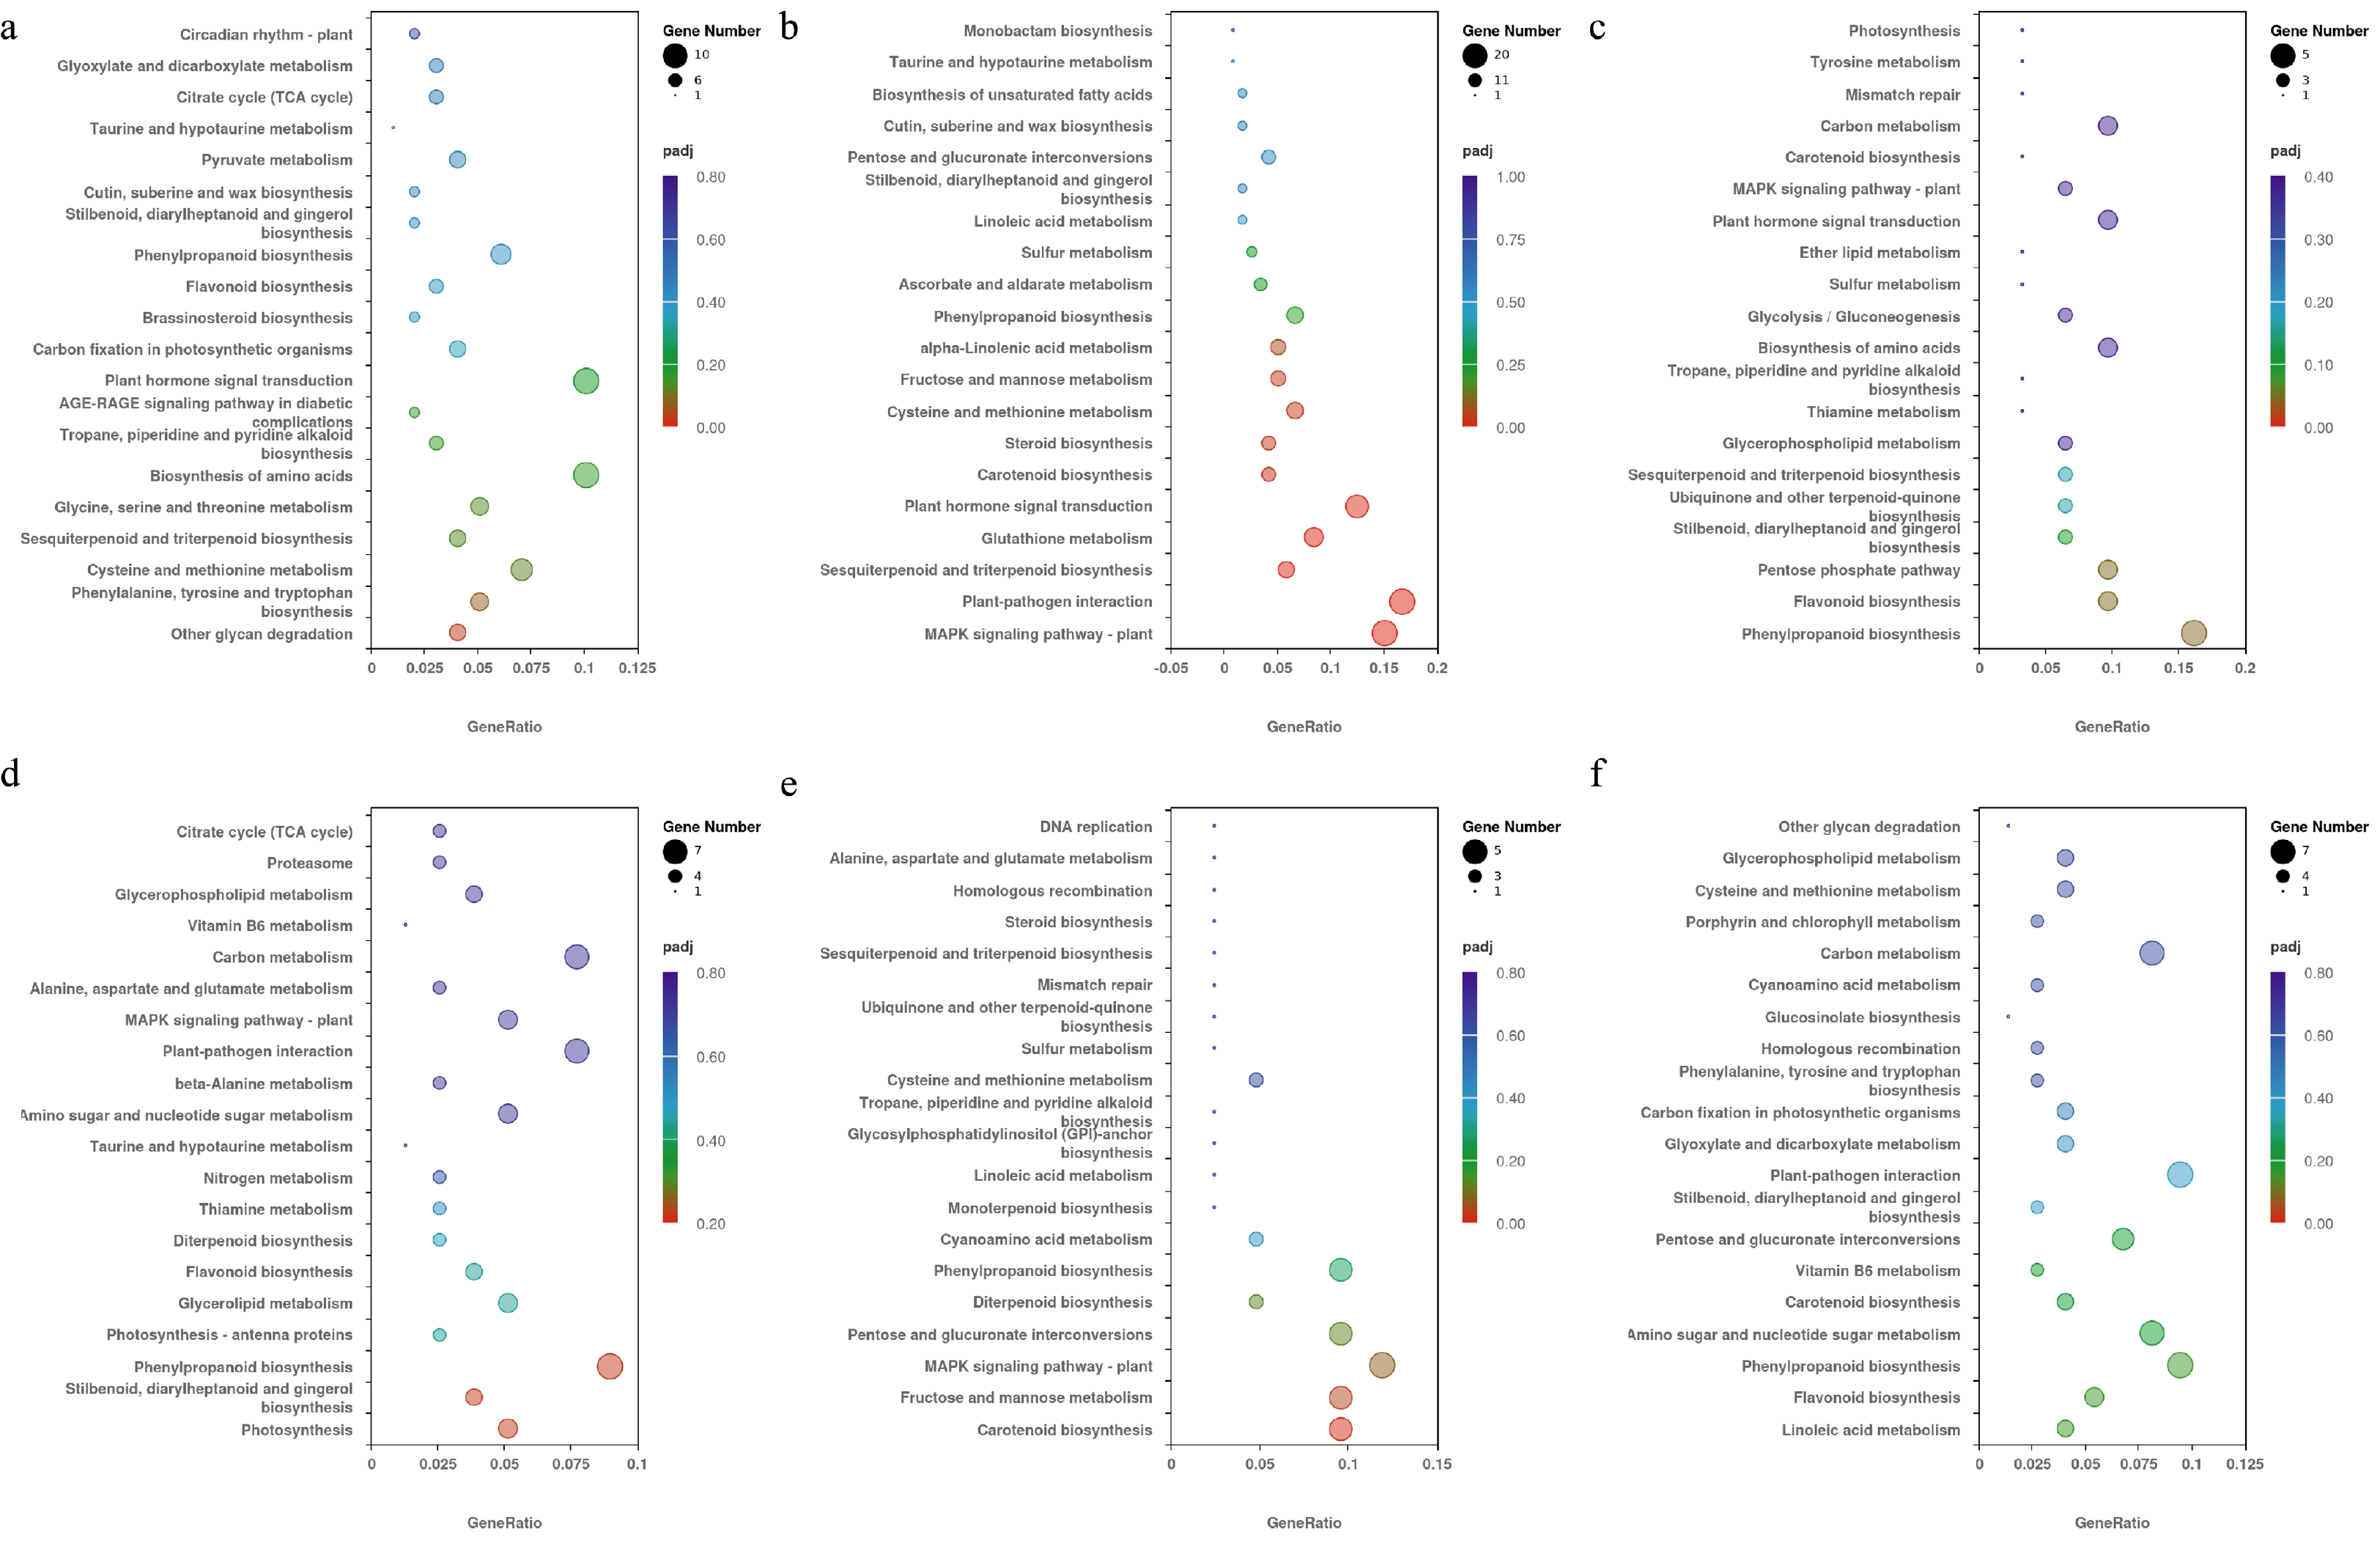
Figure 5.
The top 20 KEGG pathways selected in each pair treatment under different temperature conditions. The vertical axis represents the pathway name, the horizontal axis represents the rich factor, the size of dots represents the number of DEGs, and the padj is reflected by the color of the dots. (a) KEGG enrichment results of the T1 and C1 pair treatment. (b) KEGG enrichment results of the T2 and C1 pair treatment. (c) KEGG enrichment results of the T3 and C1 pair treatment. (d) KEGG enrichment results of the T4 and C2 pair treatment. (e) KEGG enrichment results of the T5 and C2 pair treatment. (f) KEGG enrichment results of the T6 and C2 pair treatment.
-
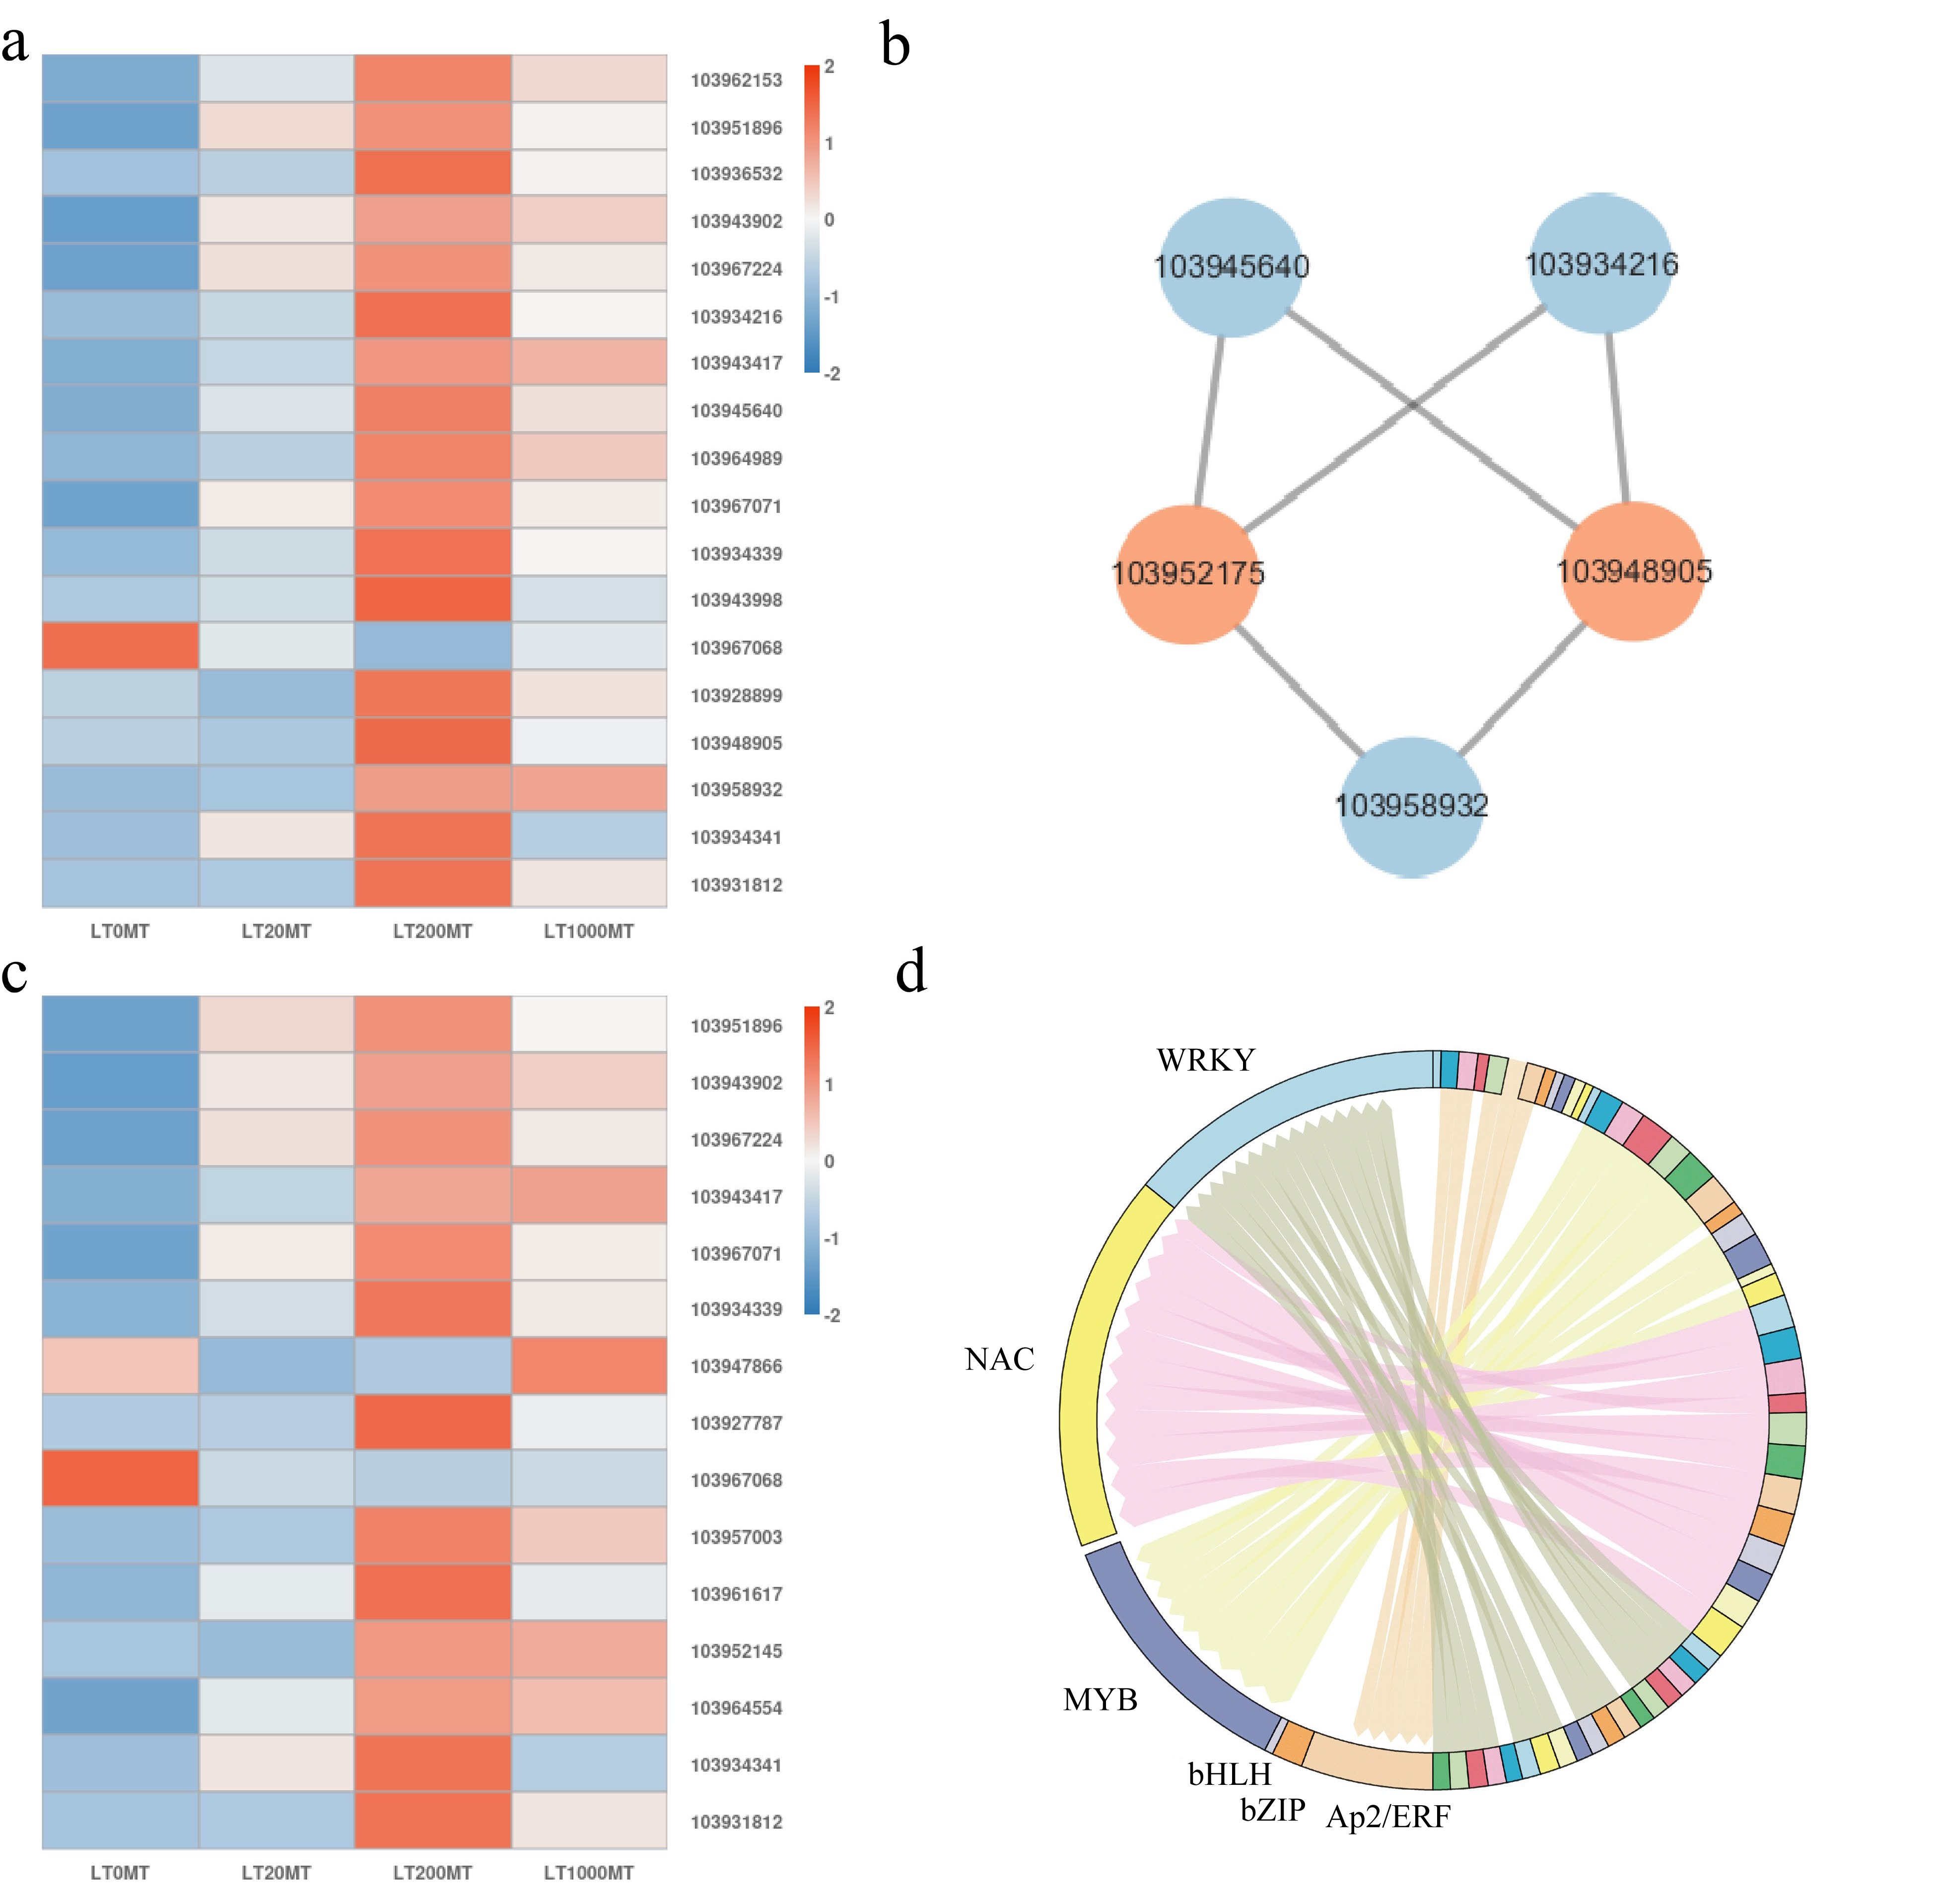
Figure 6.
Analysis of key DEGs in the MAPK signaling pathway and key DEGs in the plant hormone signal transduction pathway at lower temperature. (a) The expression of key DEGs in MAPK pathway in each MT treatment at lower temperature. Red color represents genes that were up-regulated, blue color represents genes that are down-regulated. (b) Analysis of protein interaction network in the MAPK signaling pathway. Orange color indicates the key node proteins. (c) The expression of key DEGs in plant hormone signal transduction pathway in each MT treatment at lower temperature. Red color represents genes that were up-regulated, blue color represents genes that are down-regulated. (d) Distribution map of expressed transcription factor families.
-
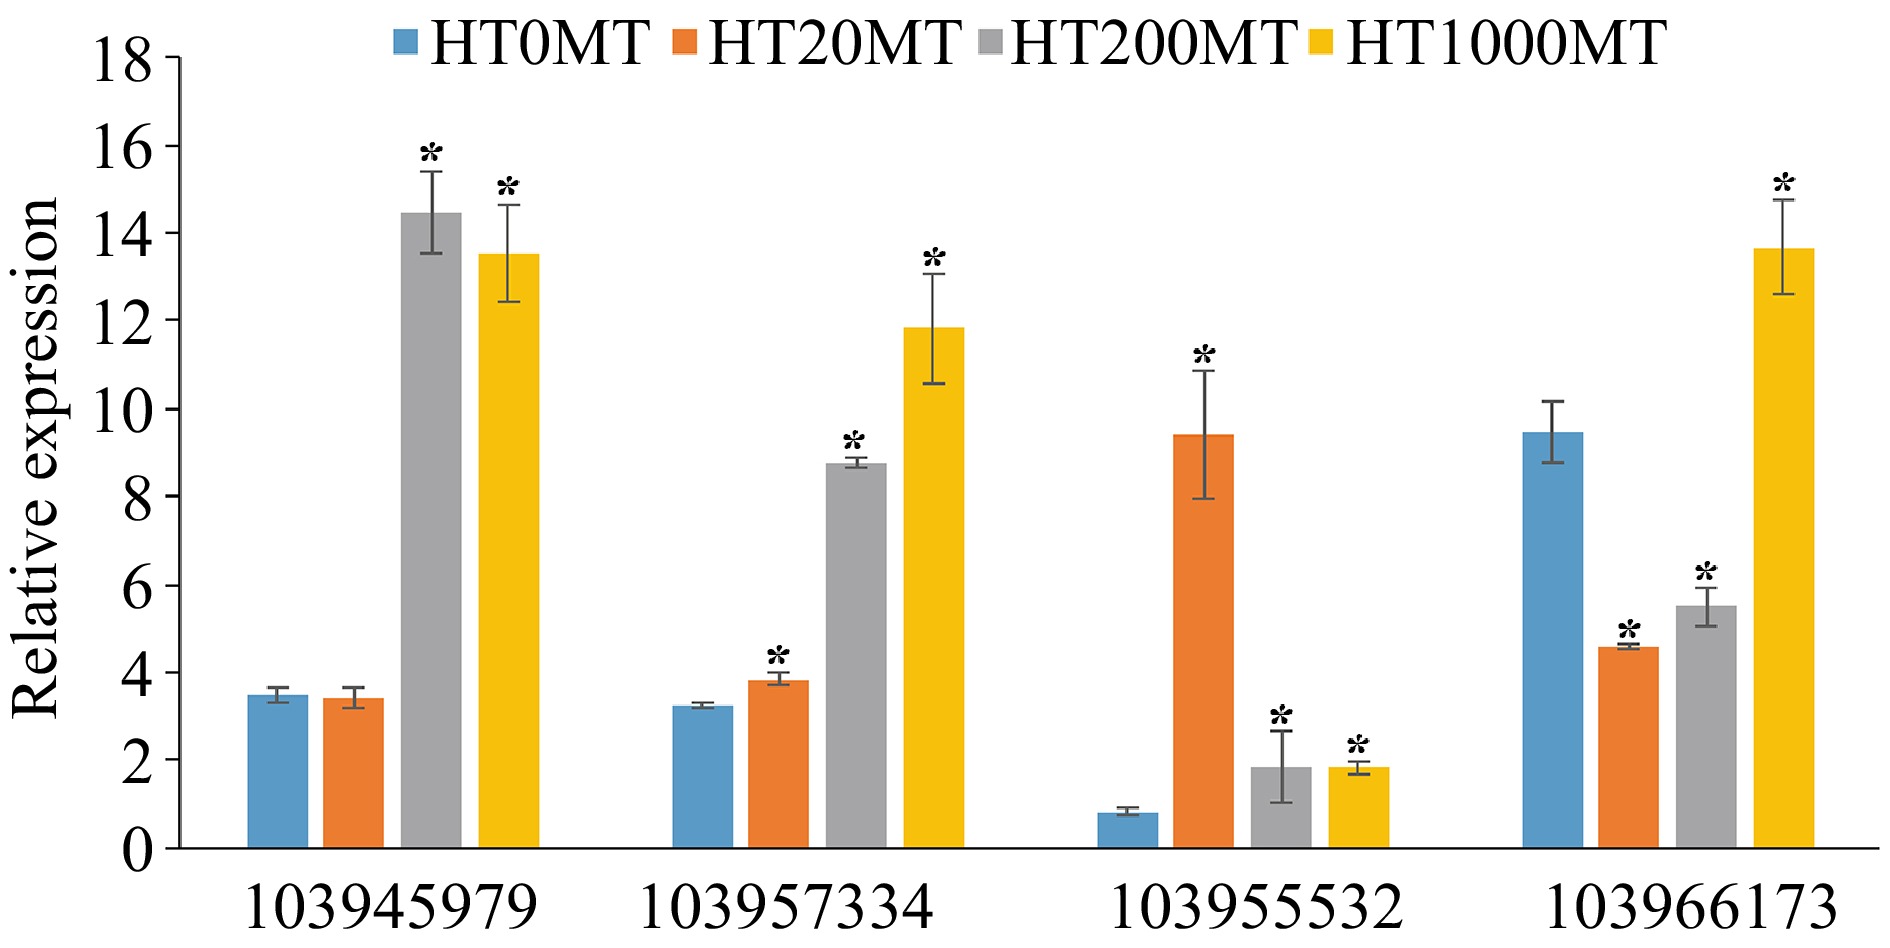
Figure 7.
Analysis of key DEGs in the carotenoid biosynthesis pathway at higher temperature.* indicates significant difference of melatonin treatments and the control at the level of p < 0.05 .
-
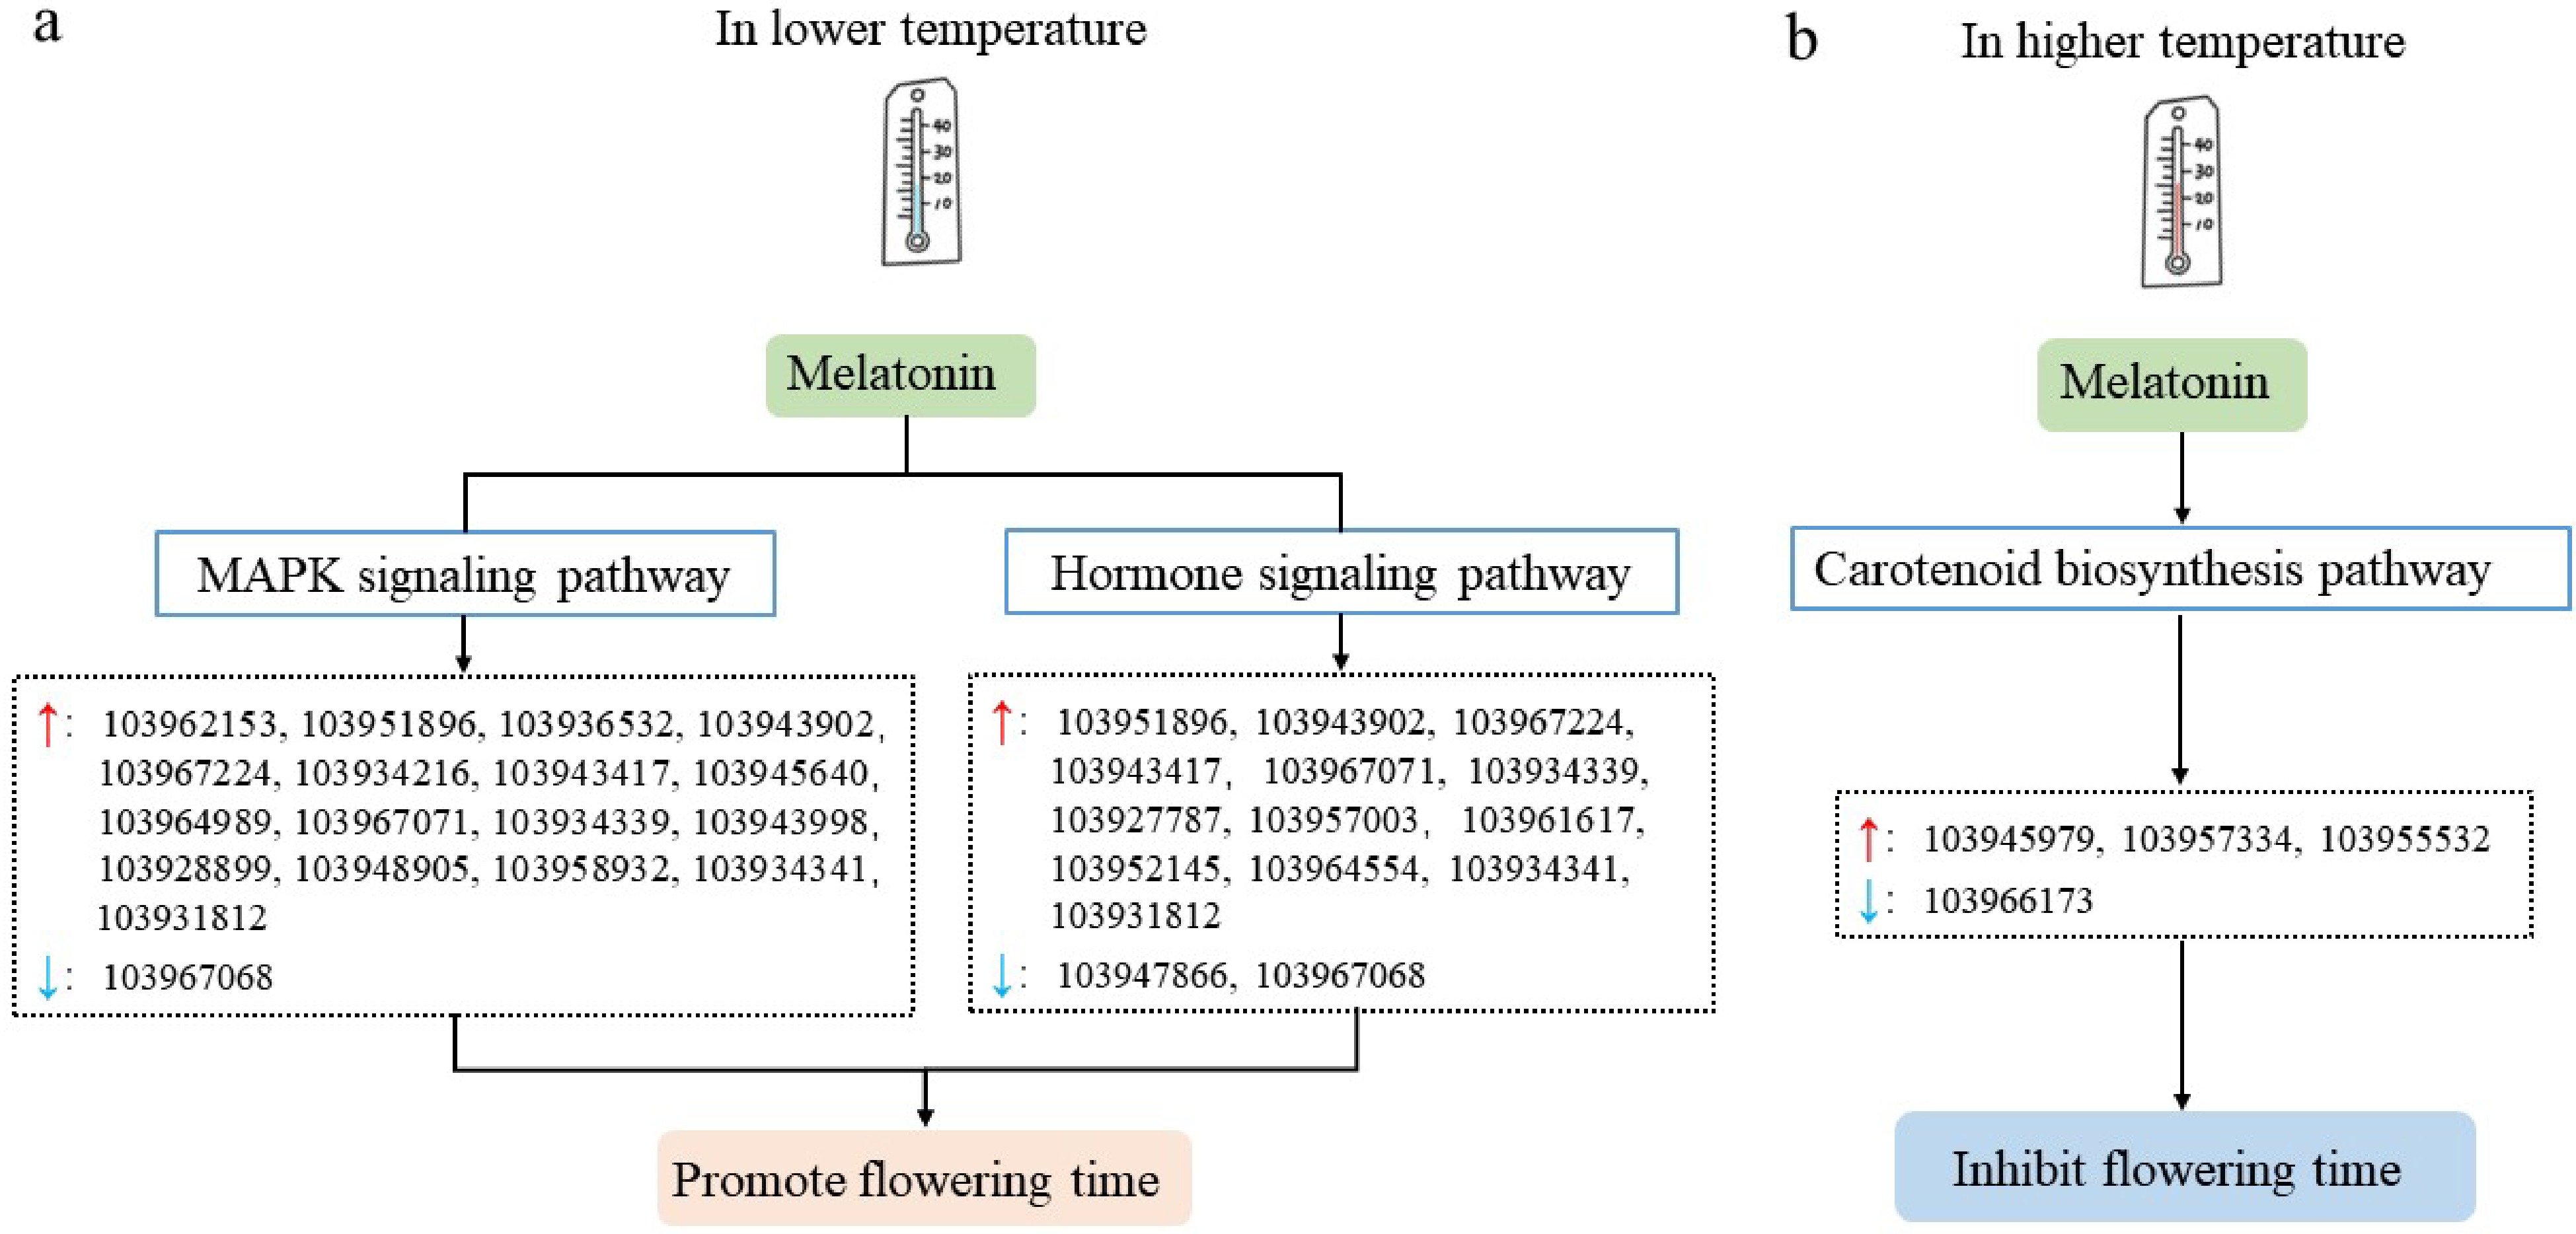
Figure 8.
Possible models of temperature regulating flower opening time of pear trees mediated by melatonin. (a) Possible model of lower temperature regulating flower opening of pear trees mediated by melatonin. (b) Possible model of higher temperature regulating the flower opening of pear trees mediated by melatonin. The red and blue arrows in the figure represent up-regulated and down-regulated genes, respectively.
-
Treatment For short Lower temperature 0 μM MT LT0MT/C1 Lower temperature 20 μM MT LT20MT/T1 Lower temperature 200 μM MT LT200MT/T2 Lower temperature 1,000 μM MT L1000MT/T3 Higher temperature 0 μM MT HT0MT/C2 Higher temperature 20 μM MT HT20MT/T4 Higher temperature 200 μM MT HT200MT/T5 Higher temperature 1,000 μM MT HT1000MT/T6 Table 1.
Abbreviation of treatments.
-
Sample name Raw reads Clean reads Error rate (%) Q30 (%) GC content (%) Totally mapped Uniquely mapped Multiply mapped LT0MT_1 45376380 42089770 0.03 91.04 46.6 31666403 (75.24%) 28492724 (67.7%) 3173679 (7.54%) LT0MT_2 45642494 42429602 0.03 91.11 46.52 31994379 (75.41%) 28796309 (67.87%) 3198070 (7.54%) LT0MT_3 45812786 42265088 0.03 91.07 46.1 31770080 (75.17%) 28550358 (67.55%) 3219722 (7.62%) LT20MT_1 47489338 43254962 0.03 90.69 46.18 32449256 (75.02%) 29181097 (67.46%) 3268159 (7.56%) LT20MT_2 43425150 43401266 0.03 91.05 45.91 32573551 (75.05%) 29281799 (67.47%) 3291752 (7.58%) LT20MT_3 47105020 43394650 0.03 91.37 45.73 32448323 (74.77%) 29144520 (67.16%) 3303803 (7.61%) LT200MT_1 47028322 42885636 0.03 91.41 46.86 32314164 (75.35%) 29108032 (67.87%) 3206132 (7.48%) LT200MT_2 43503838 40451958 0.03 91.36 46.71 30742956 (76.0%) 27718099 (68.52%) 3024857 (7.48%) LT200MT_3 45575134 44650838 0.03 91.44 45.83 33217002 (74.39%) 29980747 (67.14%) 3236255 (7.25%) LT1000MT_1 45608544 42495922 0.03 91.09 46.66 32213740 (75.8%) 29014971 (68.28%) 3198769 (7.53%) LT1000MT_2 45958846 42224230 0.03 91.5 46.7 32114925 (76.06%) 28903515 (68.45%) 3211410 (7.61%) LT1000MT_3 46473566 43339082 0.03 91.27 46.67 33094122 (76.36%) 29776377 (68.71%) 3317745 (7.66%) HT0MT_1 45585694 42855438 0.03 91.34 46.79 32656181 (76.2%) 29409597 (68.63%) 3246584 (7.58%) HT0MT_2 45681974 42470110 0.03 91.2 46.57 32172572 (75.75%) 28951951 (68.17%) 3220621 (7.58%) HT0MT_3 45689636 42546130 0.03 91.32 46.44 32467536 (76.31%) 29255193 (68.76%) 3212343 (7.55%) HT20MT_1 45437946 42202504 0.03 91.59 46.15 32012196 (75.85%) 28789190 (68.22%) 3223006 (7.64%) HT20MT_2 45988544 42166356 0.03 91.4 46.66 32085055 (76.09%) 28867058 (68.46%) 3217997 (7.63%) HT20MT_3 41341860 41314718 0.03 91.77 46.23 31266650 (75.68%) 28082053 (67.97%) 3184597 (7.71%) HT200MT_1 40061596 40034130 0.03 91.56 46.39 30155808 (75.33%) 27045352 (67.56%) 3110456 (7.77%) HT200MT_2 47272476 43304868 0.03 91.51 46.79 32909417 (75.99%) 29649710 (68.47%) 3259707 (7.53%) HT200MT_3 45753458 42453906 0.03 90.76 47.12 32169239 (75.77%) 28946909 (68.18%) 3222330 (7.59%) HT1000MT_1 47435372 44737438 0.03 90.78 46.79 33326901 (74.49%) 29947184 (66.94%) 3379717 (7.55%) HT1000MT_2 45217172 41766868 0.03 91.44 46.7 31516015 (75.46%) 28376285 (67.94%) 3139730 (7.52%) HT1000MT_3 45458140 42680252 0.03 91.46 46.82 32142173 (75.31%) 28923726 (67.77%) 3218447 (7.54%) Table 2.
Statistical analysis of transcriptome sequencing data.
Figures
(8)
Tables
(2)