-
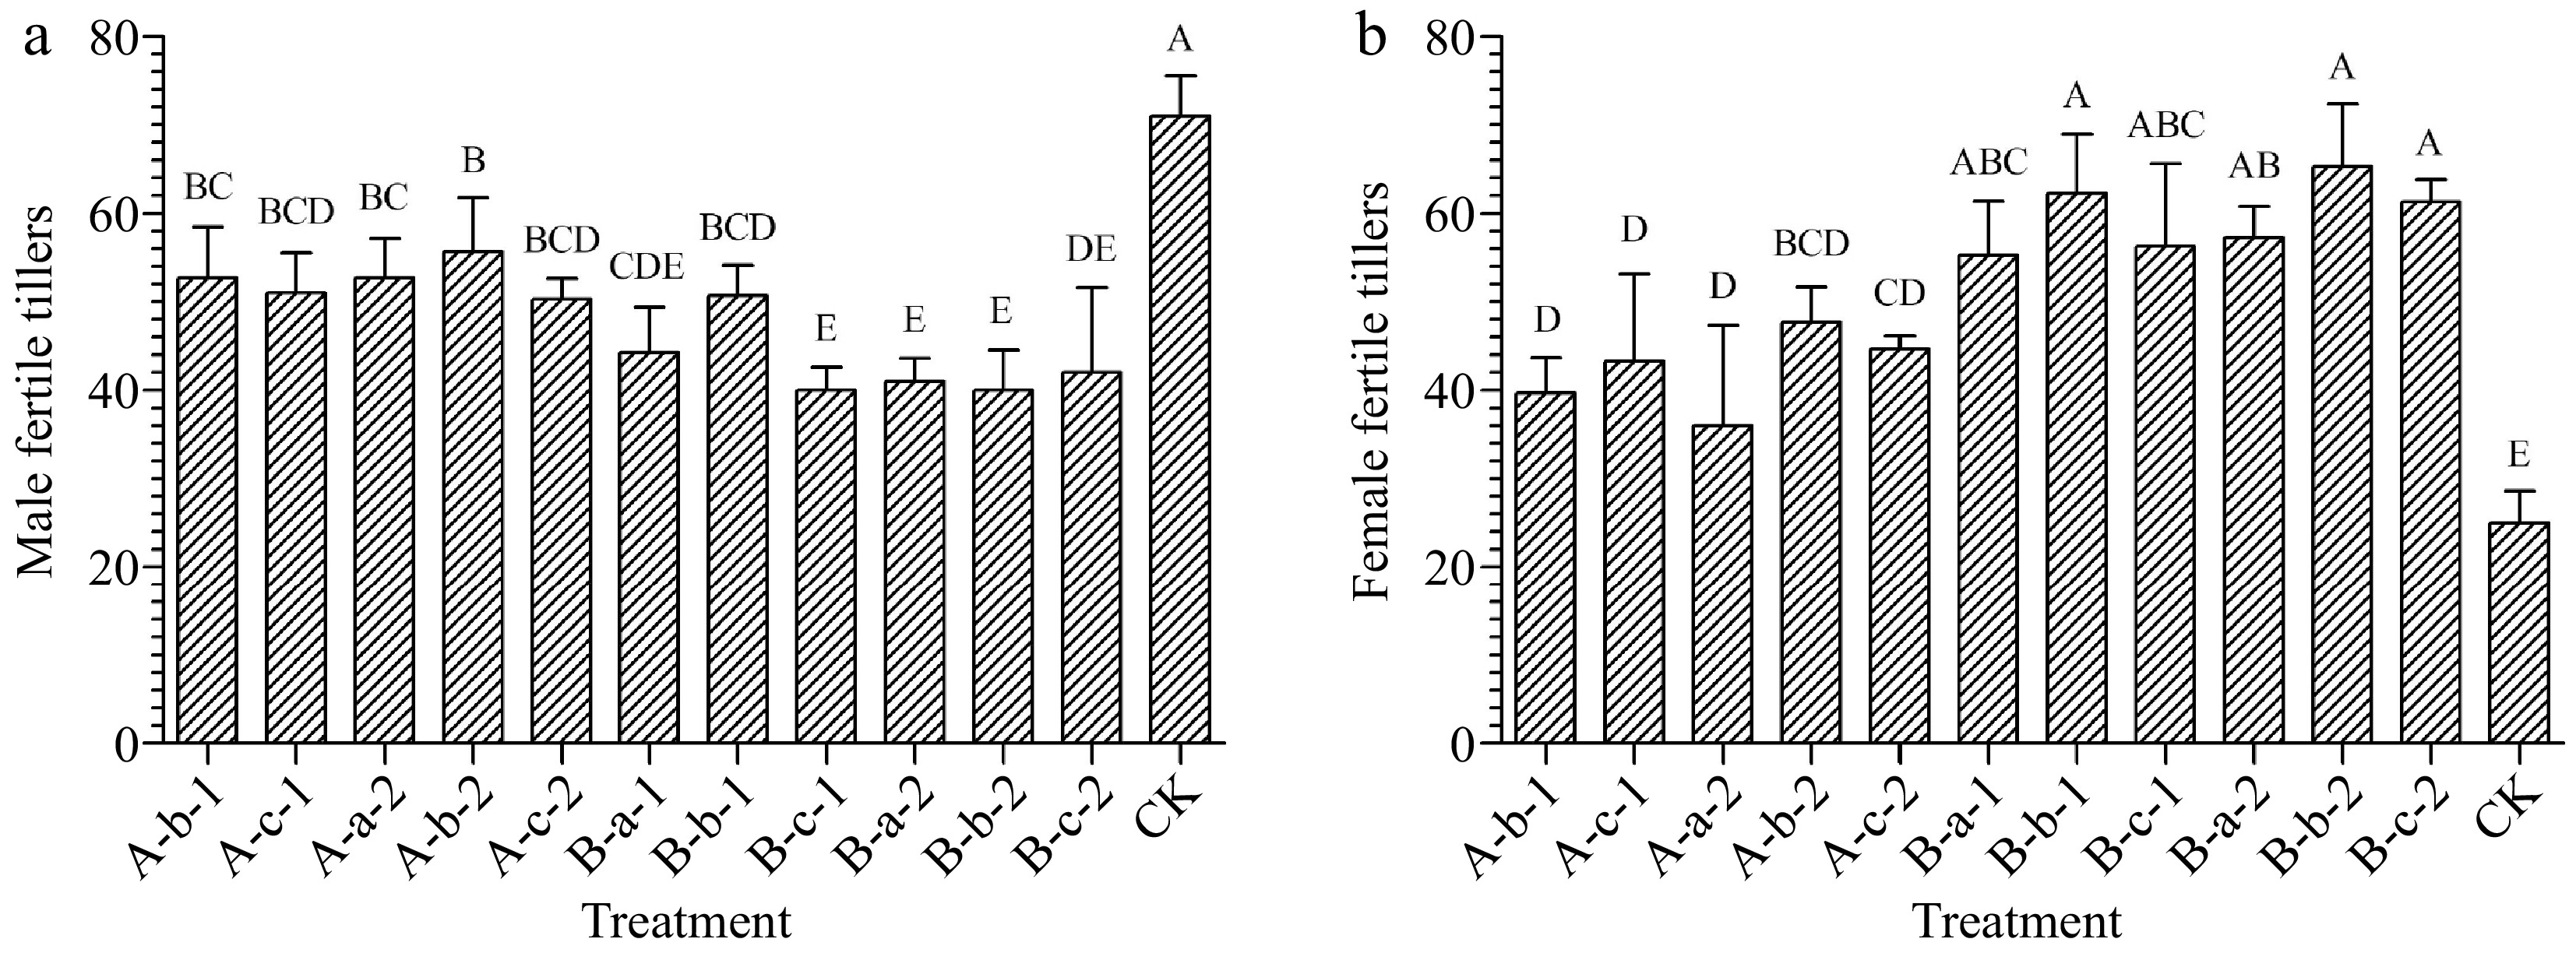
Figure 1.
Effects of spraying reagents on the number of (a) male, and (b) female fertile tillers. The content on the abscissa represents the concentration of reagents used in the corresponding treatment. A-b-1: 100 mg/L DIECA; A-c-1: 150 mg/L DIECA; A-a-2: 50 mg/L NAA; A-b-2: 100 mg/L NAA A-c-2: 150 mg/L NAA; B-a-1: 50 mg/L NAA + 150 mg/L DIECA; B-b-1: 100 mg/L NAA + 150 mg/L DIECA; B-c-1: 150 mg/L NAA + 150 mg/L DIECA; B-a-2: 50 mg/L NAA + 100 mg/L DIECA; B-b-2: 100 mg/L NAA + 100 mg/L DIECA; B-c-2: 150 mg/L NAA + 100 mg/L DIECA; CK: Water.
-
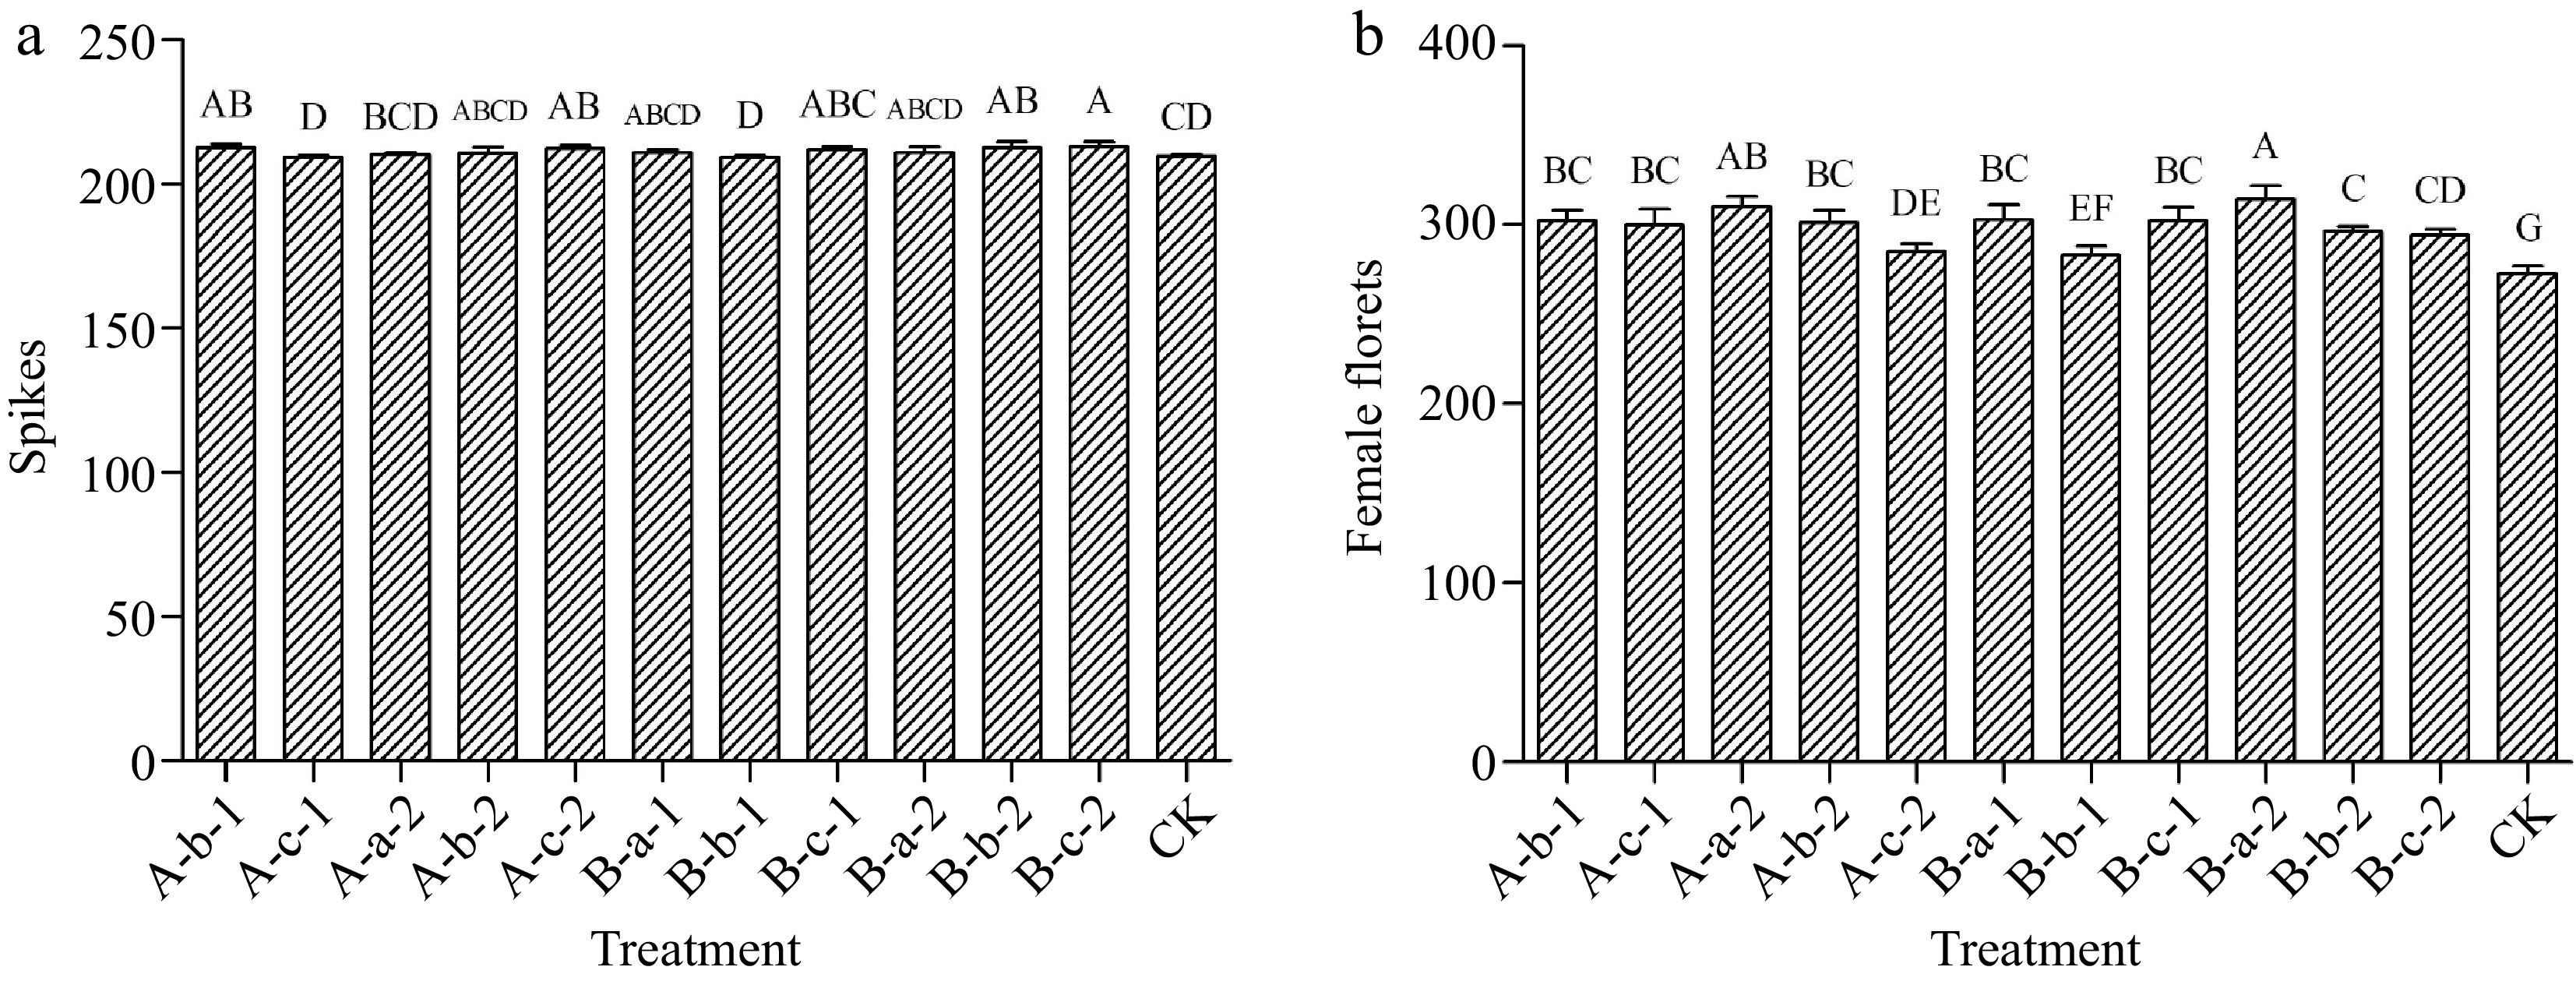
Figure 2.
Effects of spraying reagents on (a) the number of spikes and (b) female florets. The content in the abscissa is the same as Fig. 1.
-
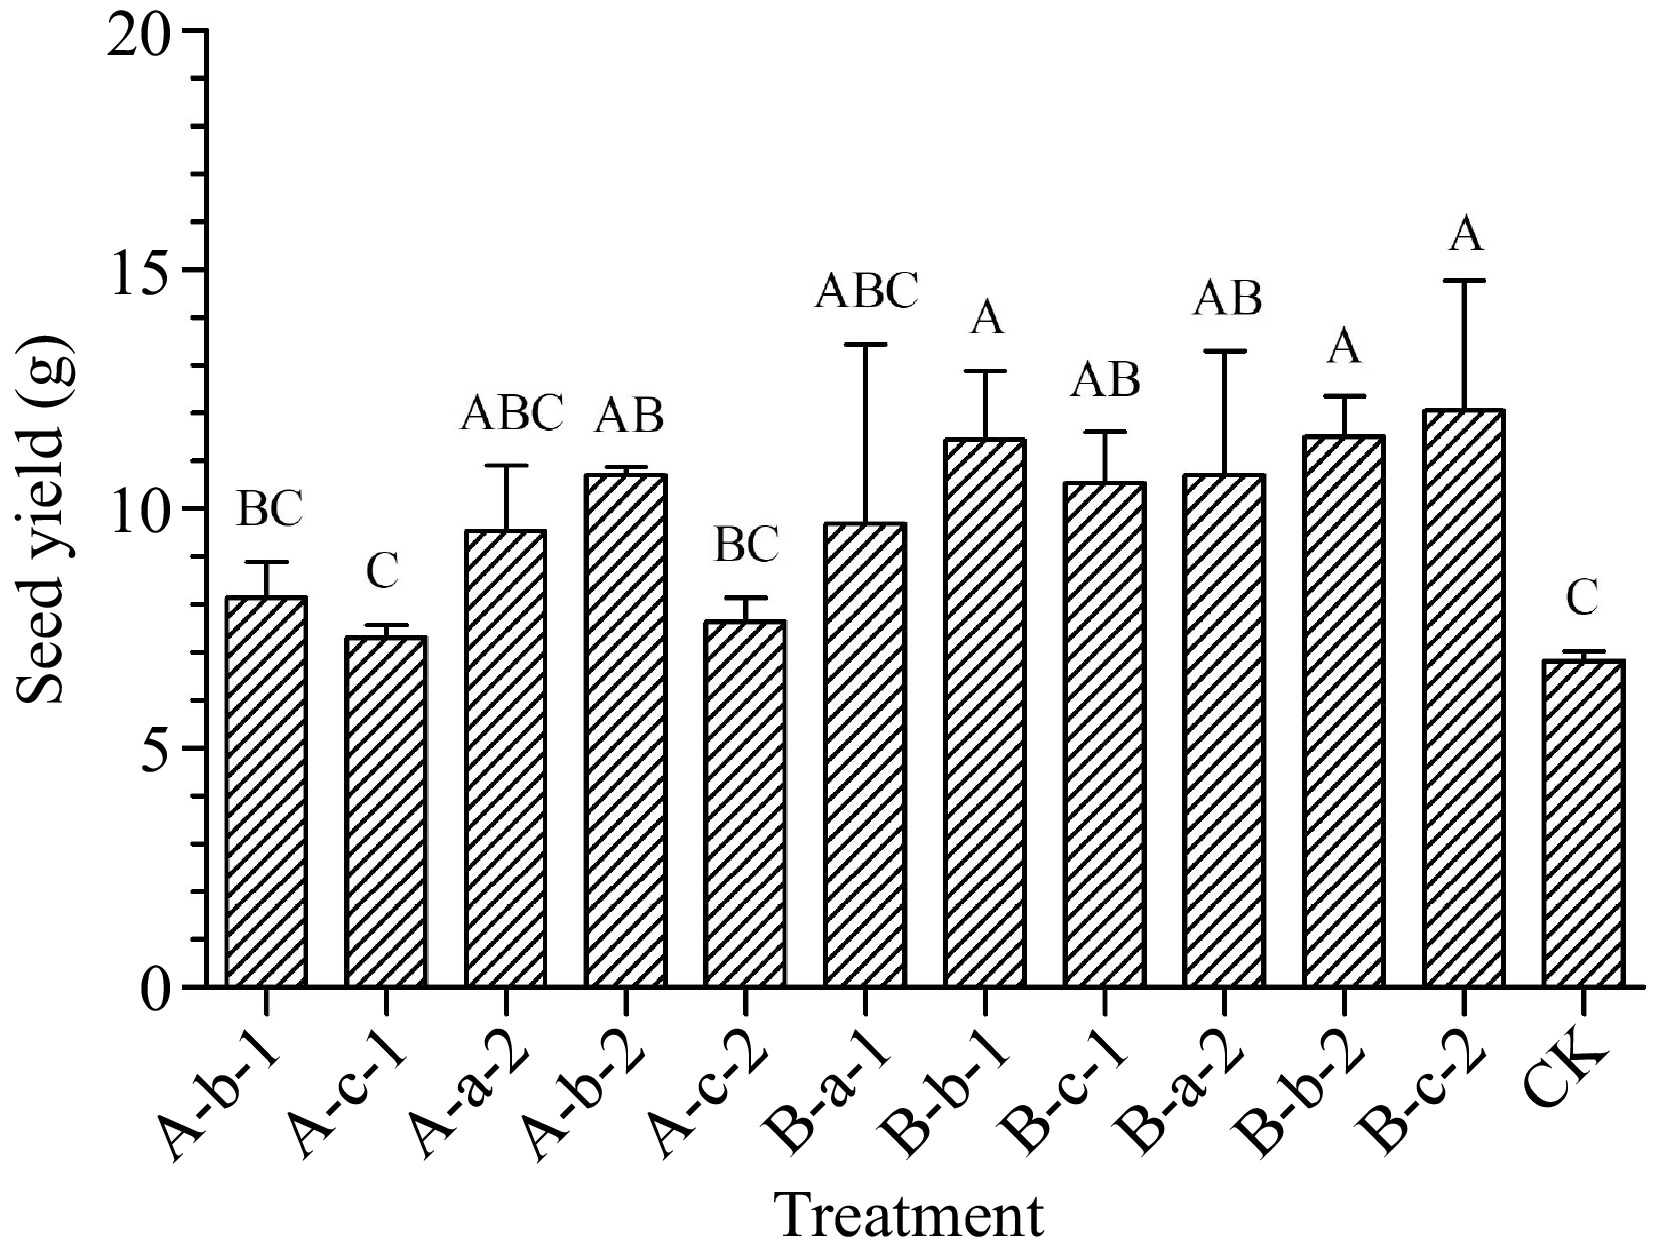
Figure 3.
Effects of spraying reagents on seed yield in experimental plots. The content in the abscissa is the same as Fig. 1.
-
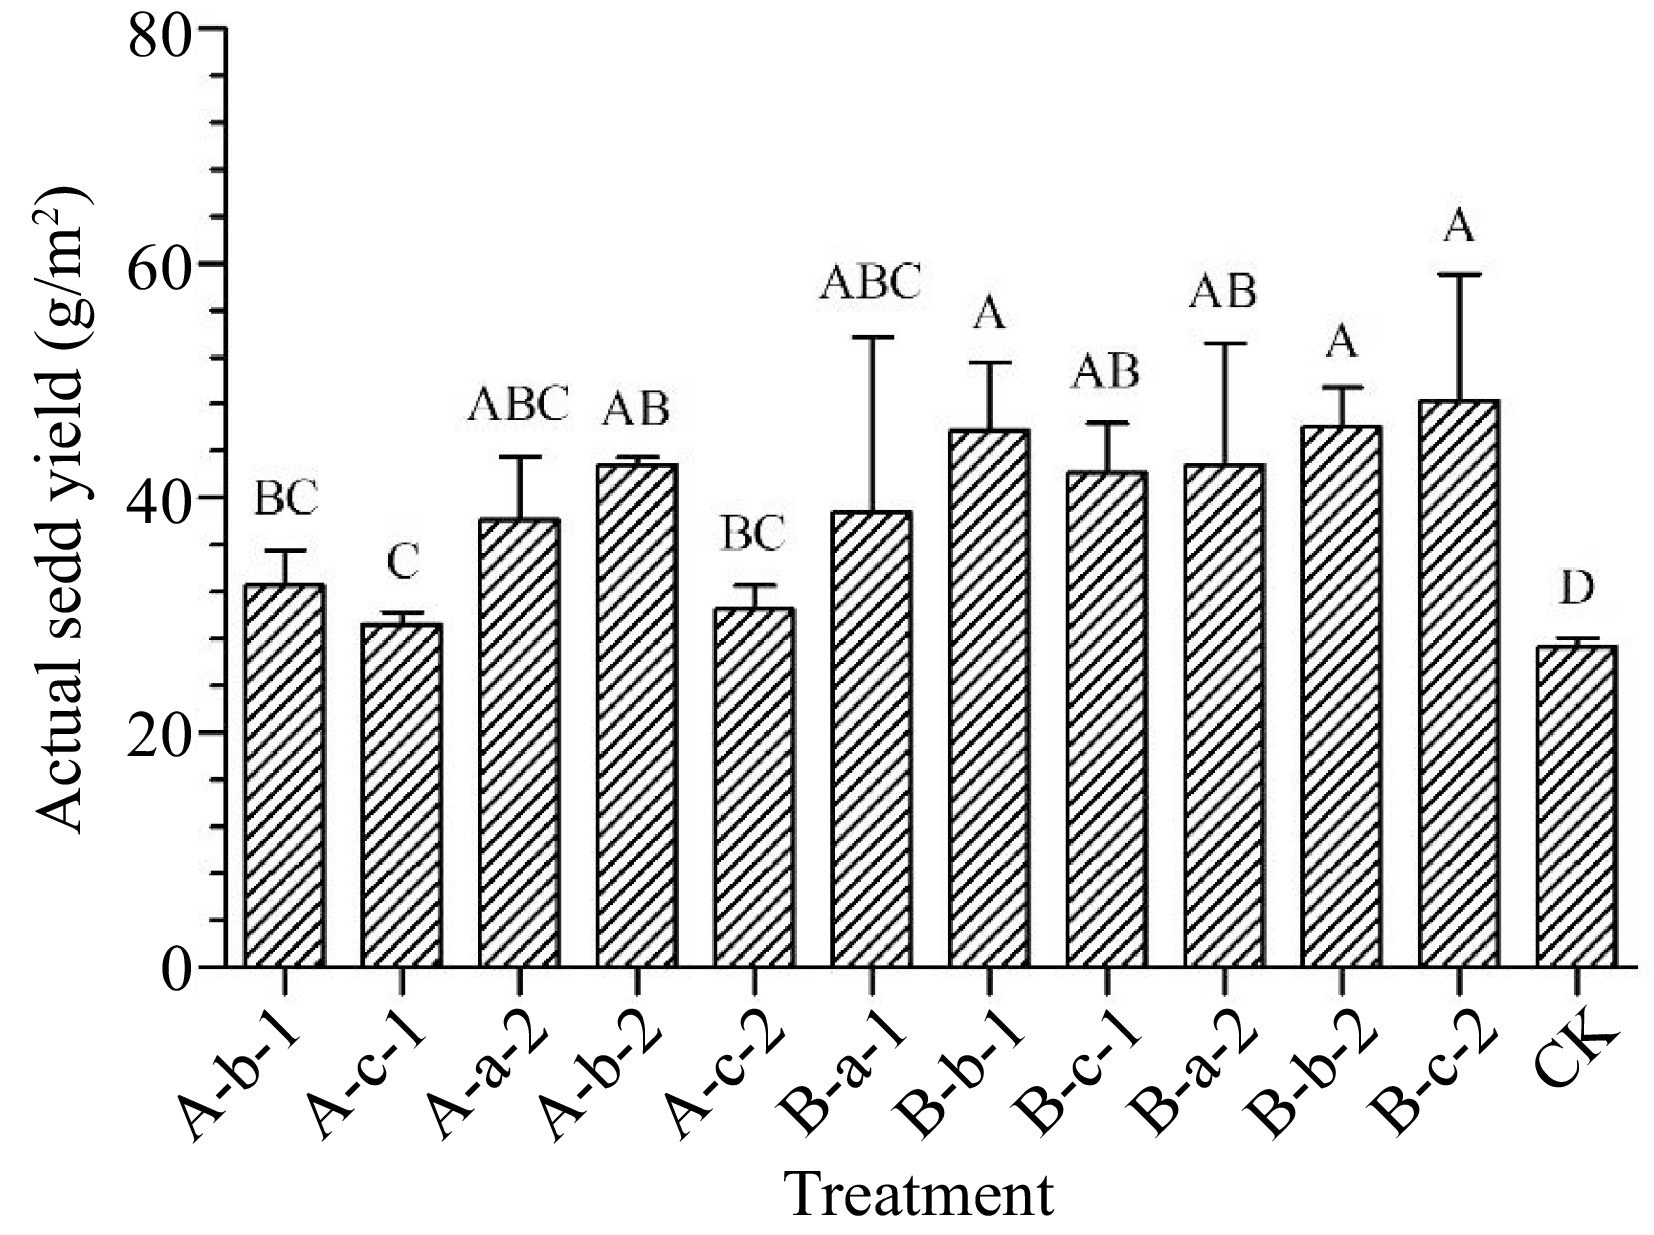
Figure 4.
Effects of spraying reagents on actual seed yield. Note: The content in the abscissa is the same as Fig. 1.
-
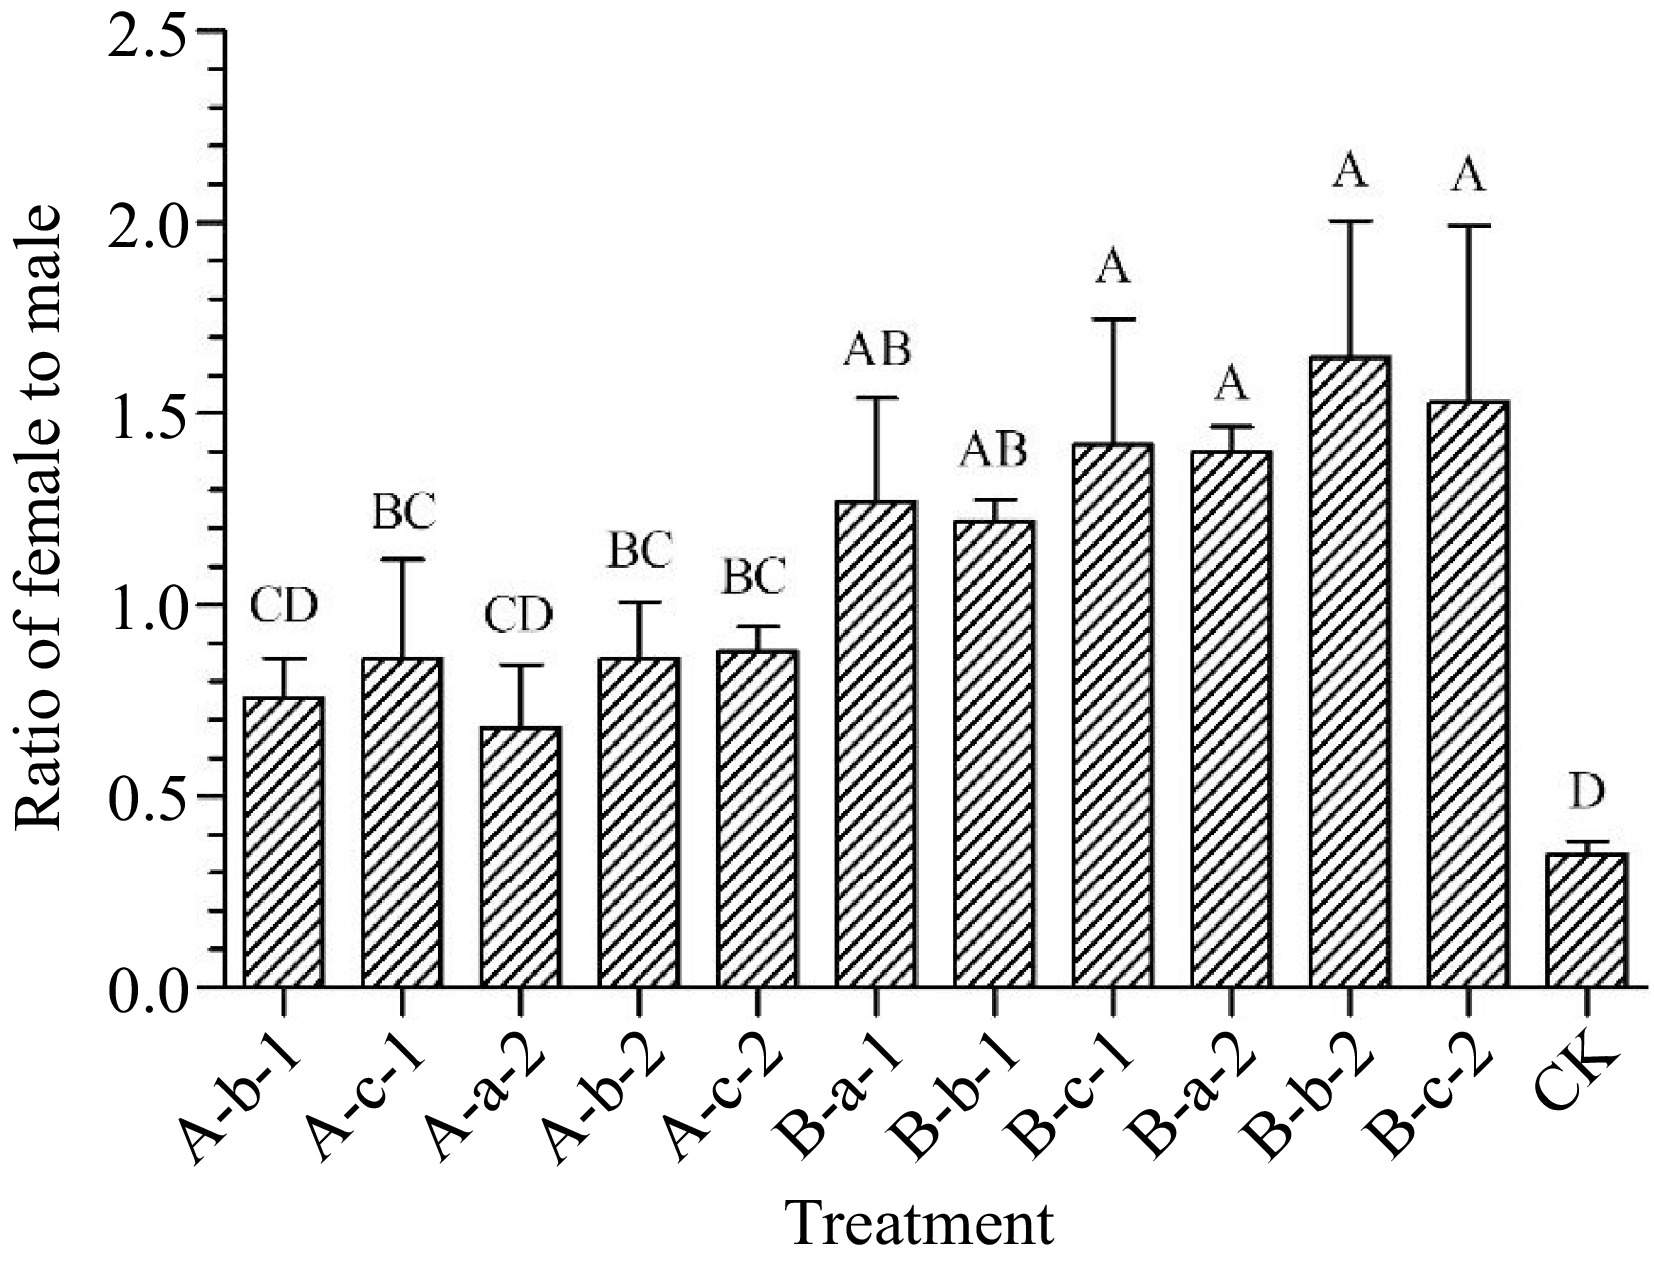
Figure 5.
Effects of spraying reagents on ratio of female to male. Note: The content in the abscissa is the same as Fig. 1.
-
Depth (cm) Bulk density (g/cm3) Field moisture capacity (cm3/cm3) Soil pH Available phosphorous (mg/kg) Available potassium
(mg/kg)Soil organic matter
(g/kg)Alkali-hydrolyzable nitrogen (mg/kg) 0−20 1.67 0.24 7.7 31.76 81.38 7.88 129.24 0−40 1.69 0.20 8.13 13.16 24.36 2.30 128.50 Table 1.
Soil physical and chemical properties.
-
Treatment Reagent concentration NAA (mg/L) DIECA (mg/L) A-b-1 – 100 A-c-1 – 150 A-a-2 50 – A-b-2 100 – A-c-2 150 – B-a-1 50 150 B-b-1 100 150 B-c-1 150 150 B-a-2 50 100 B-b-2 100 100 B-c-2 150 100 CK – – If a certain reagent was not used in the treatment, it is marked as '–'. Table 2.
Reagent concentrations in treatment.
-
Treatment Potential seed yield (g/m2) Actual seed yield
(g/m2)Seed yield coefficient A-b-1 44.97c 32.58bc 72% A-c-1 48.70c 22.04c 60% A-a-2 42.15c 38.13abc 90% A-b-2 53.74bc 42.84ab 80% A-c-2 47.44c 30.53bc 64% B-a-1 62.93ab 38.80abc 62% B-b-1 65.96ab 45.78a 69% B-c-1 63.67ab 42.18ab 66% B-a-2 67.71a 42.82ab 63% B-b-2 72.40a 46.00a 64% B-c-2 67.62a 48.22a 71% CK 30.56d 27.29d 89% Values with superscript letters a, b, c and d are significantly different within columns (p < 0.05). Table 3.
Seed yield in each group.
-
Treatment FFT FF RFM PSY ASY Sum A-b-1 – – – – – 0 A-c-1 – – – – – 0 A-a-2 – – – – – 0 A-b-2 – – – – – 0 A-c-2 – – – – – 0 B-a-1 – A – – – 1 B-b-1 A – – – A 2 B-c-1 – – A – – 1 B-a-2 – A A A – 3 B-b-2 A – A A A 4 B-c-2 A – A A A 4 If the significance of the treatment was marked as 'A' in Duncan's multiple range test, it is marked as 'A' in the table, otherwise it is marked as a '–'. The abbreviations in the column headings represent the following content. FFT: Female fertile tillers; FF: Female florets; RFM: Ratio of female to male; PSY: Potential seed yield; ASY: Actual seed yield; Sum: Total number of 'A'. Table 4.
Sex differentiation and seed yield of each treatment group.
-
Treatments JA content (ng/g FW) 6 h 12 h 24 h A-b-1 19.02 19.70 26.97 A-c-1 11.15 16.31 21.51 A-a-2 18.87 20.41 25.04 A-b-2 12.86 13.54 12.95 A-c-2 11.67 14.76 12.11 B-a-1 15.74 9.67 20.12 B-b-1 18.13 18.98 14.80 B-c-1 14.46 17.40 20.79 B-a-2 19.96 15.77 19.94 B-b-2 14.44 14.51 18.43 B-c-2 13.50 19.53 17.14 CK 27.90* 27.90* 27.90* '*' indicates that the treatment is significantly different from other groups within column. Table 5.
Endogenous JA content in leaves, 6, 12, 24 h after treatment.
-
Treatments JA content (ng/g FW) 6 h 12 h 24 h A-b-1 6.42 6.85 6.78 A-c-1 6.40 8.45 6.40 A-a-2 8.26 8.08 8.22 A-b-2 7.59 7.30 6.18 A-c-2 5.38 8.77 5.75 B-a-1 6.09 5.97 6.64 B-b-1 5.56 6.12 6.40 B-c-1 4.54 7.62 8.16 B-a-2 8.43 5.44 5.14 B-b-2 6.31 5.70 4.22 B-c-2 5.69 9.25 7.30 CK 9.80* 9.80* 9.80* '*' indicates that the treatment is significantly different from other groups within column. Table 6.
Endogenous JA content in roots, 6, 12, 24 h after treatment.
Figures
(5)
Tables
(6)