-
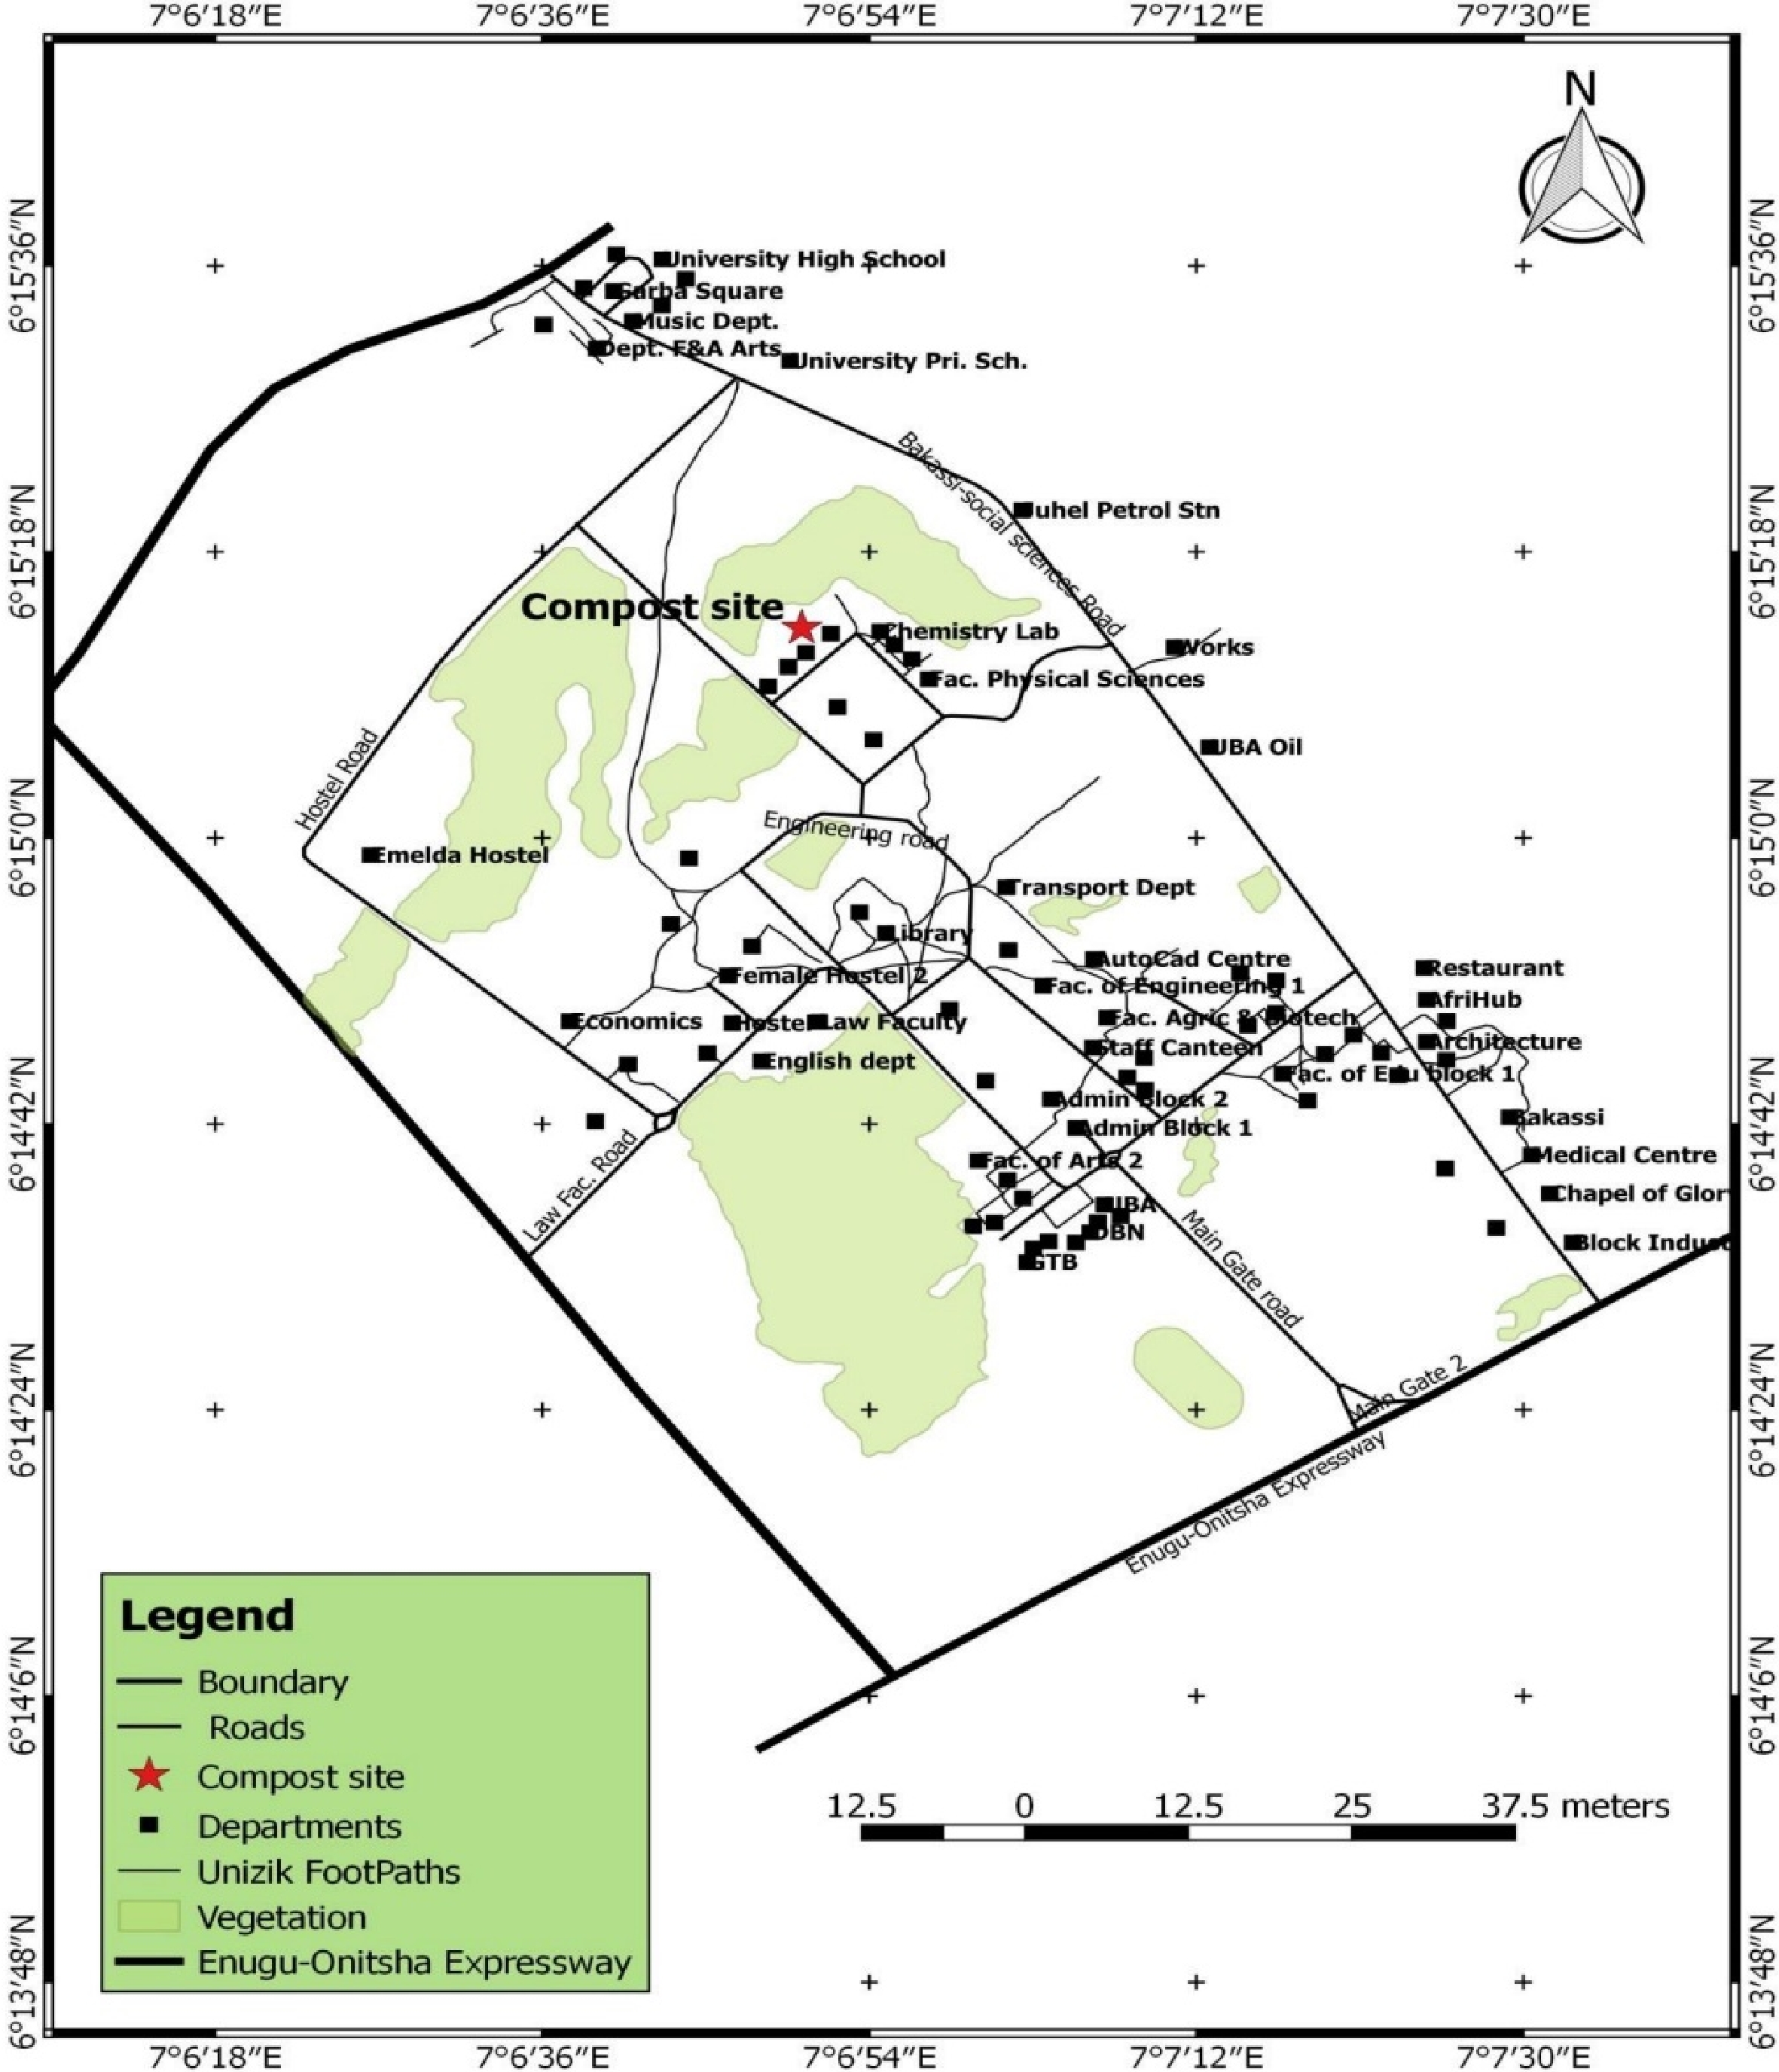
Figure 1.
Map of the experimental site.
-
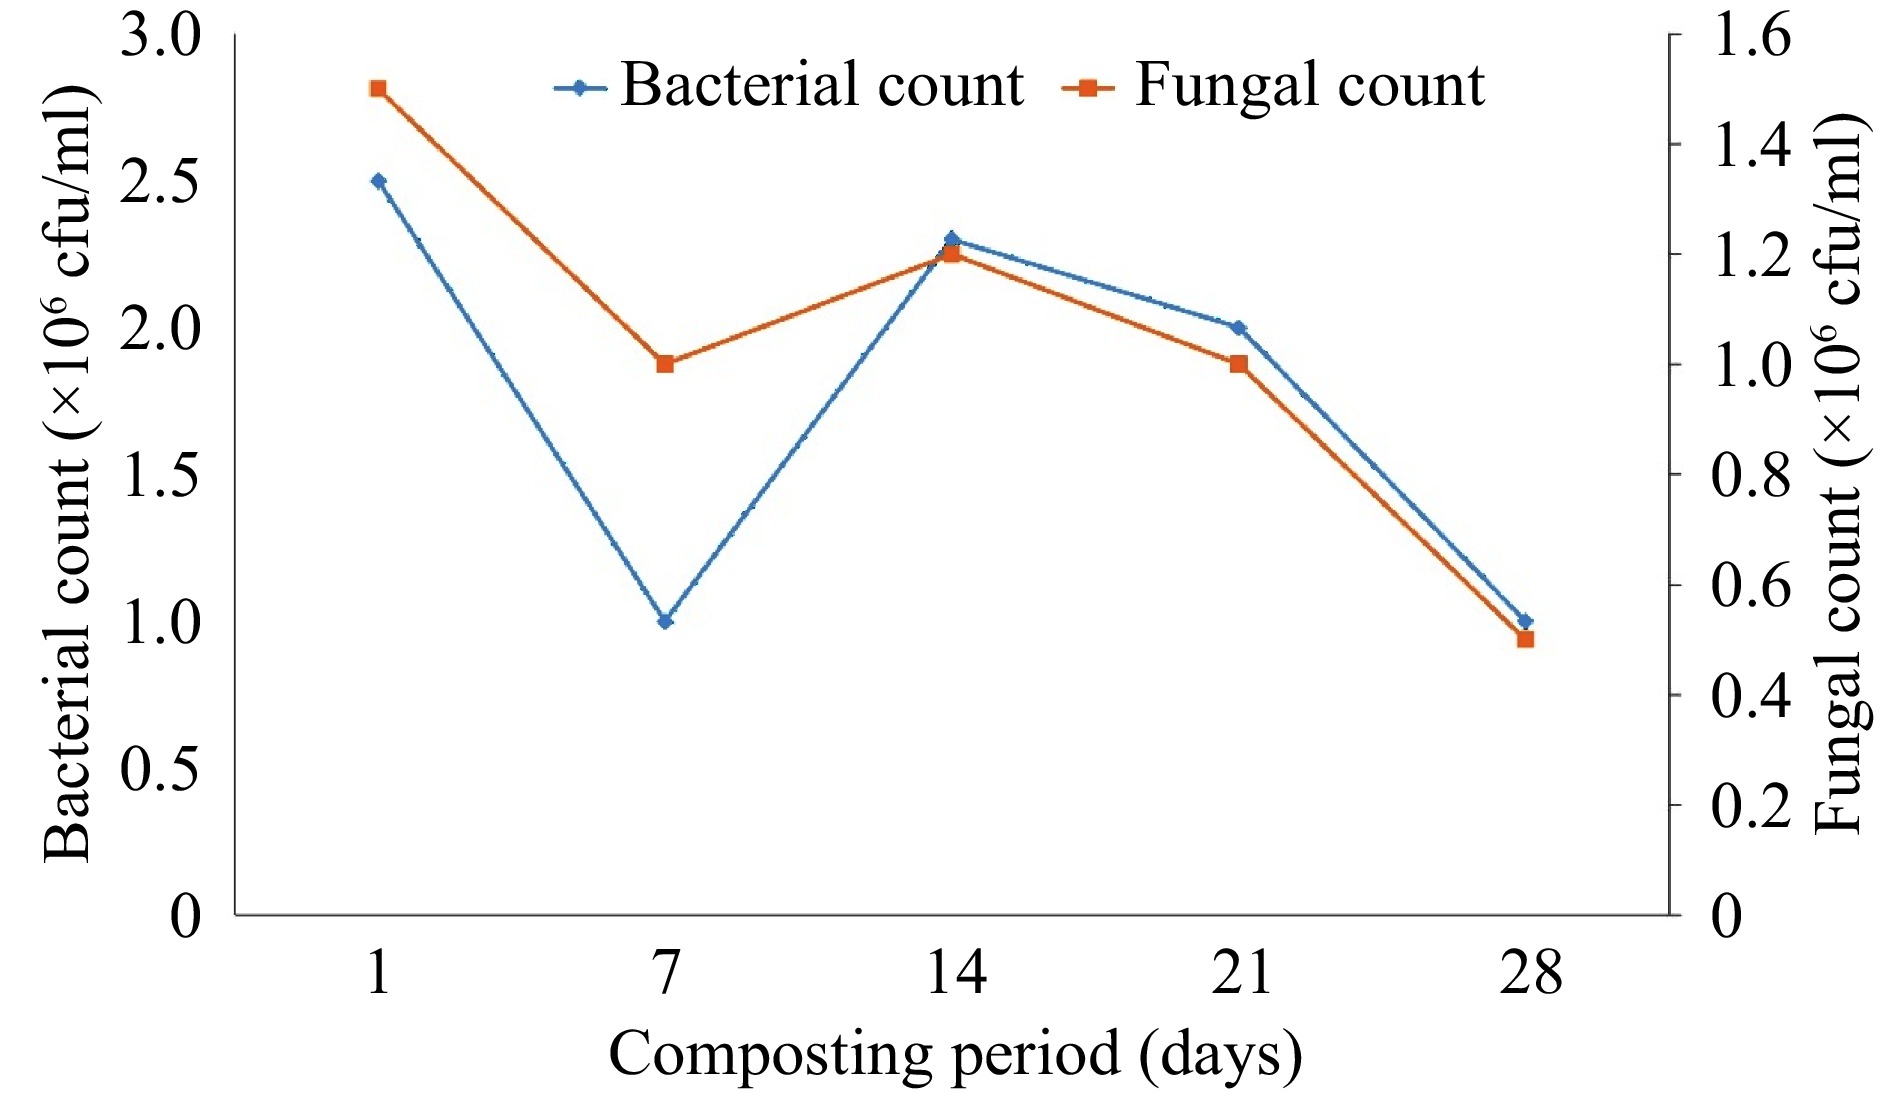
Figure 2.
Changes in microbial populations with time during composting.
-
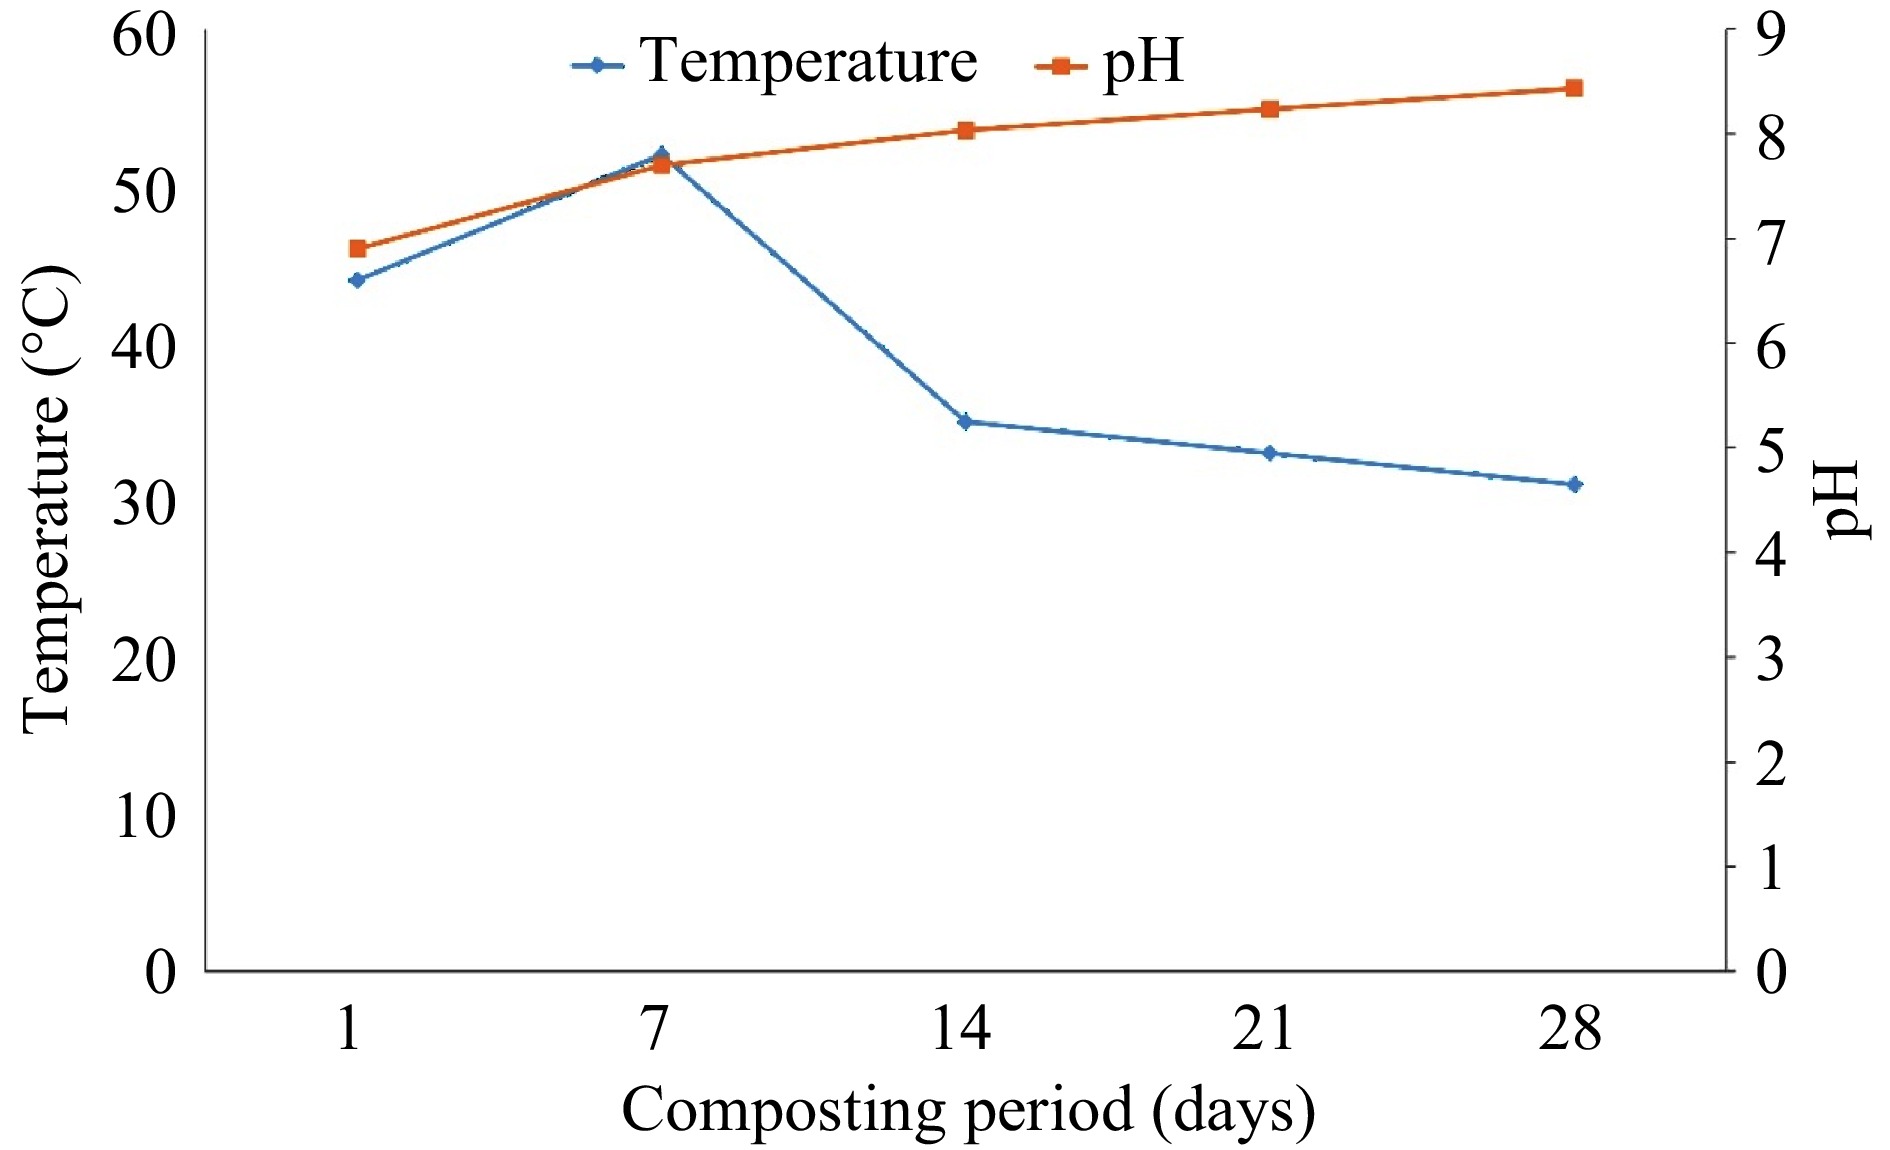
Figure 3.
Changes in temperature and pH with time during composting.
-
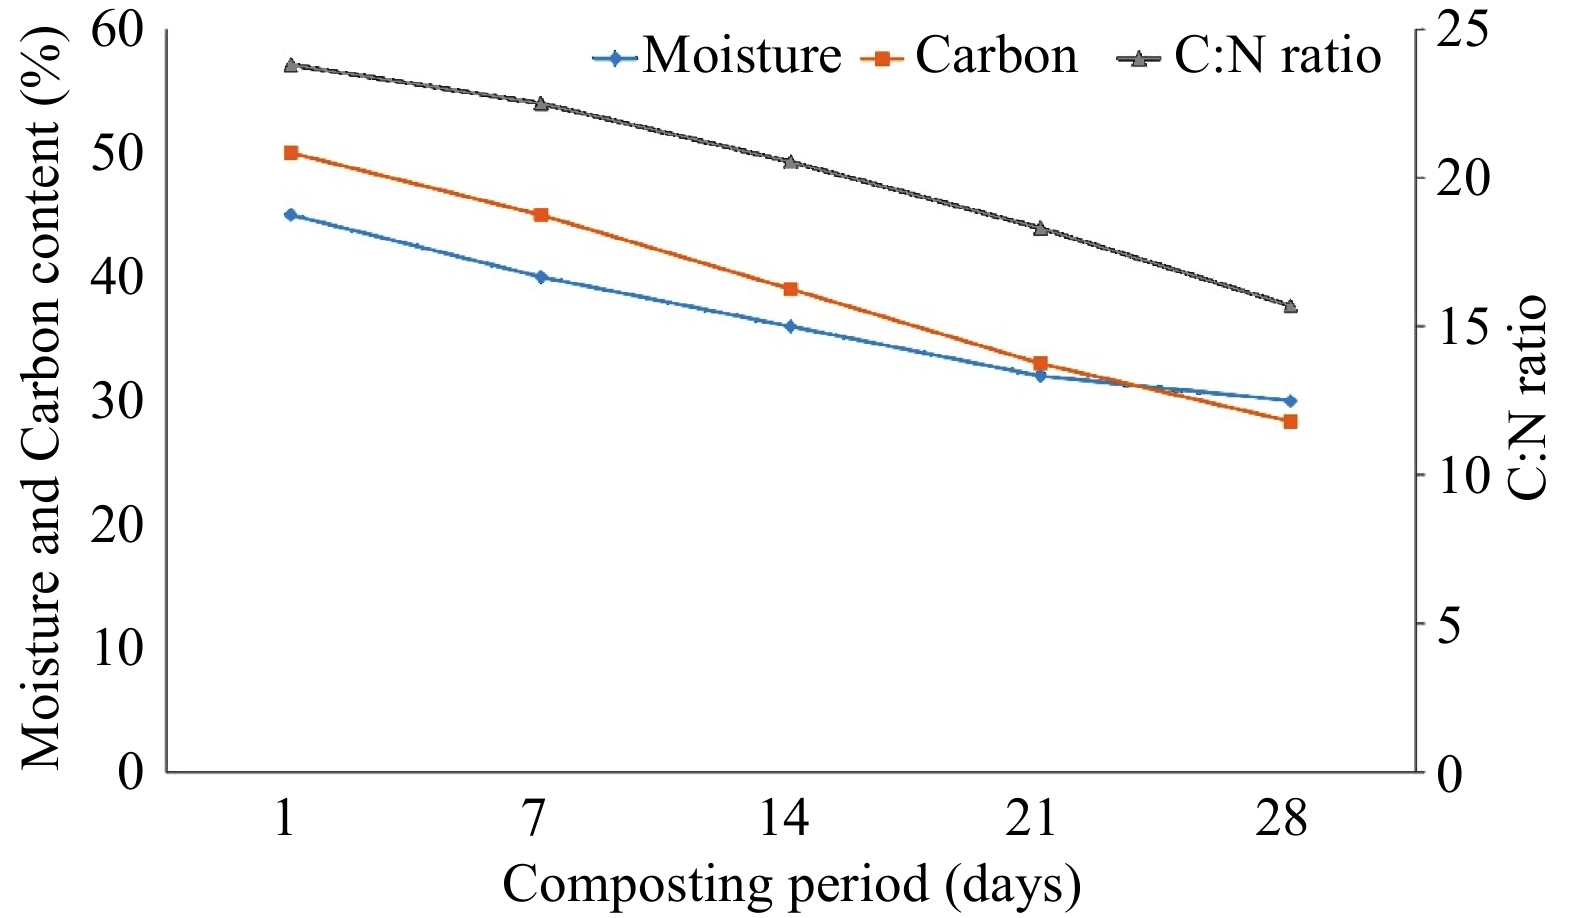
Figure 4.
Variation in moisture, carbon content, and C: N ratio with time during composting.
-
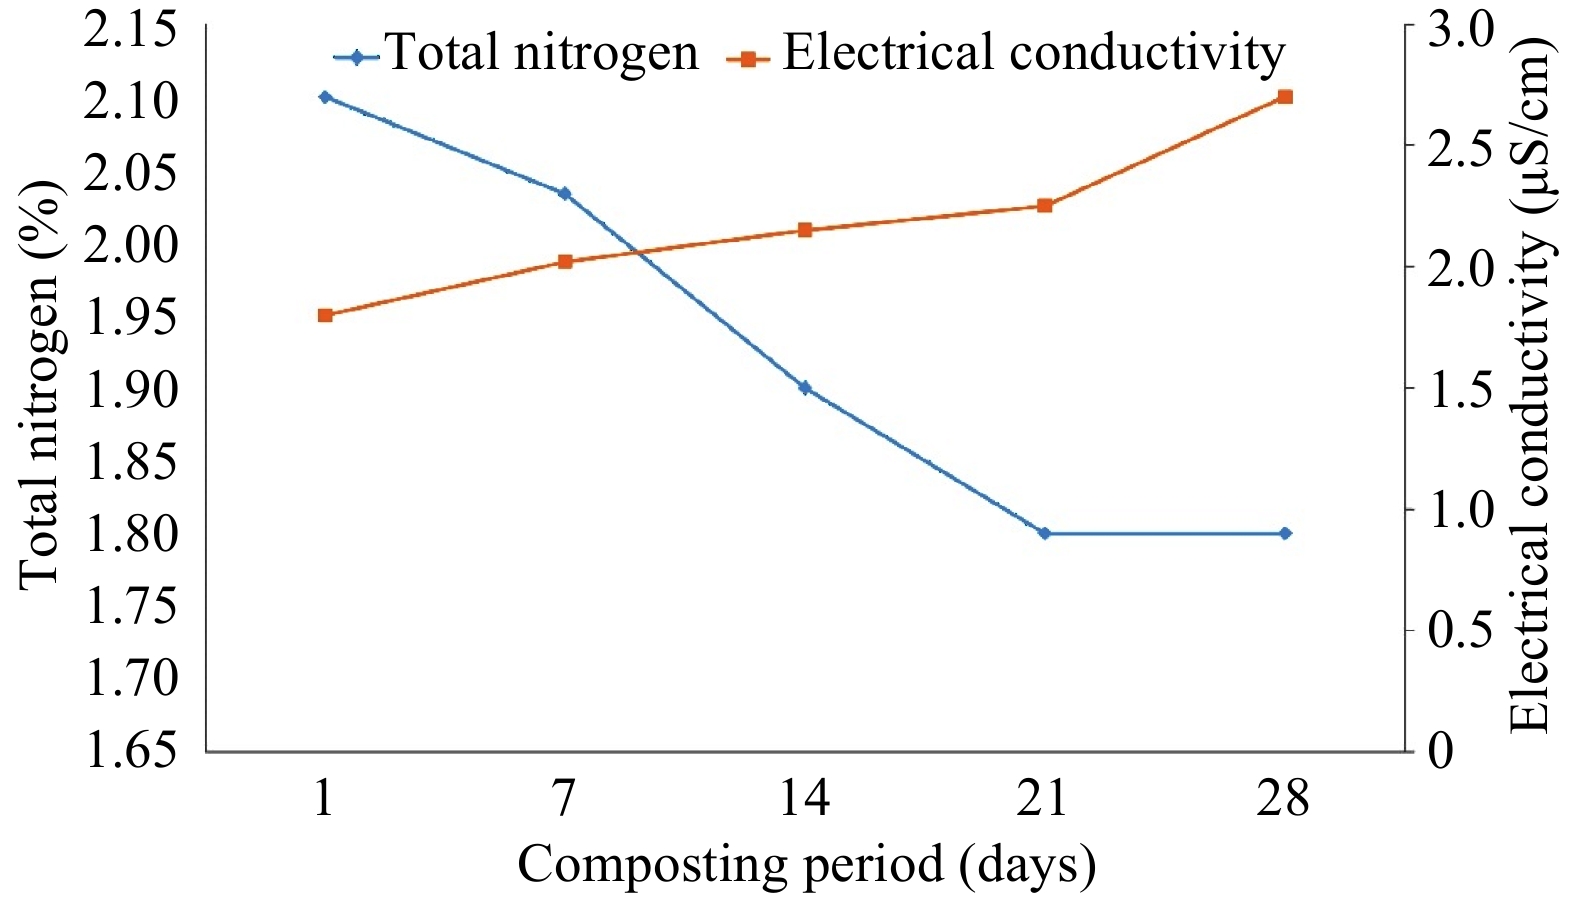
Figure 5.
Changes in total nitrogen and electrical conductivity with time during composting.
-
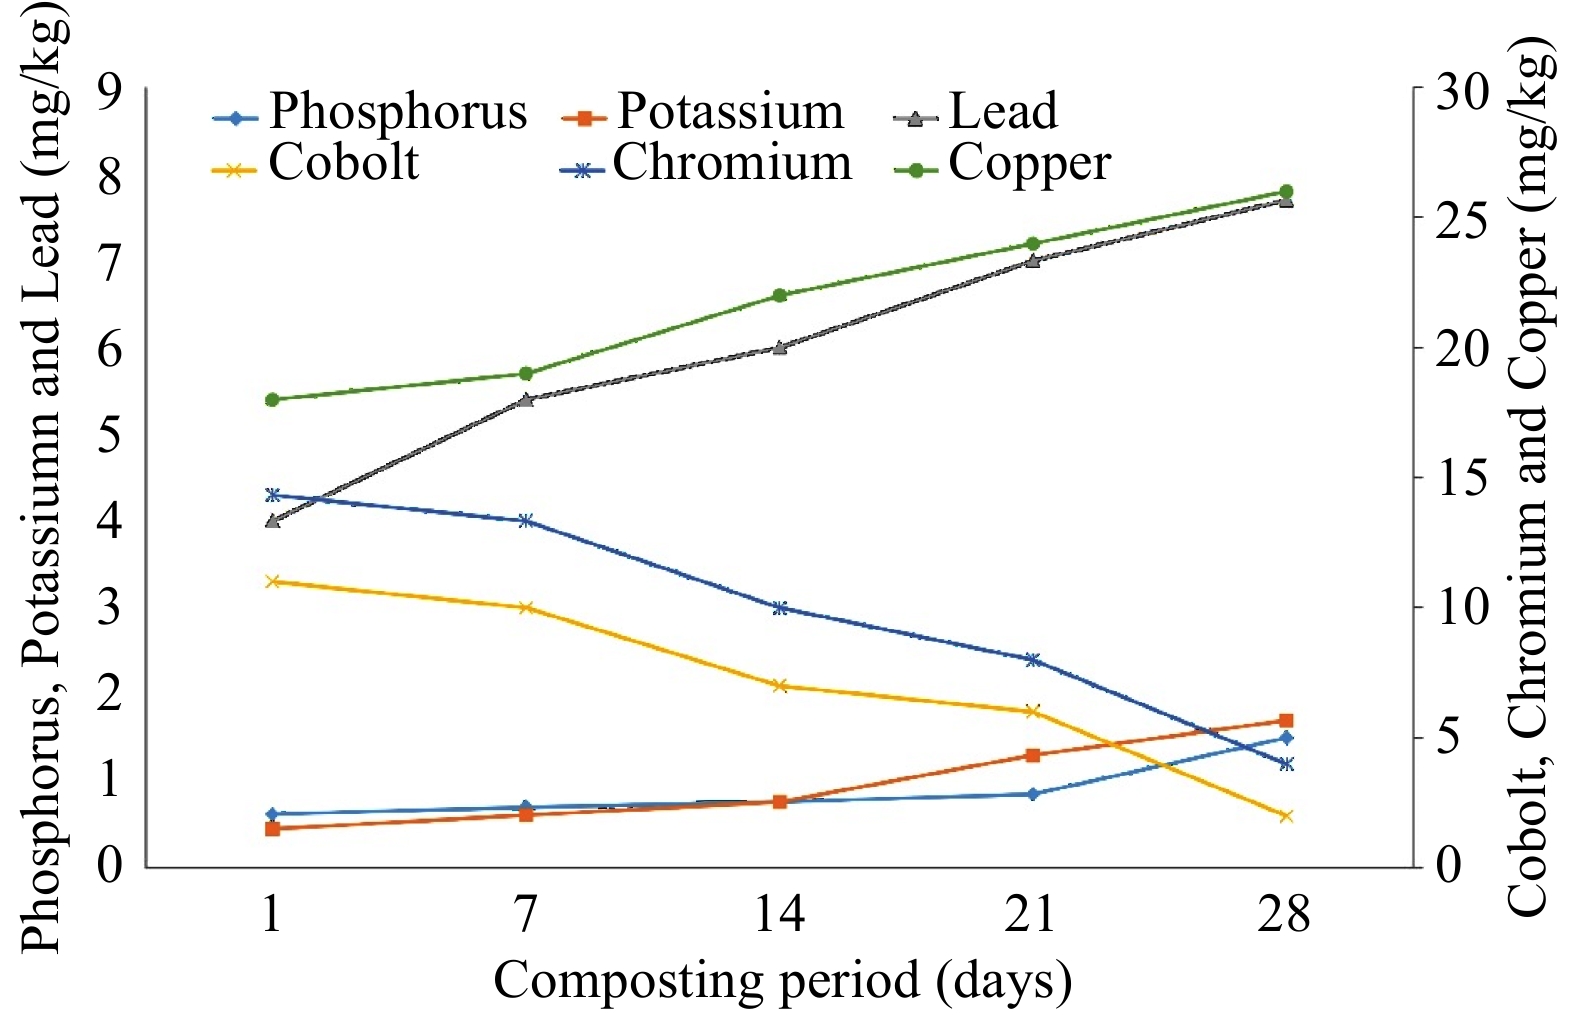
Figure 6.
Changes in concentration of mineral elements during the composting period.
-
Compost + soil combinations Plant height (cm) Number of leaves 100% compost 66.04 ± 0.57a 22 ± 0.57b 75% compost + 25% soil 60.96 ± 0.57b 21 ± 0.57b 50% compost + 50% soil 58.42 ± 0.57b 18 ± 0.57c 100% soil 50.80 ± 0.57c 15 ± 0.57d Values are mean of three replicates ± SEM. Means with different superscripts within the column are significantly different at the 0.05 level. Table 1.
Effect of different combinations of compost and soil on the growth of Amaranthus amaranthus.
-
Physicochemical parameters Bacterial count
(× 106 cfu/mL)Fungal count
(× 106 cfu/mL)Plant height (cm) Number of leaves Temperature –0.132 0.453 0.604* 0.776** pH –0.474 –0.790** –0.874** –0.853** Moisture 0.426 0.836** 0.872** 0.890** Carbon 0.393 0.798** 0.934** 0.957** Nitrogen 0.137 0.447 0.806** 0.830** C/N-ratio 0.448 0.873** 0.858** 0.898** Electrical conductivity –0.575* –0.912** –0.871** –0.874** Cobolt 0.383 0.776** 0.934** 0.973** Copper –0.340 –0.791** –0.732** –0.810** Phosphorus –0.587 –0.878** –0.890** –0.904** Potassium –0.468 –0.854** –0.883** –0.897** Lead –0.504 –0.865** –0.886** –0.878** Chromium 0.345 0.768** 0.941** 0.990** ** Correlation is significant at the 0.01 level (2-tailed). * Correlation is significant at the 0.05 level (2-tailed). Table 2.
Relationship between the microbial count, plant height, number of leaves and the physicochemical parameters.
Figures
(6)
Tables
(2)