-
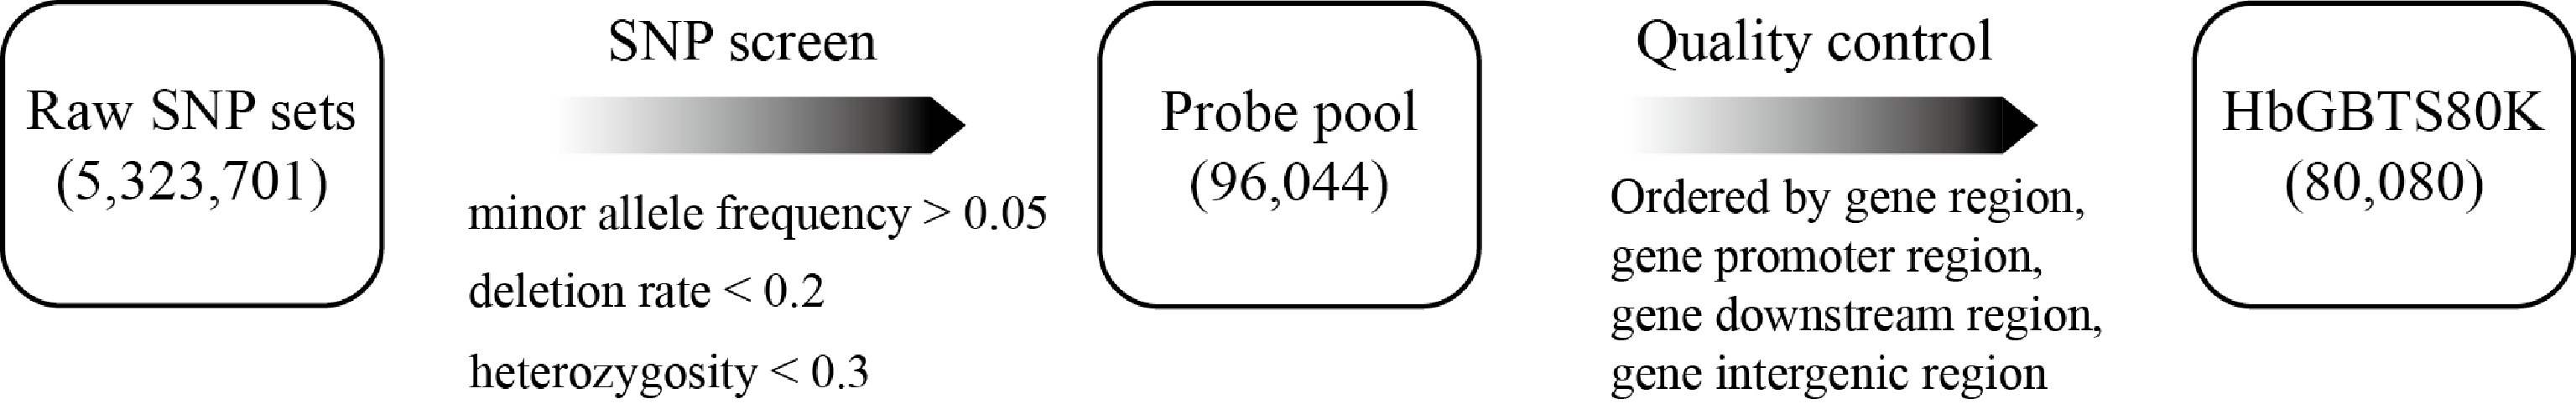
Figure 1.
Design pipeline of the rubber tree HbGBTS80K chip.
-
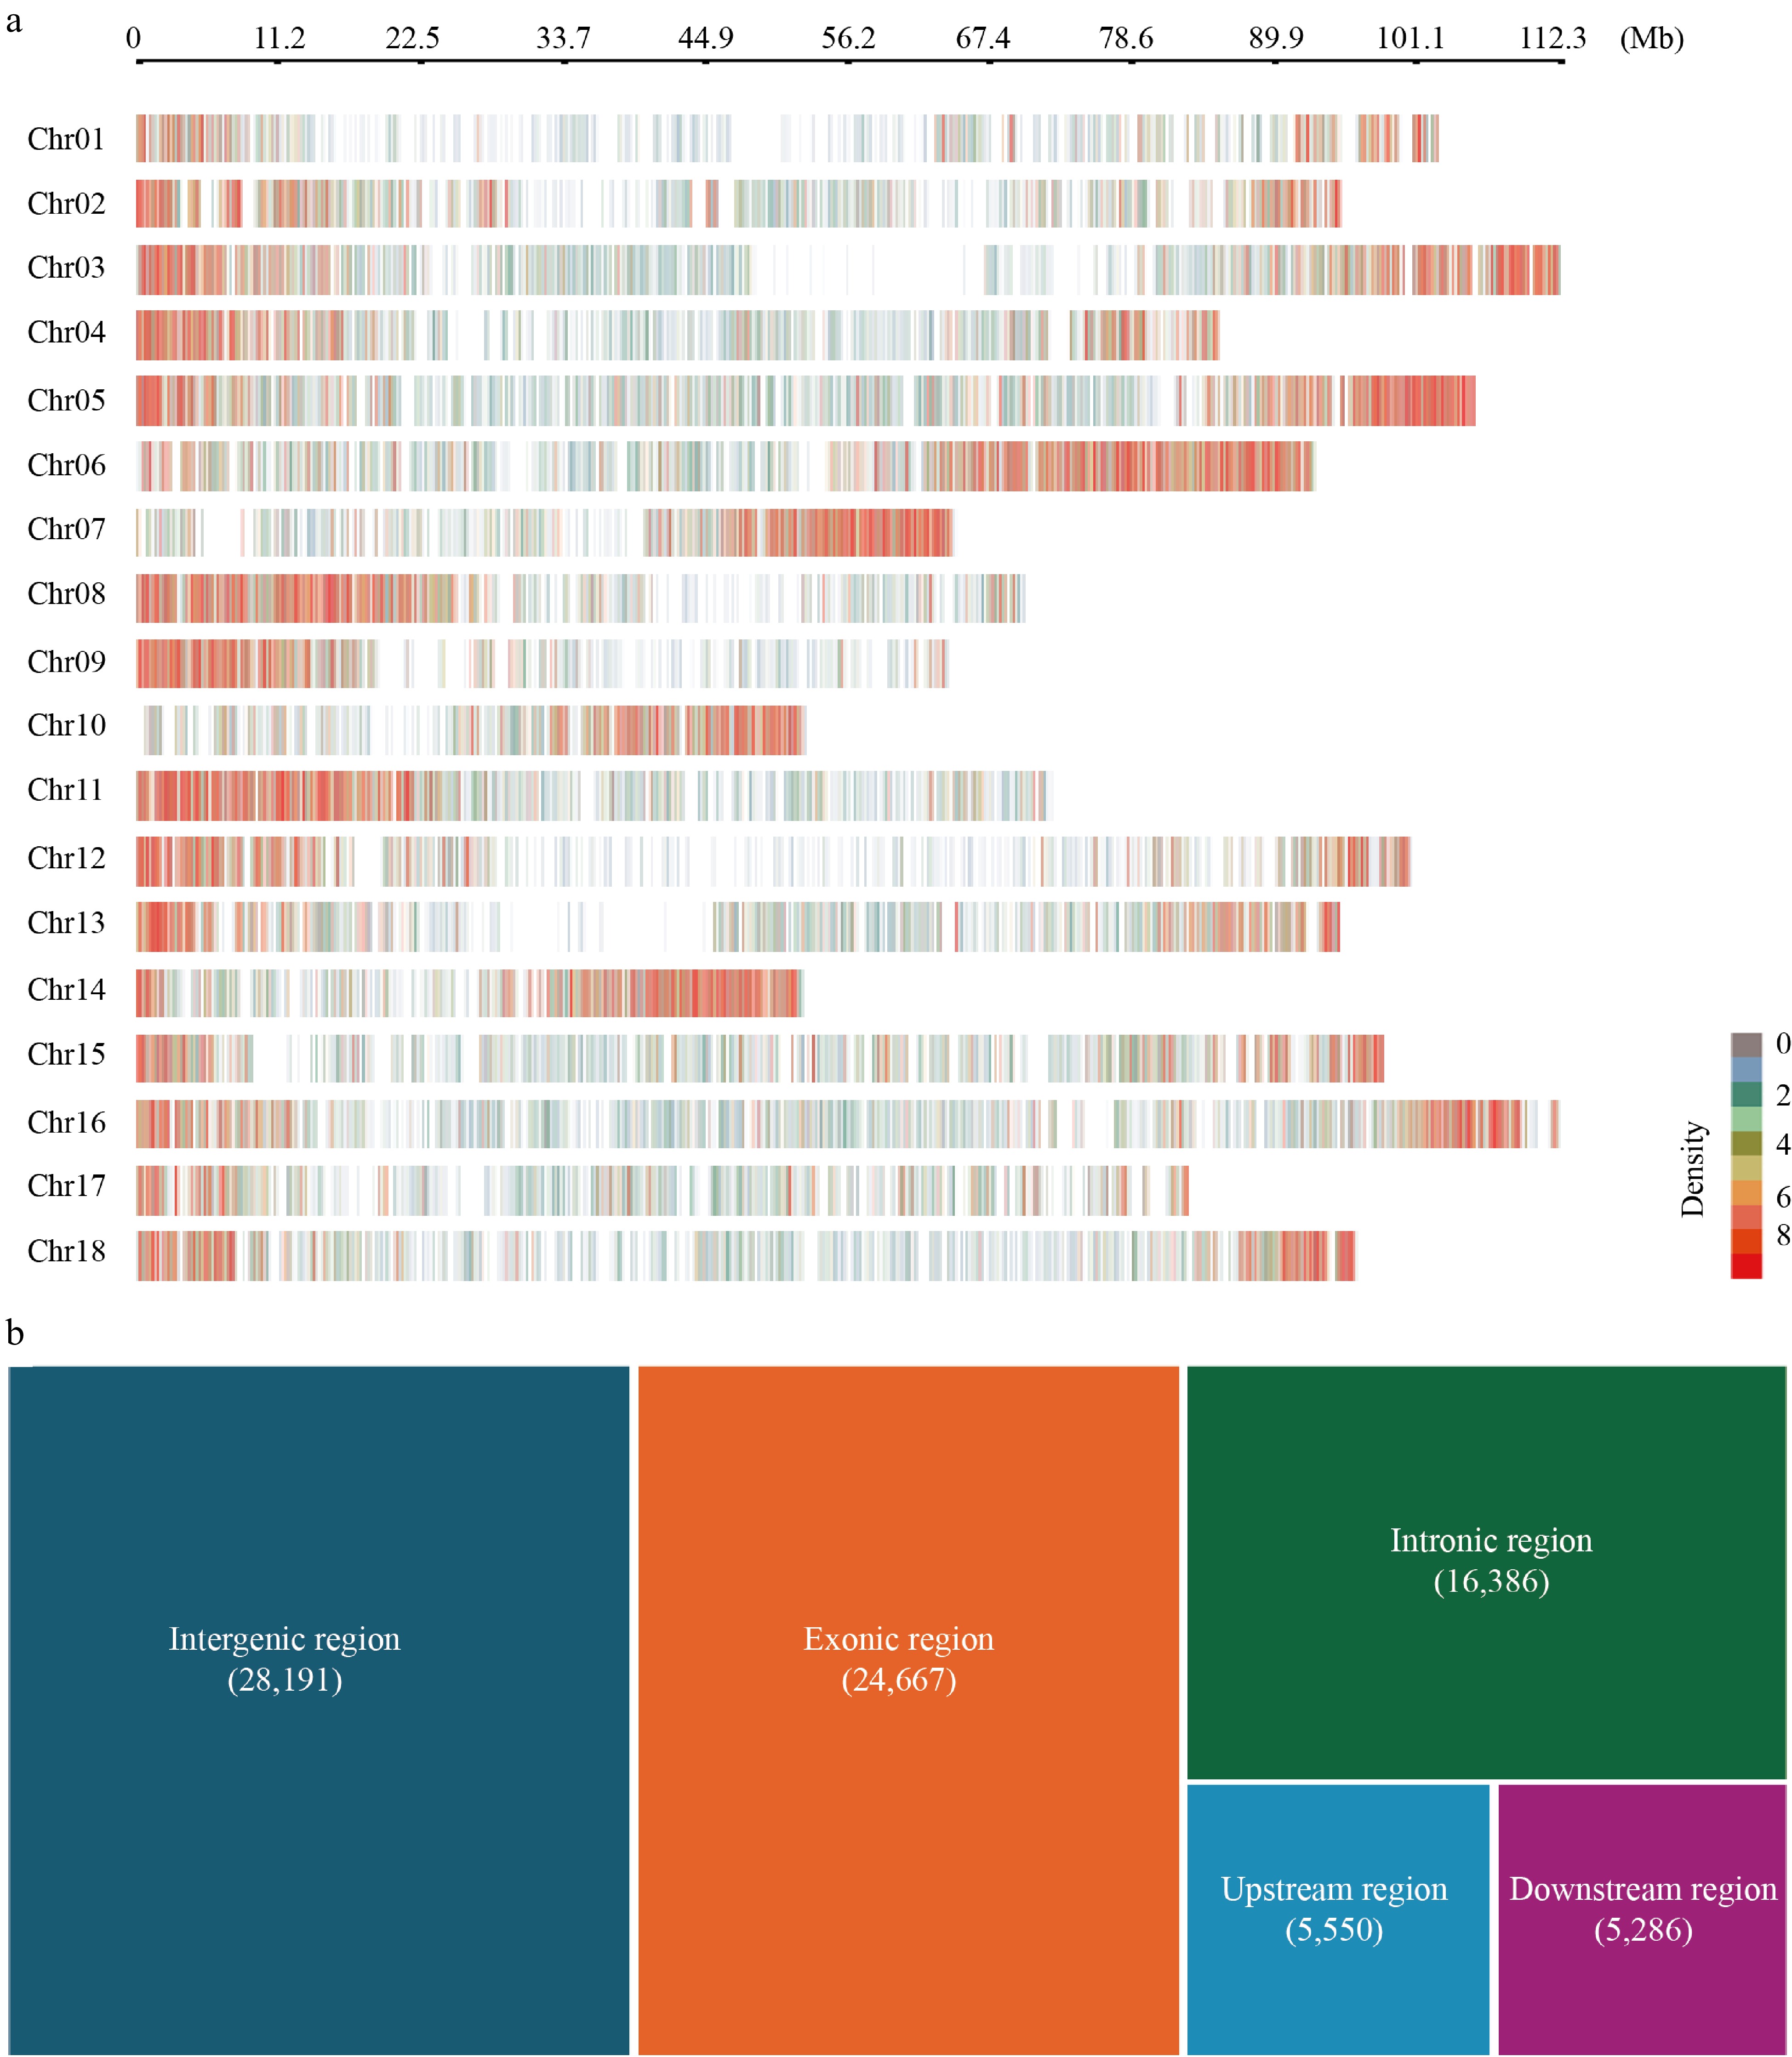
Figure 2.
Characteristics of the HbGBTS80K chip. (a) SNP marker density throughout the genome. (b) SNP locations within the genome.
-
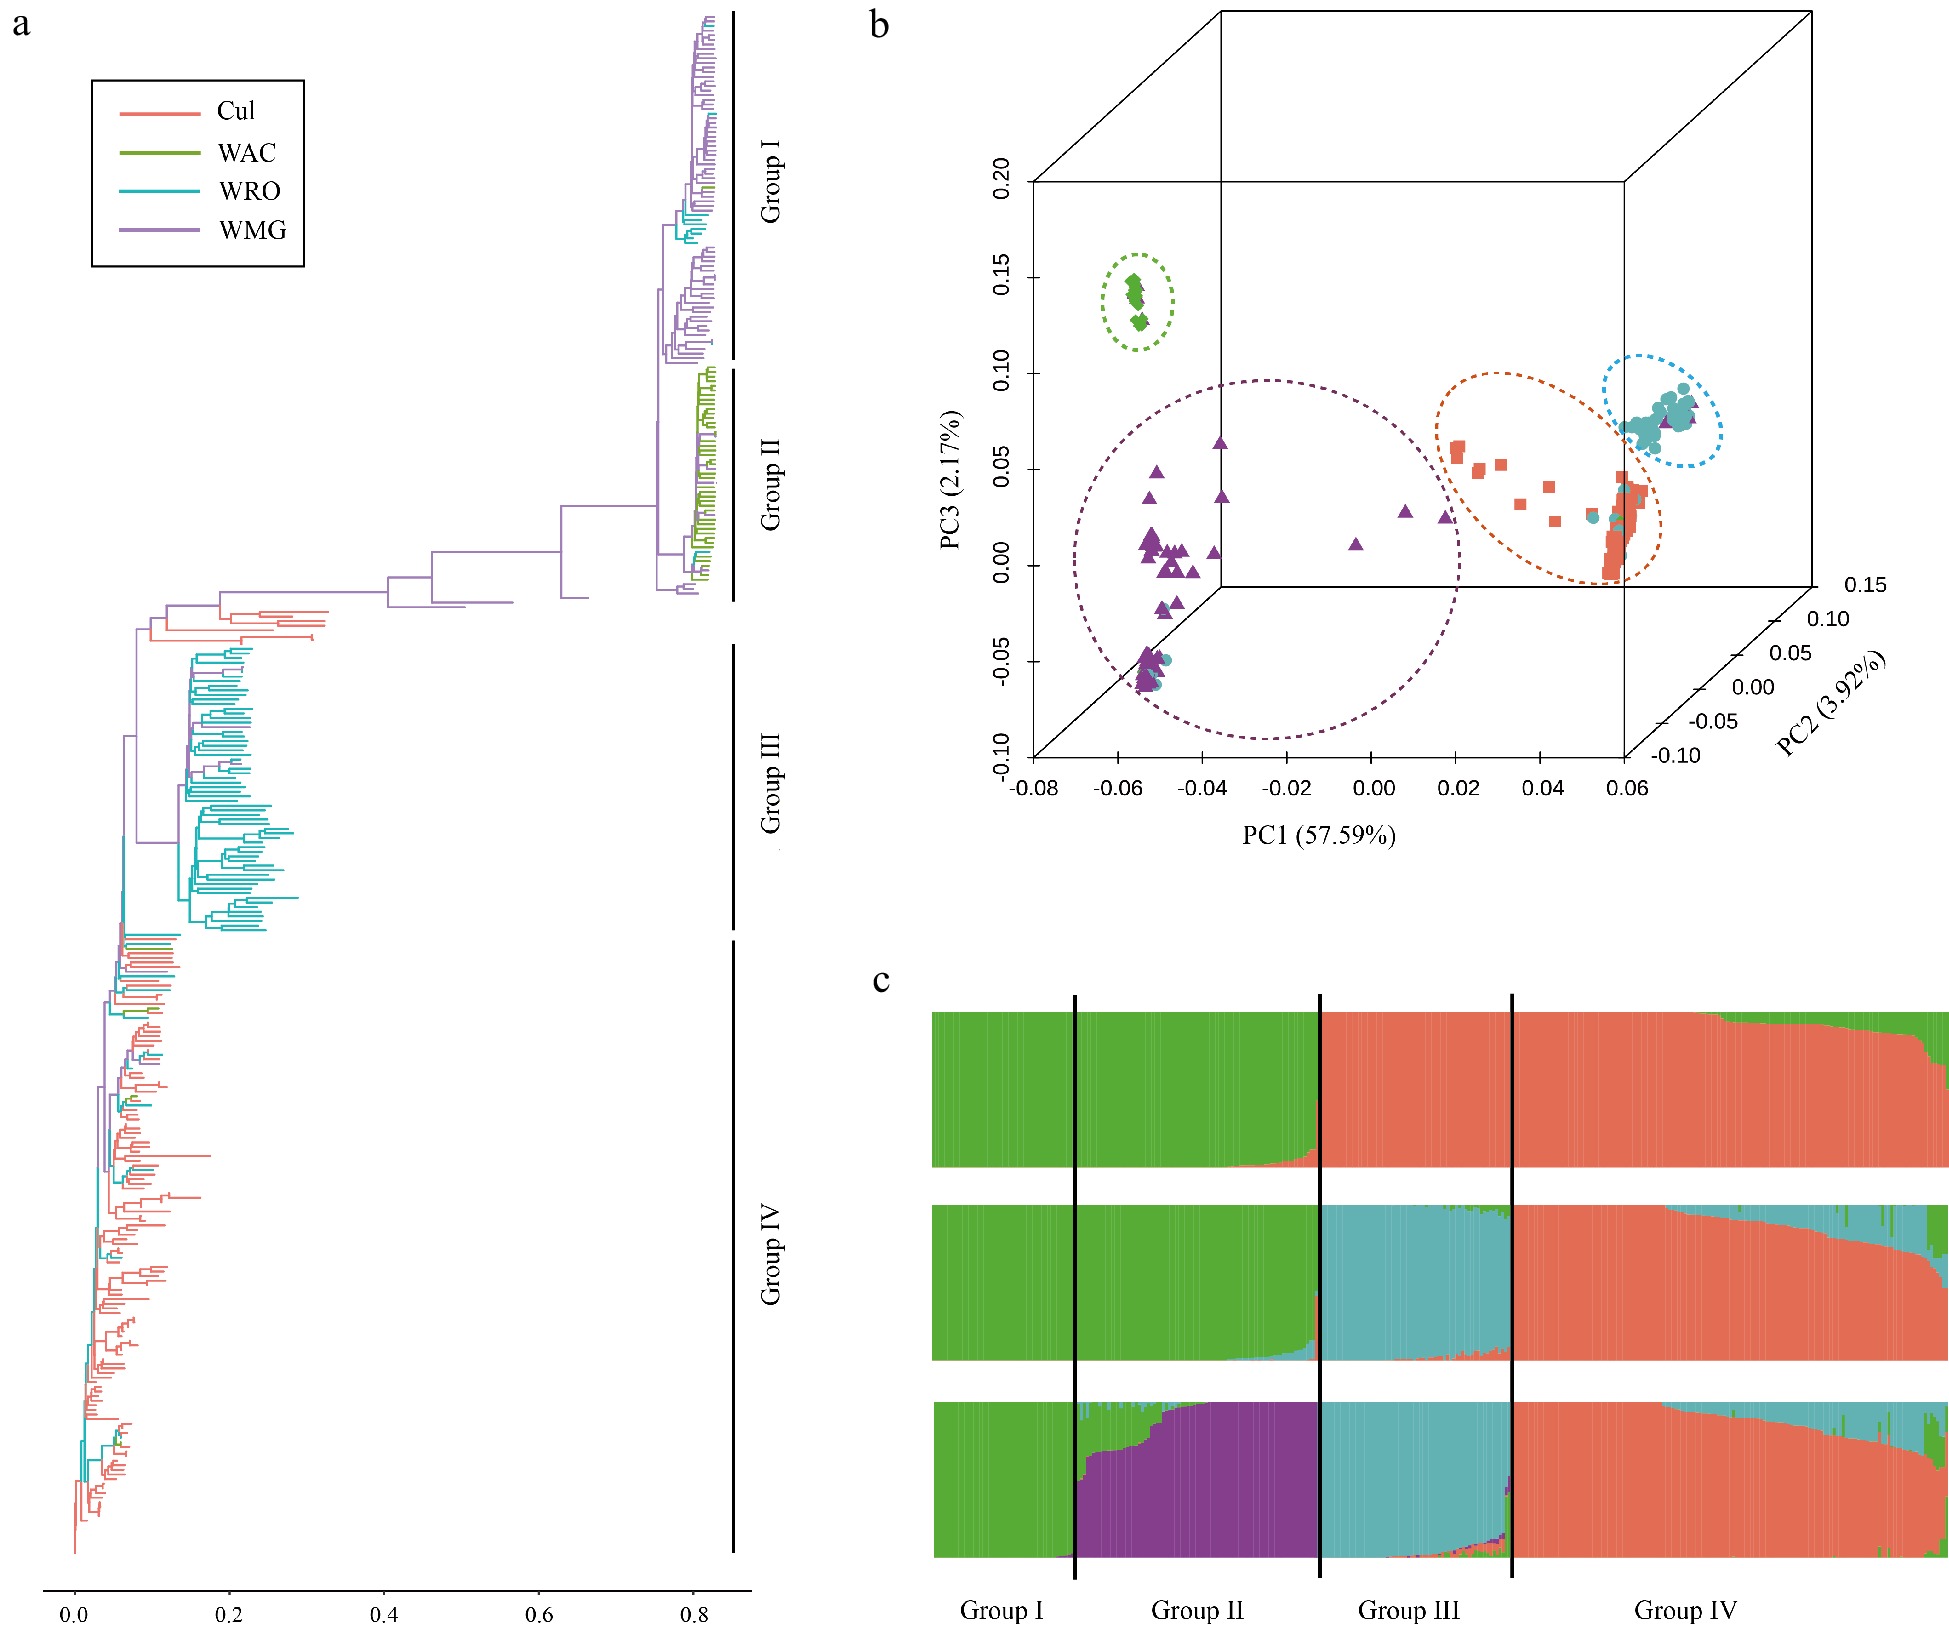
Figure 3.
Application in population genetic diversity analysis. (a) ADMIXTURE analysis. (b) Principal component analysis. (c) Structure analysis.
-
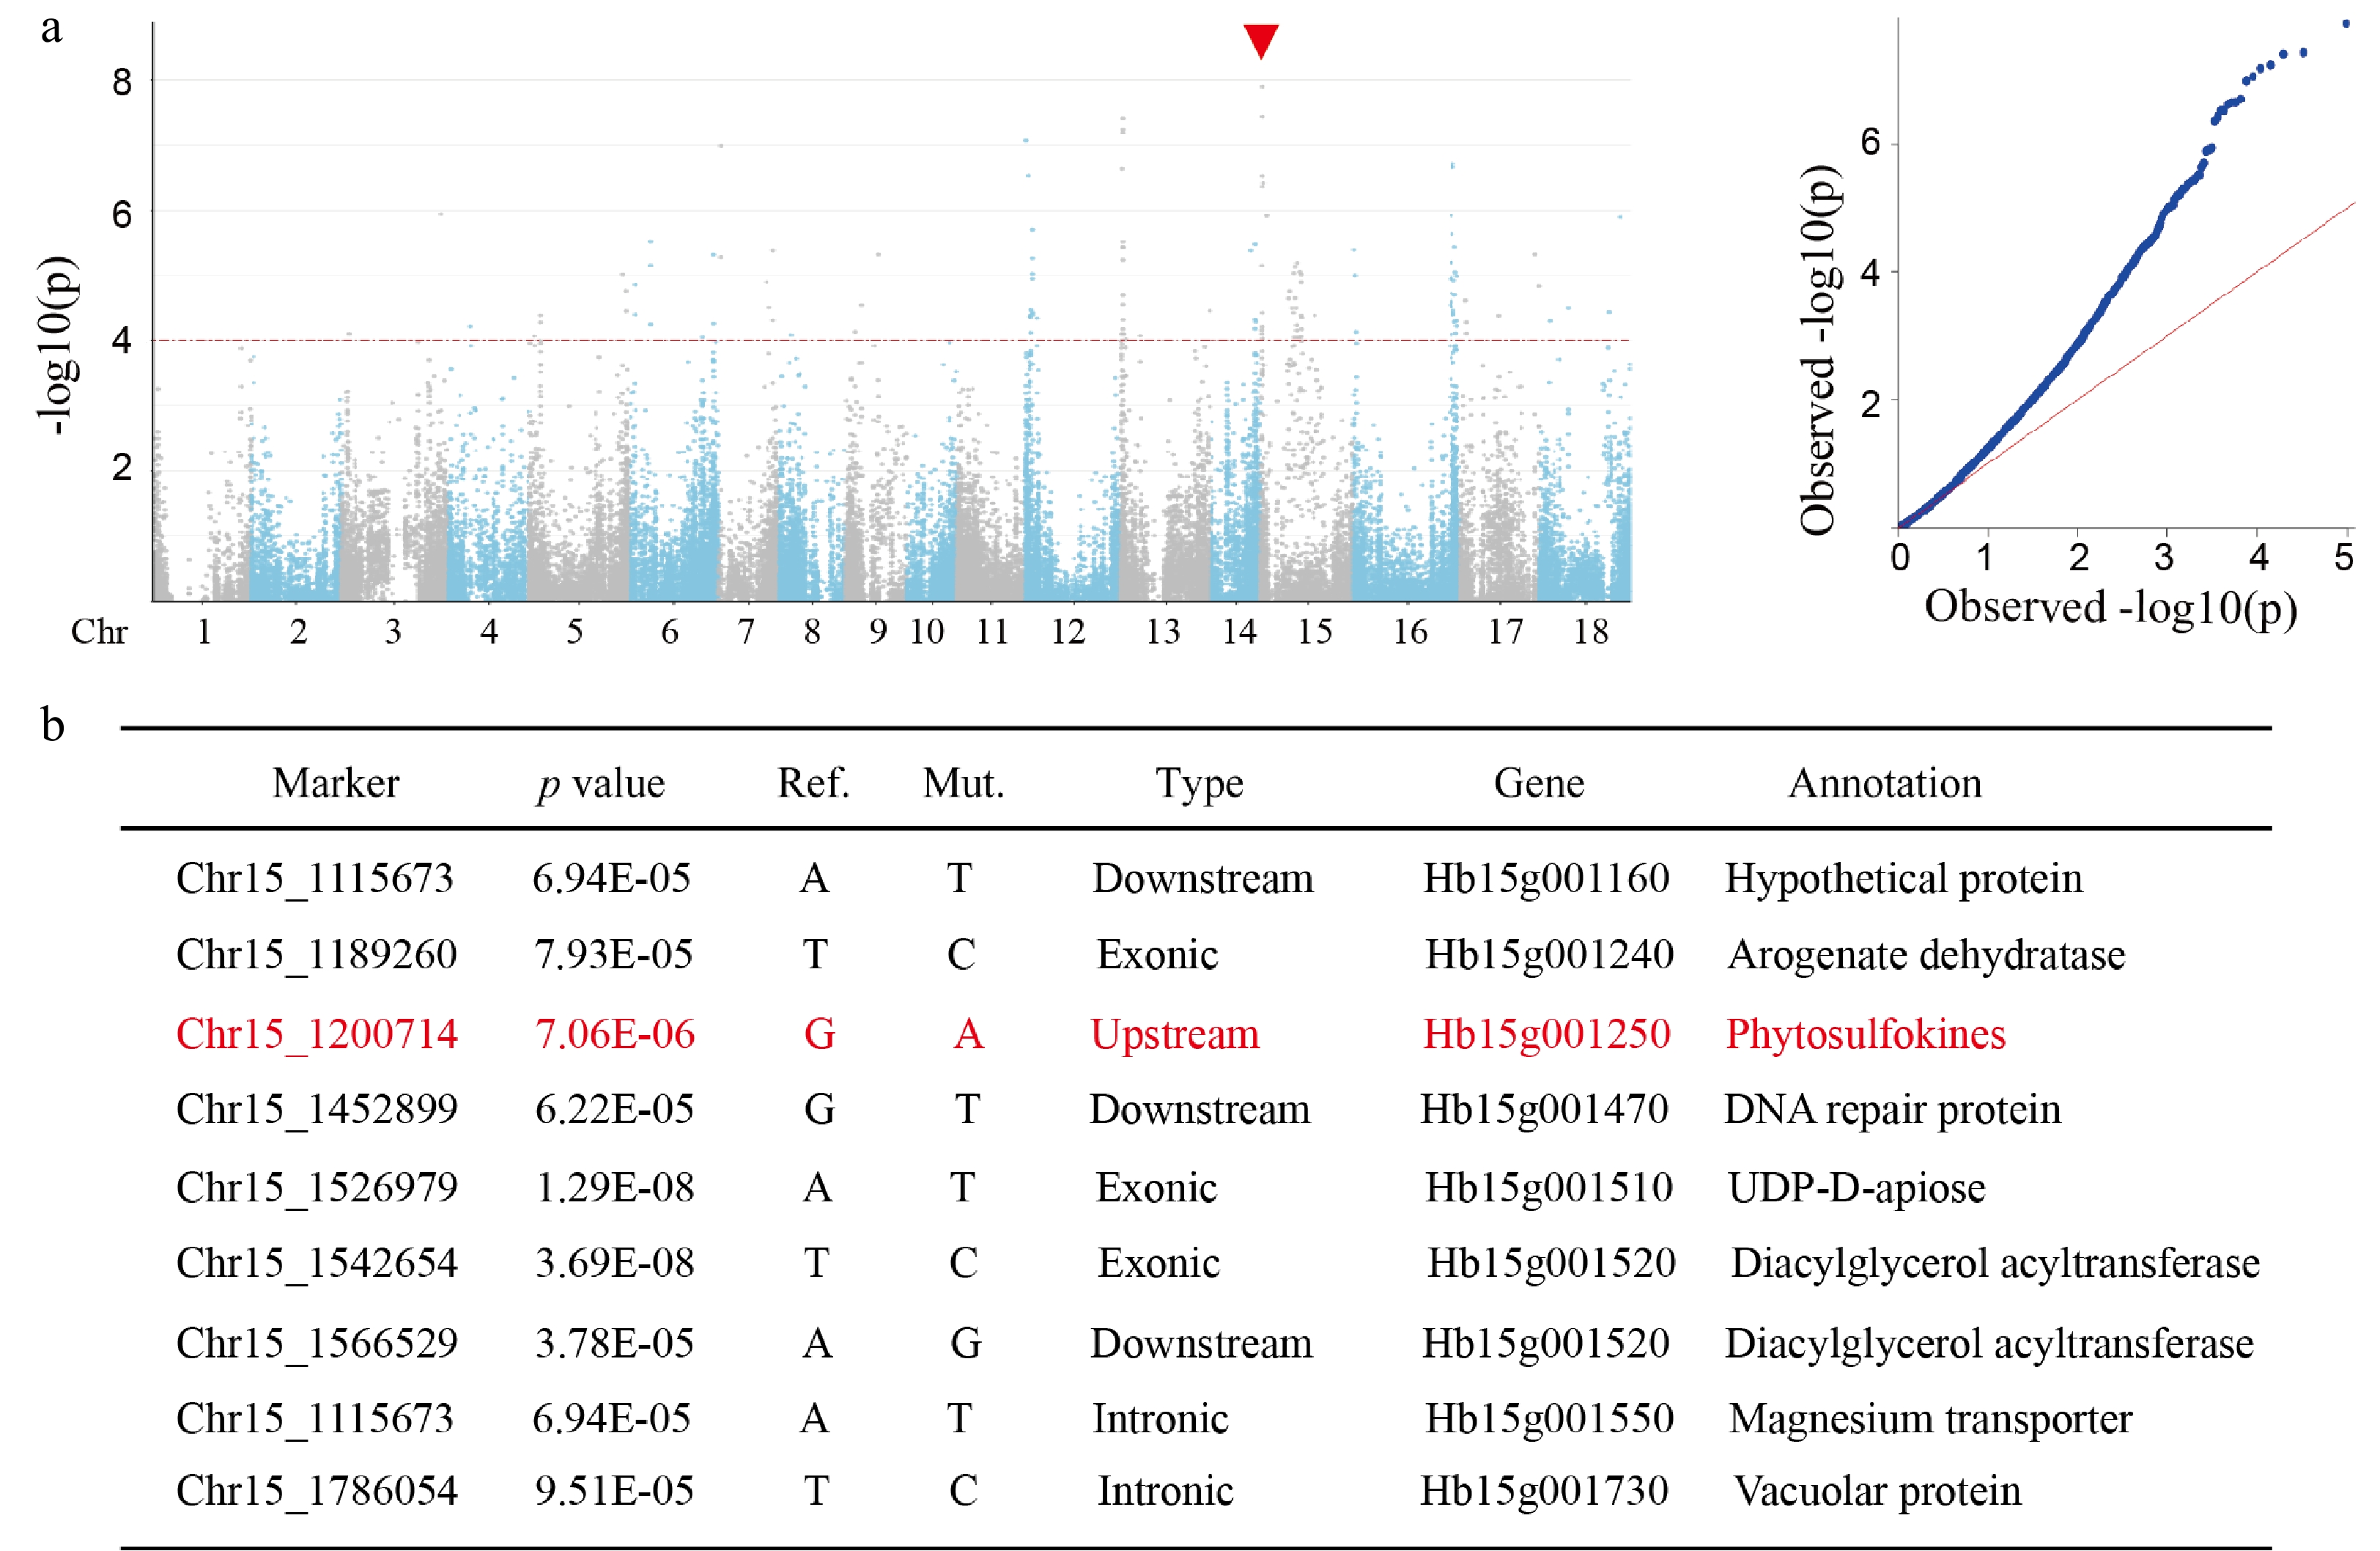
Figure 4.
Application in GWAS. (a) Manhattan plots and Q-Q plots for NLR. (b) Significant markers around the peak signal.
Figures
(4)
Tables
(0)