-
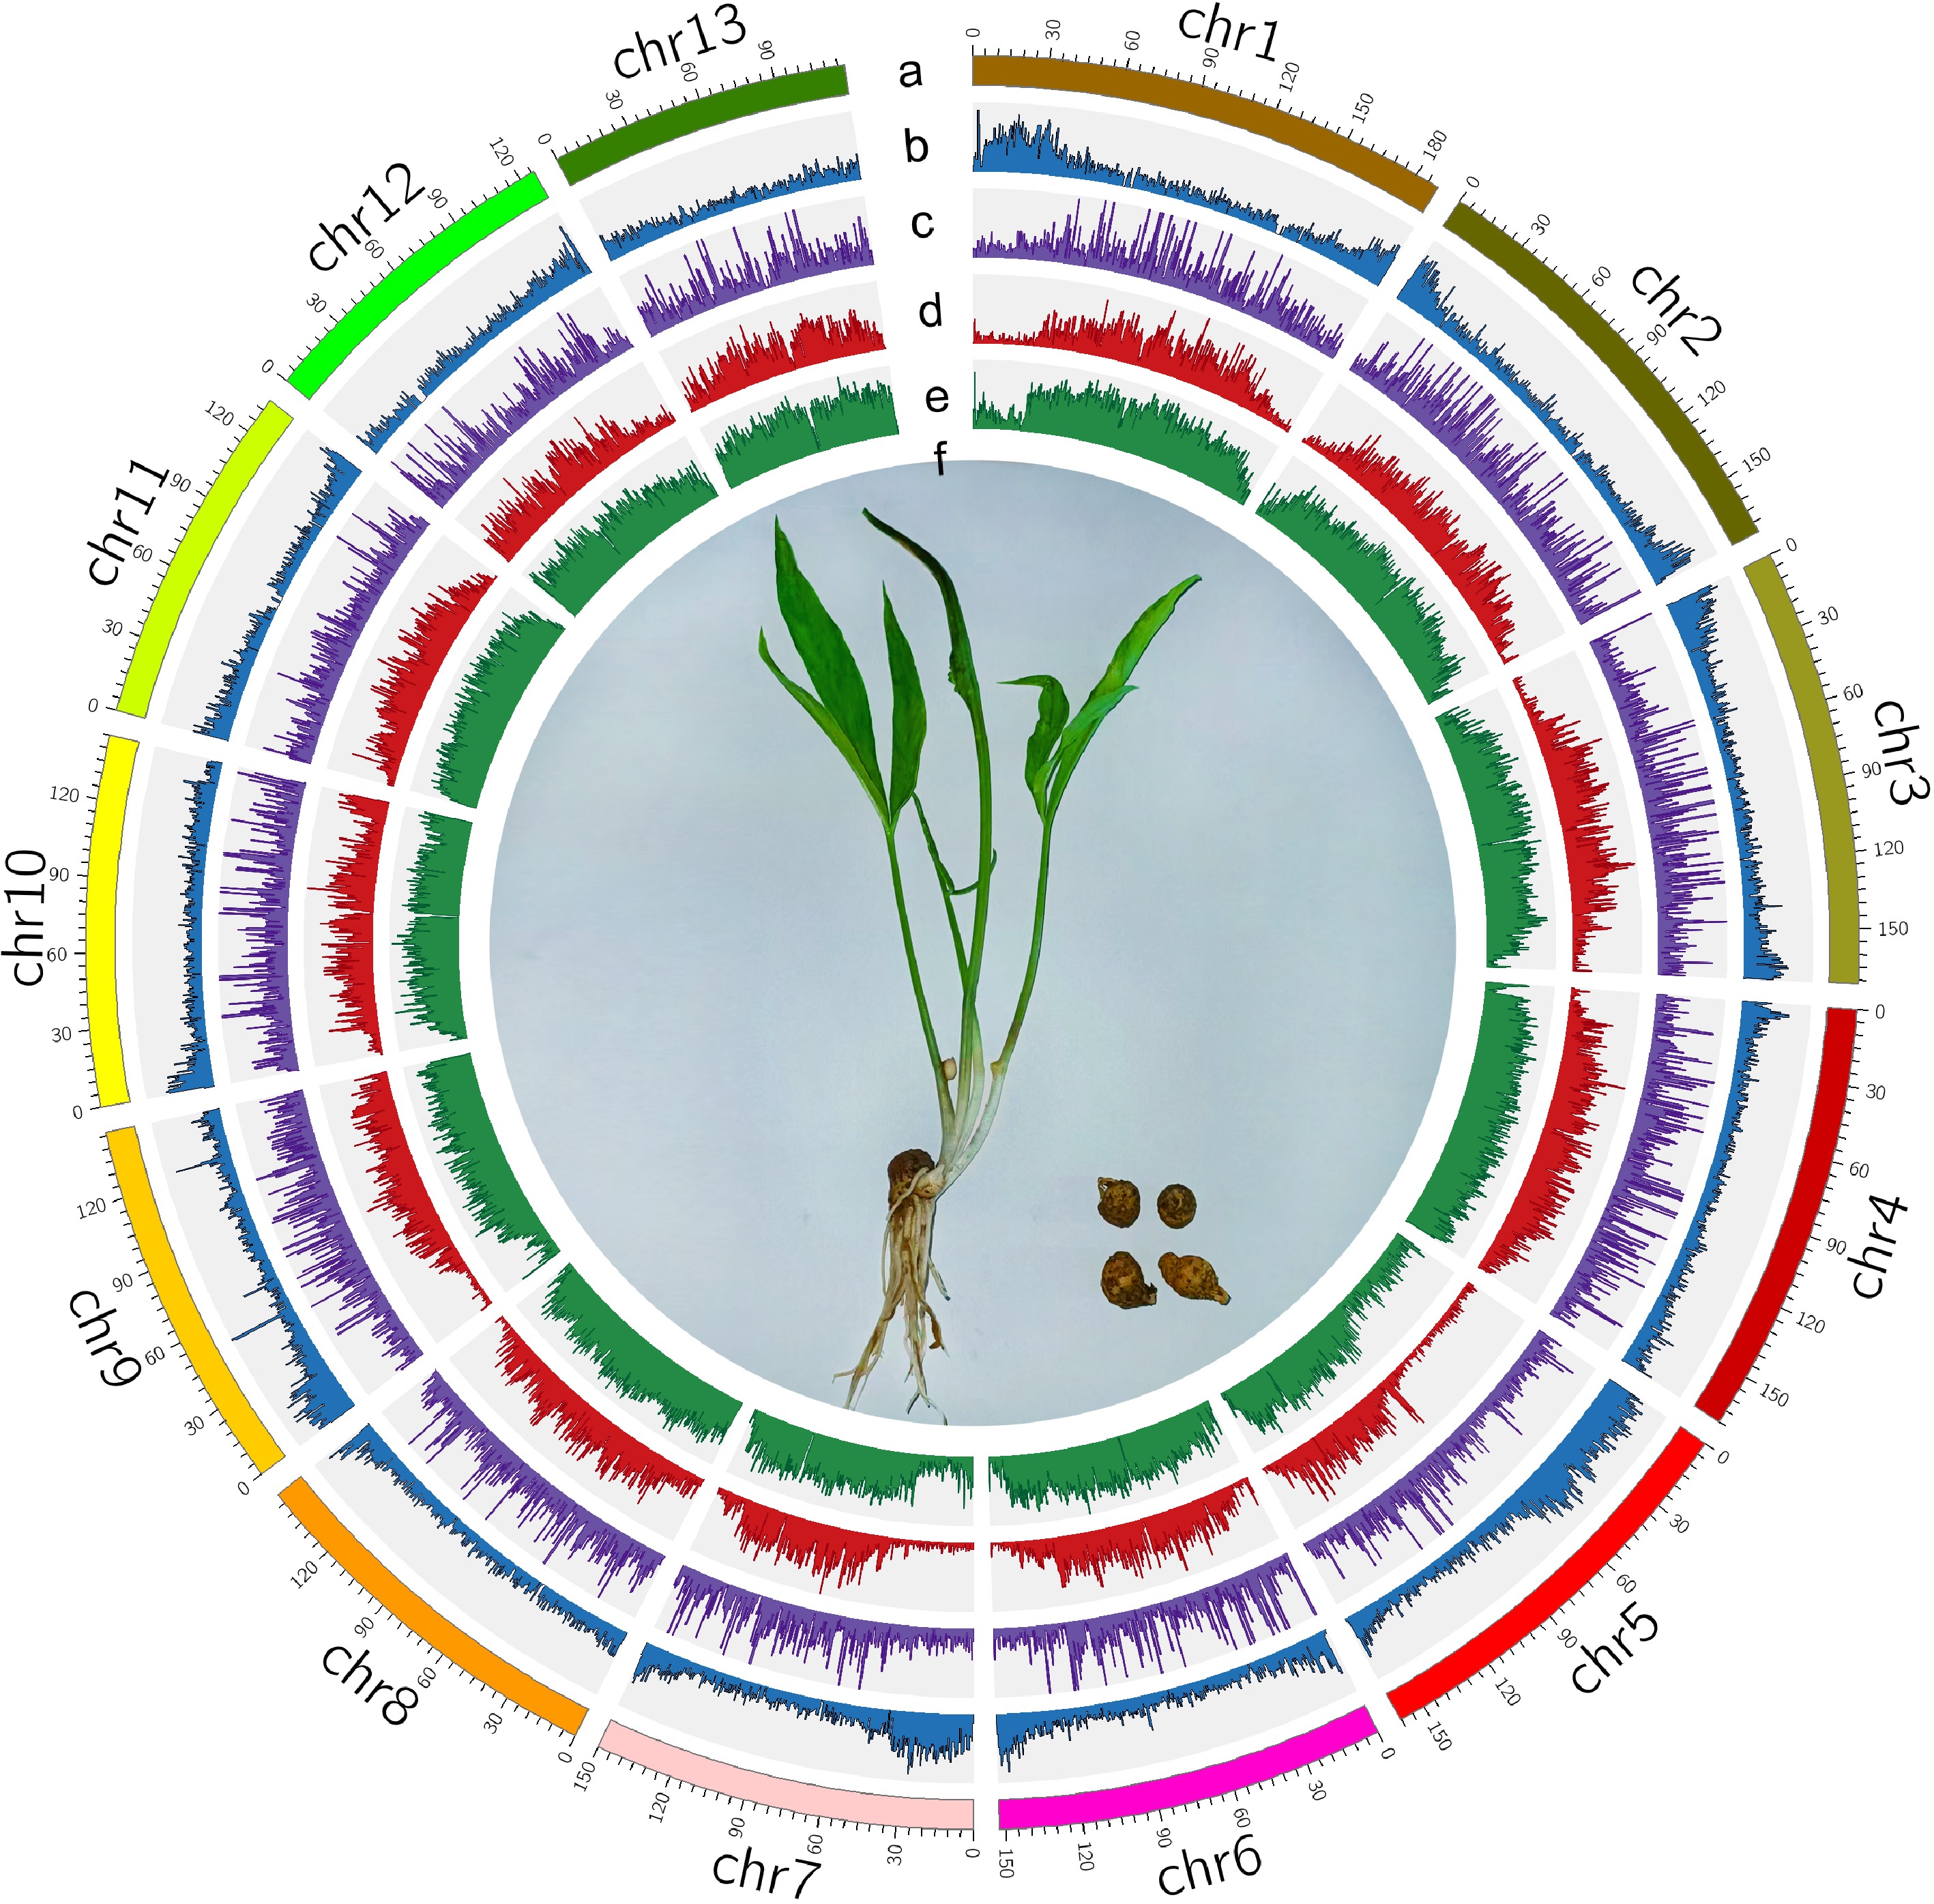
Figure 1.
Genome features of Pinellia ternata. (a) Chromosomes (chr01-Mbchr13); (b) Gene density; (c) DNA transposable elements; (d) LTR/Copia; (e) LTR/Gypsy; (f) P. ternata.
-
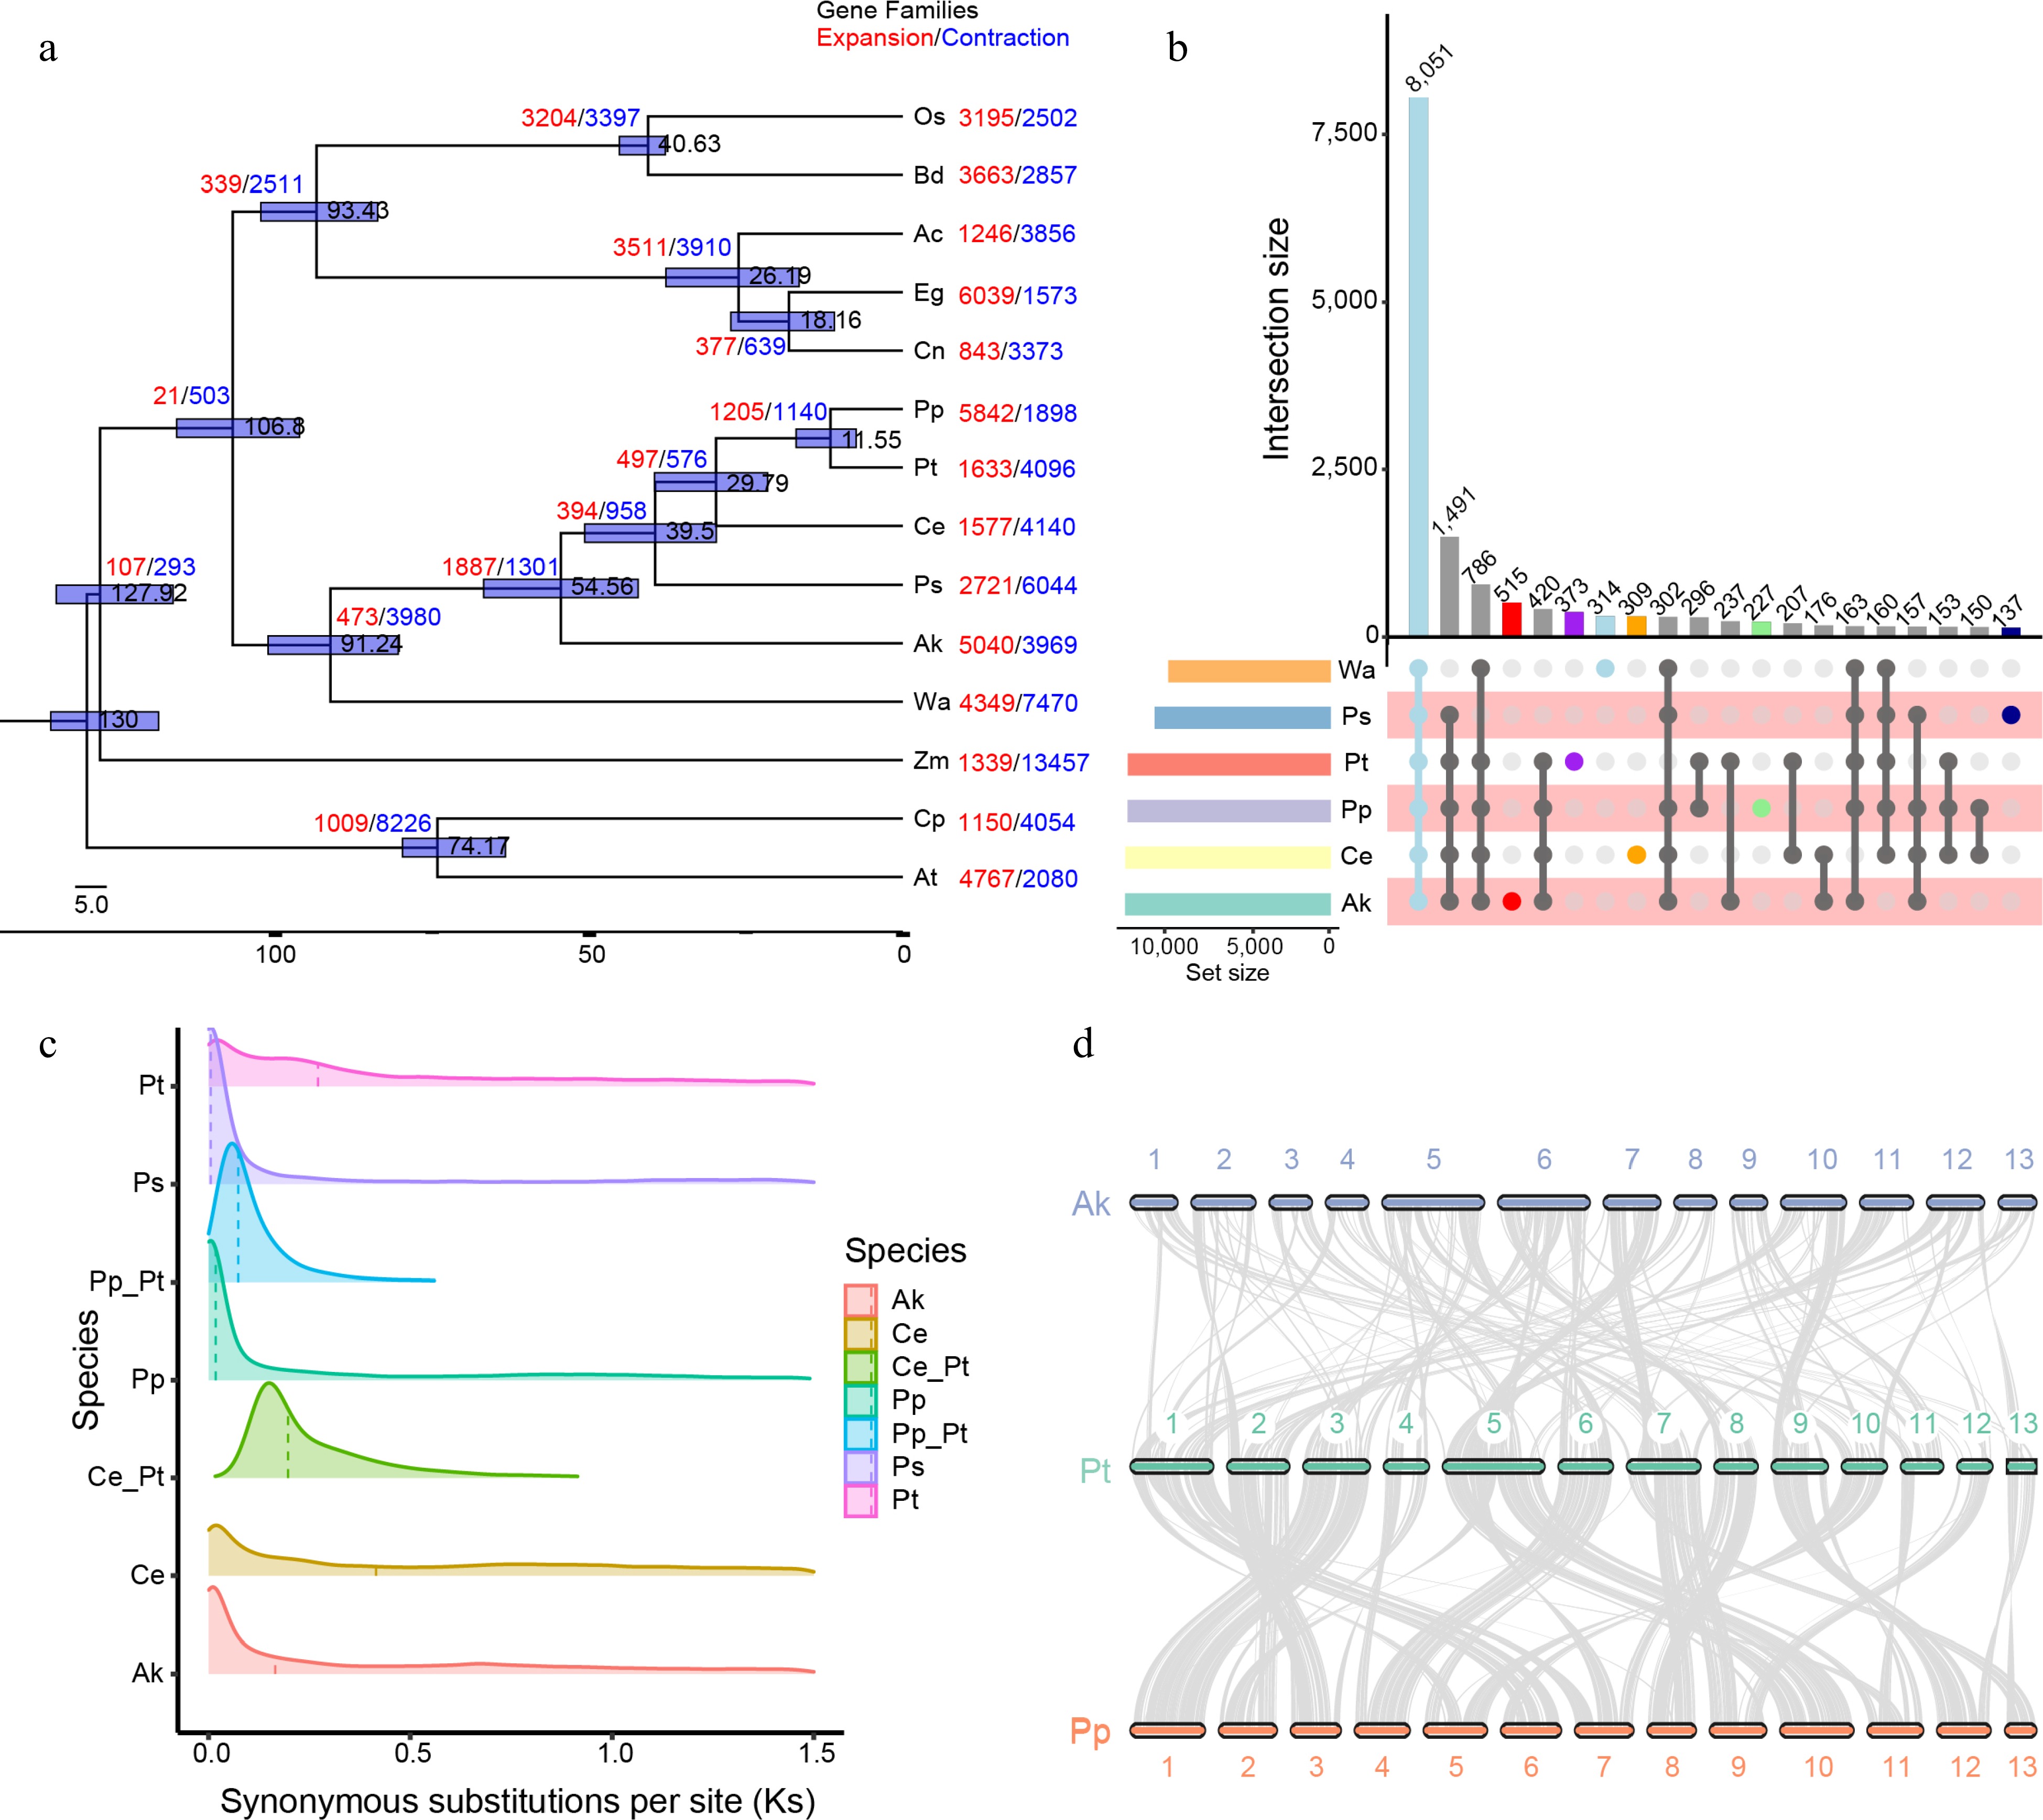
Figure 2.
Evolution and gene family analysis of Pinellia ternata and other representative plant genomes. (a) Phylogenetic analysis of the P. ternata genome and expansions and contractions of gene families. Gene family expansions and contractions are indicated by the numbers in red and blue, respectively. (b) The distribution of shared and specific gene families among six species. Upper diagram showing the distribution of shared gene families among six species. Lower diagram showing gene family complement comparisons among Wolffia australiana, Amorphophallus konjac, Pinellia pedatisecta and Pistia stratiotes, Colocasia esculenta, and P. ternata. There were 8,051 common gene families and 373 P. ternata-specific gene families. (c) Ks distribution among P. ternata and three other species. Different color indicates Ks distribution within and between genomes. (d) Synteny between P. ternata, Amorphophallus konjac and Pinellia pedatisecta. The colored line connects matched gene pairs. The numbers indicate the corresponding chromosomes in each species, Pt, Pp and Ak represents P. ternata, P. pedatisecta and A. konjac, respectively.
-
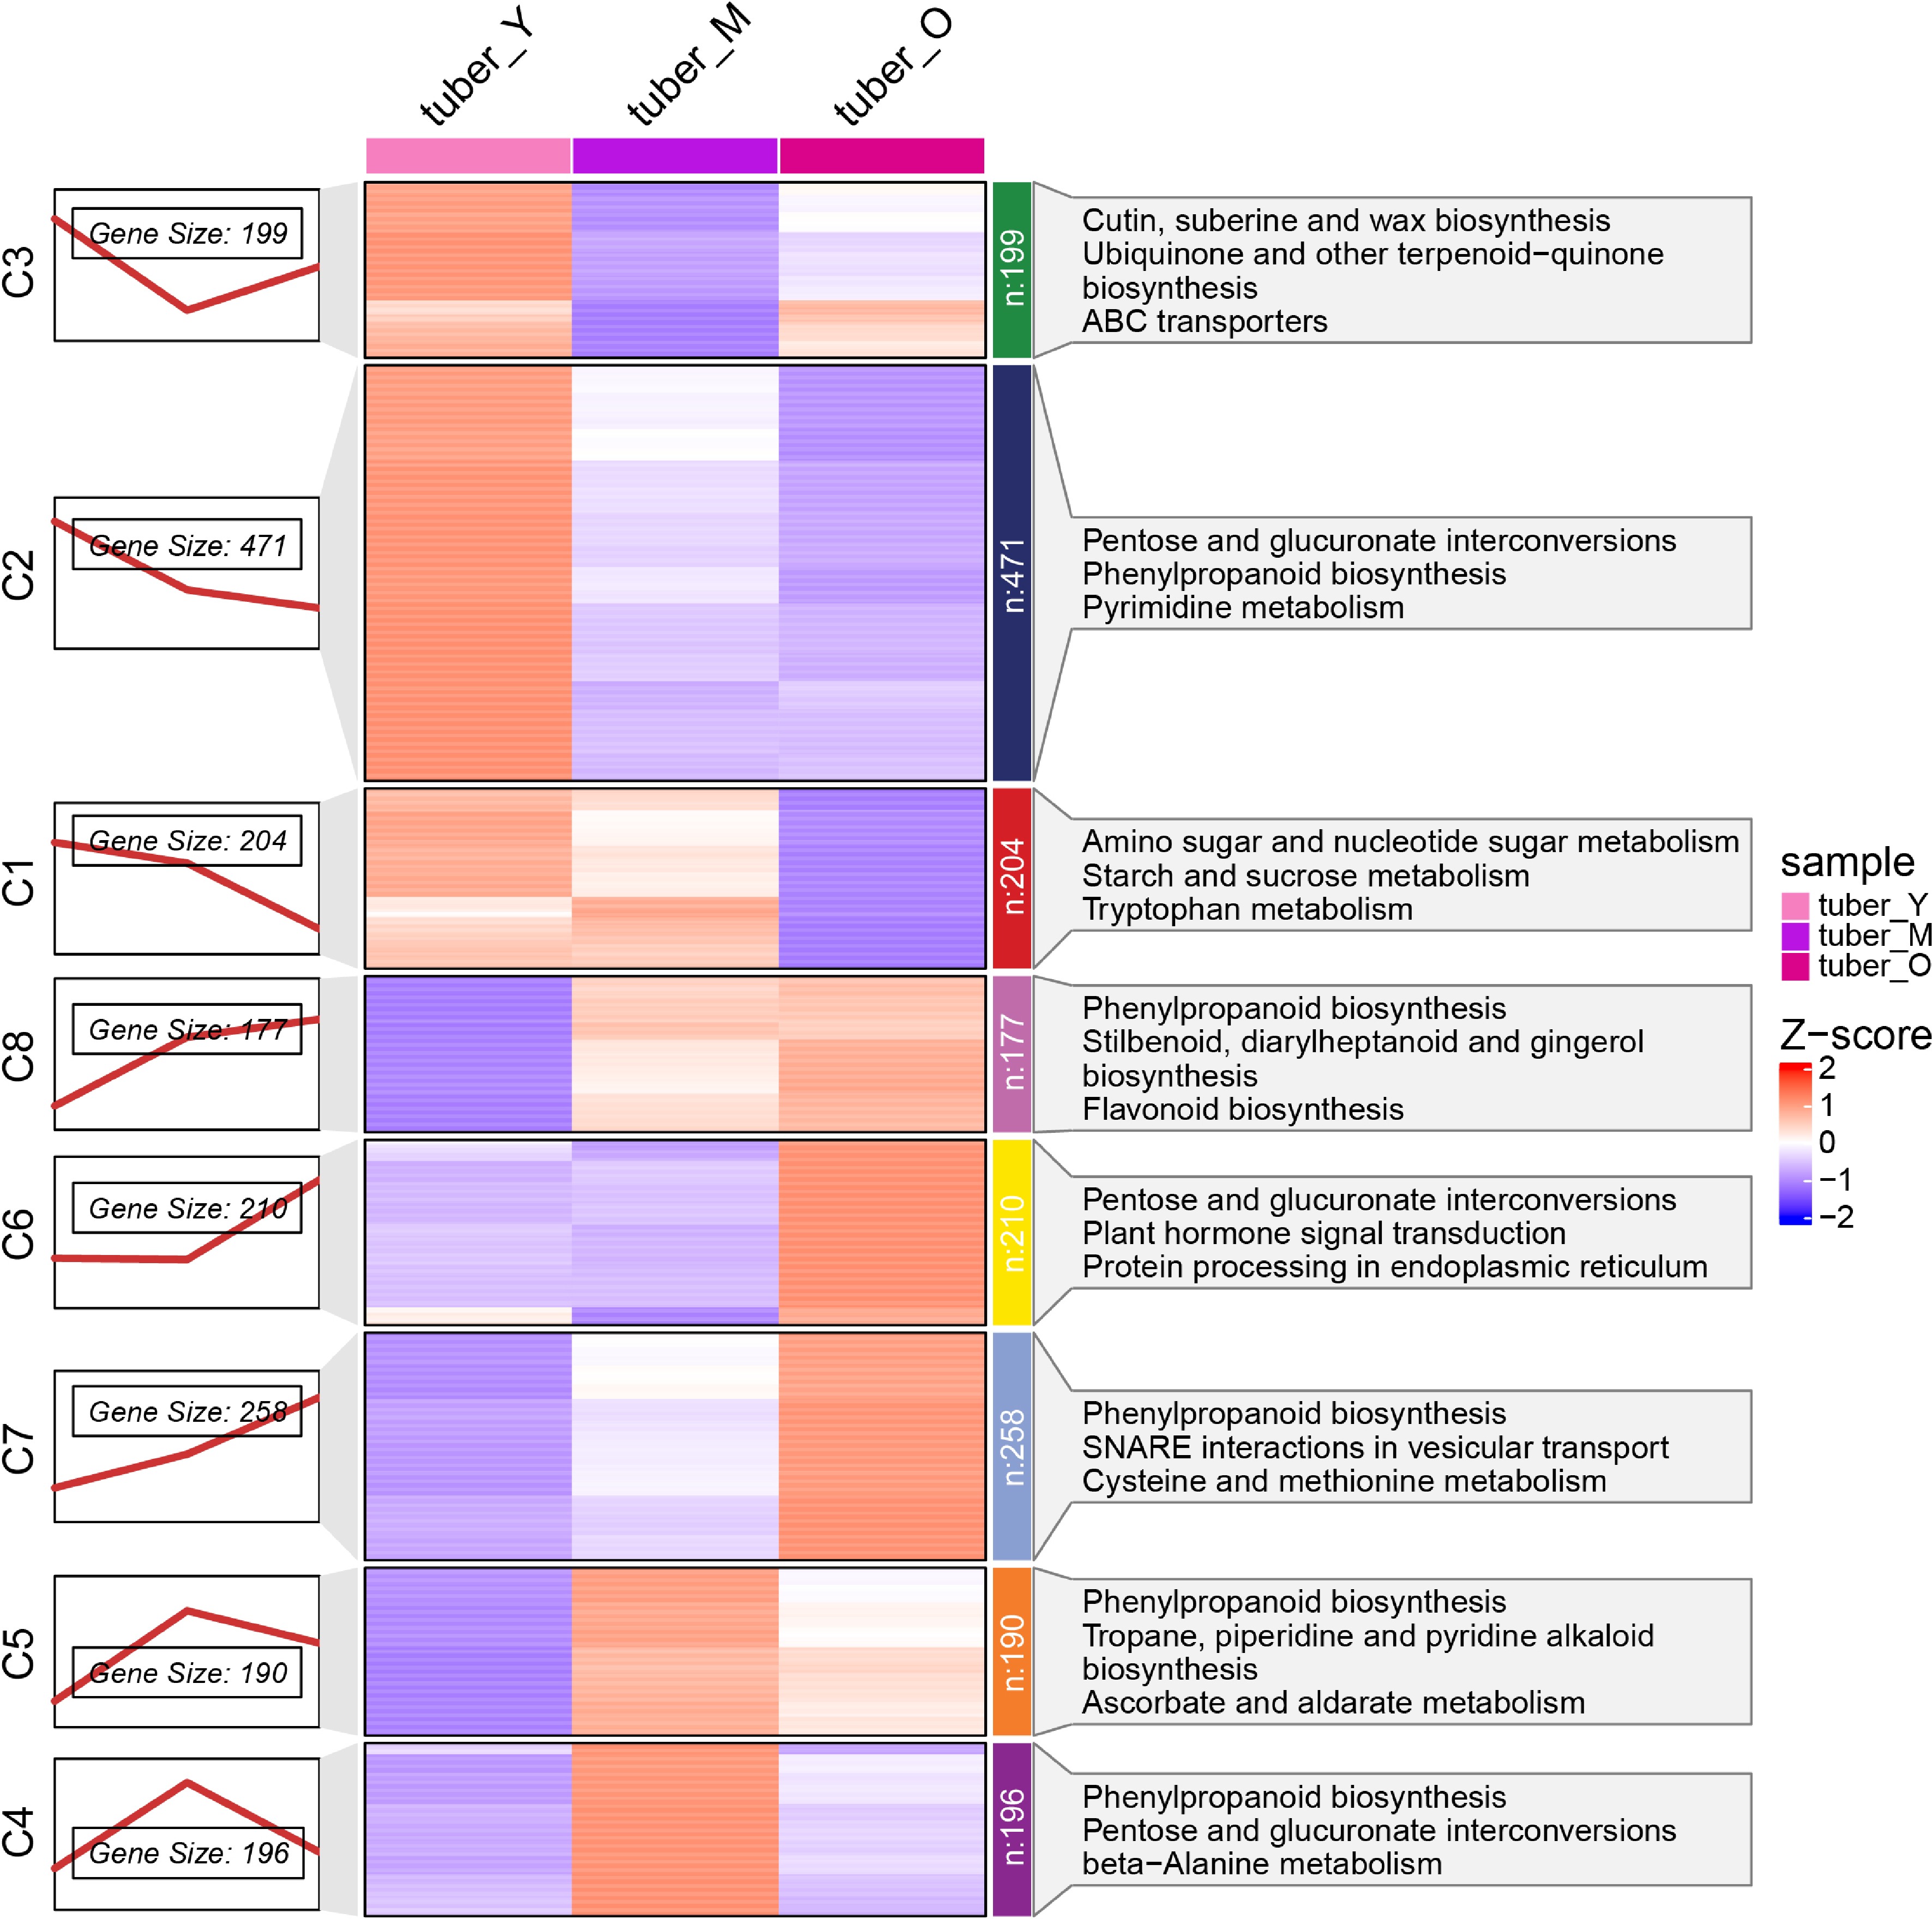
Figure 3.
Different gene regulatory landscape in different development stages of Pinellia ternata tuber. (a) Eight expression profile types of DEGs by K-Means clustering, (b) heatmap analysis of all DEGs in eight clusters, (c) pathway enrichment of DEGs in eight clusters.
-
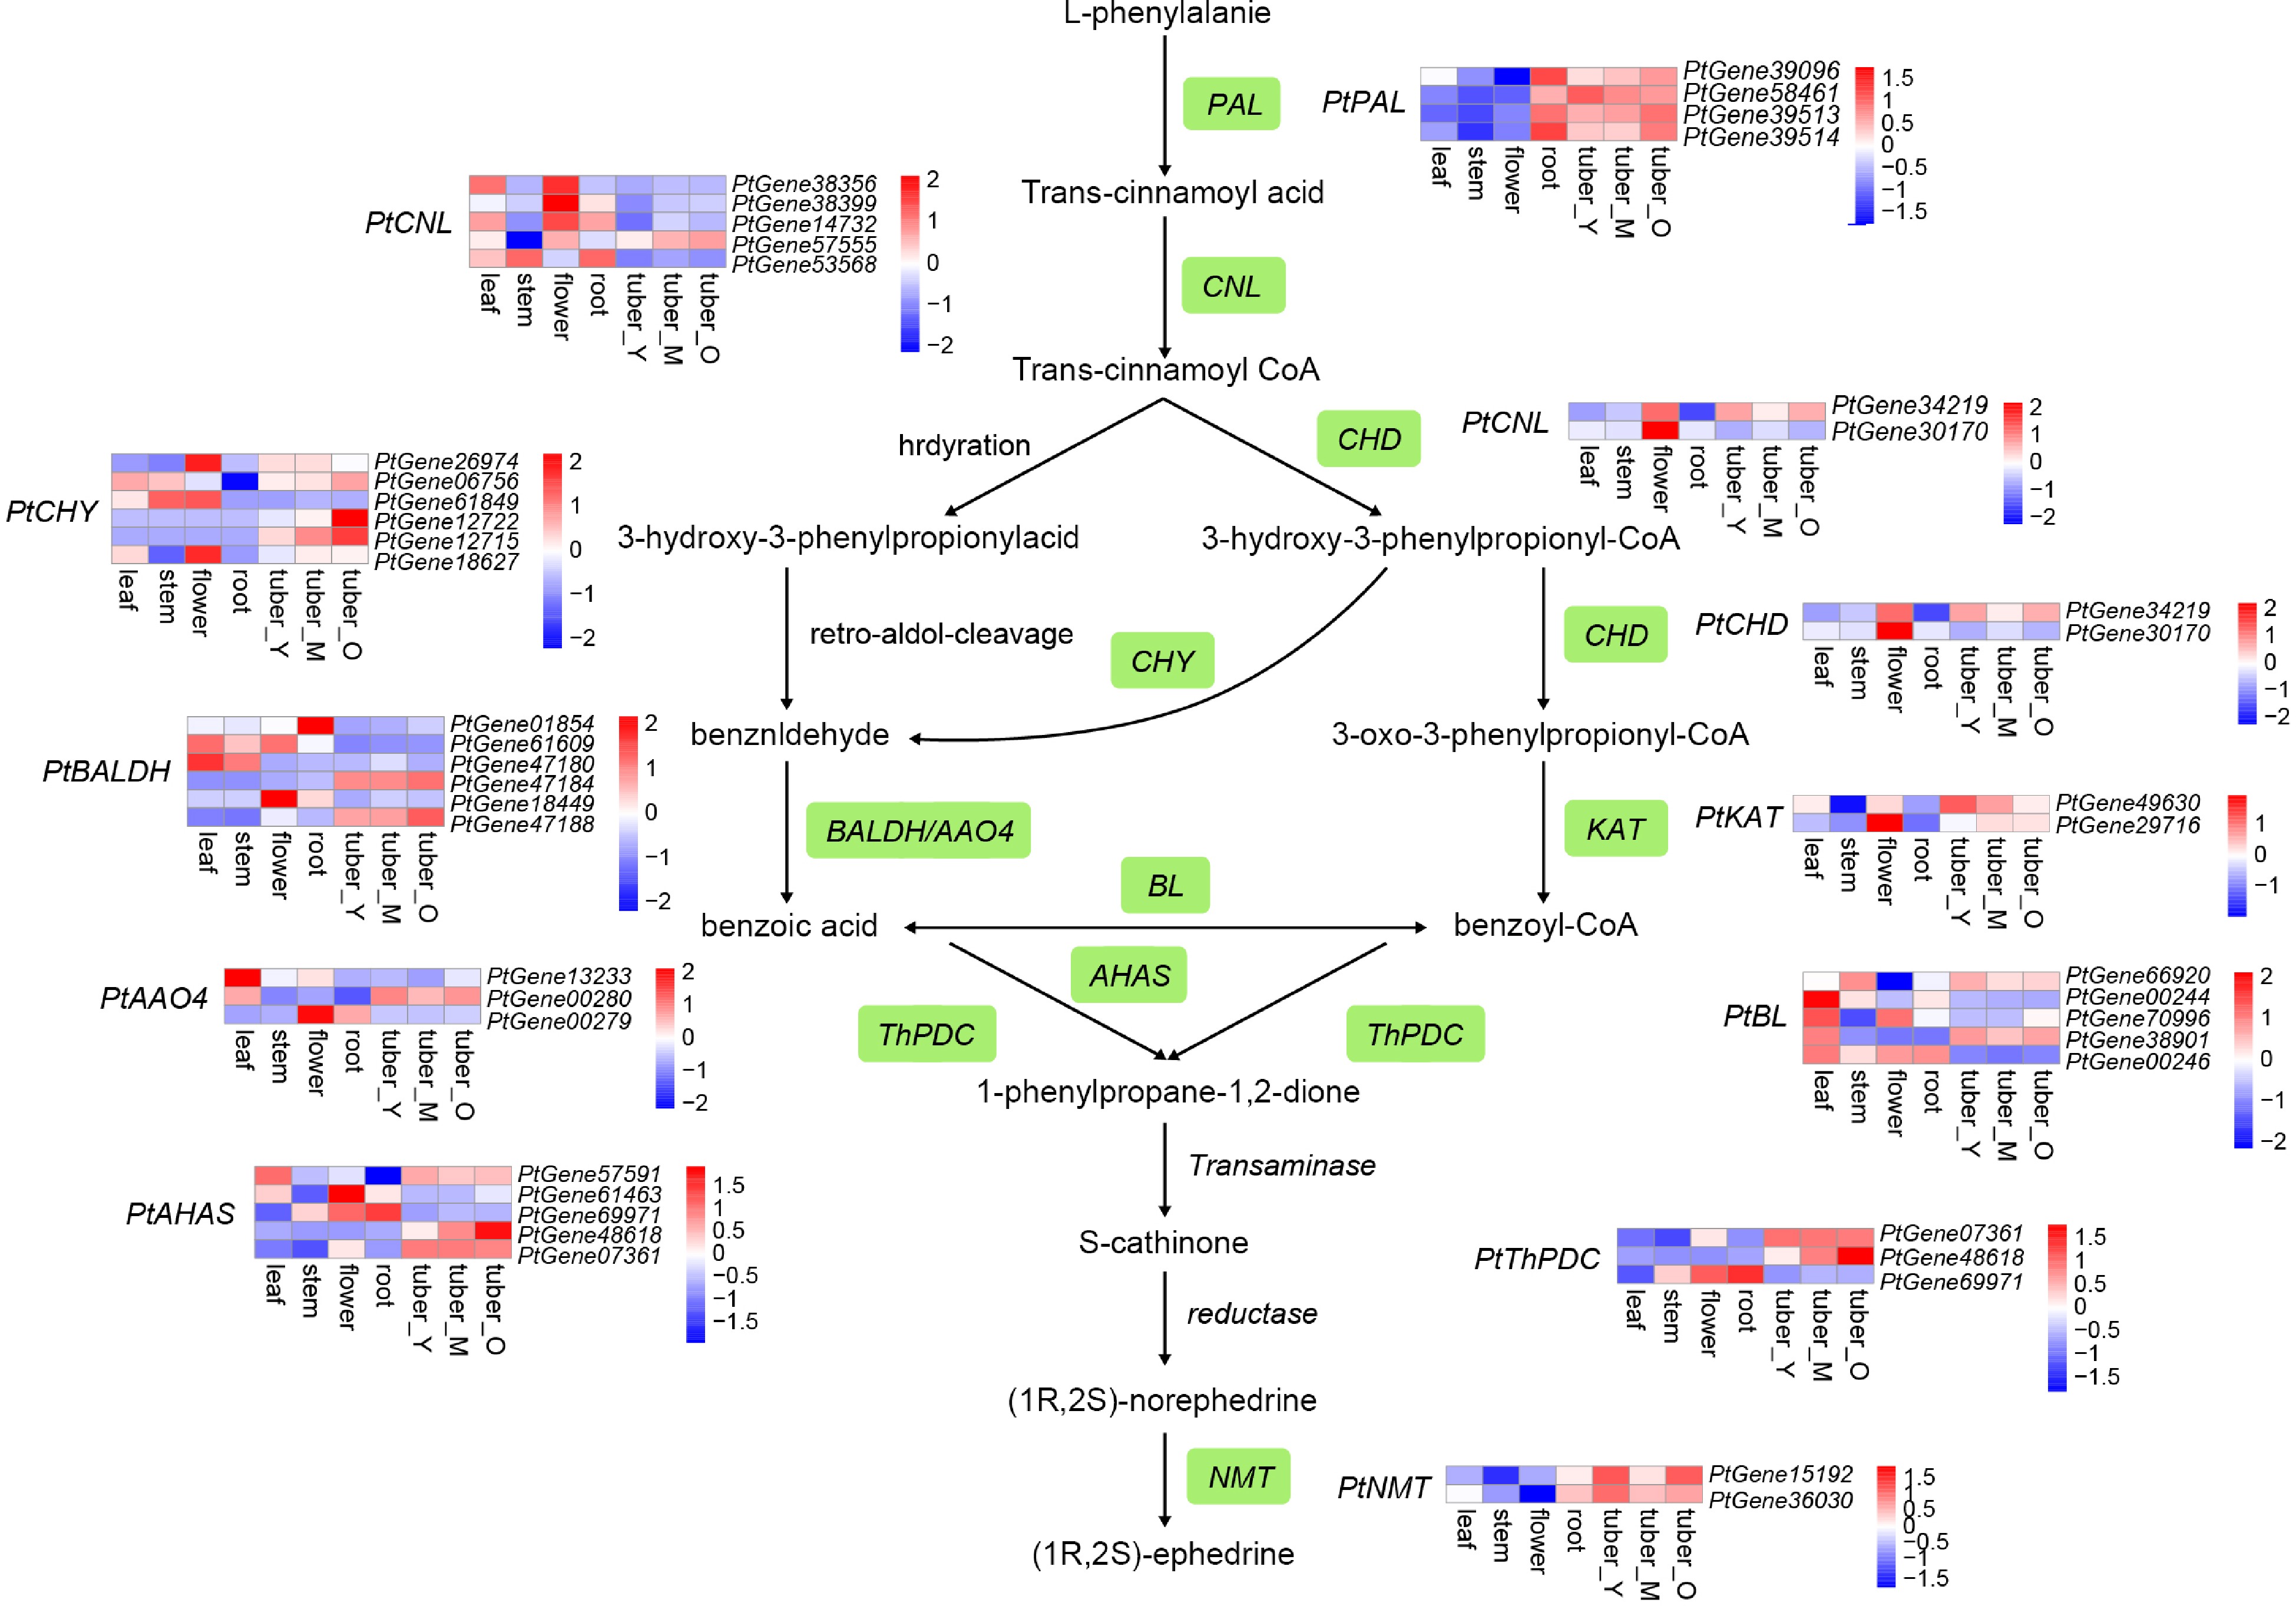
Figure 4.
Simplified representation of the ephedrine biosynthetic pathway. Top hits for pathway genes identified by blast are highlighted in green. The expression value for each gene is indicated in color on a log2 (FPKM + 1) scale for seven tissue types: leaf, stem, flower, root, young tuber (tuber_Y), medium tuber (tuber_M), and old tuber (tuber_O).
-
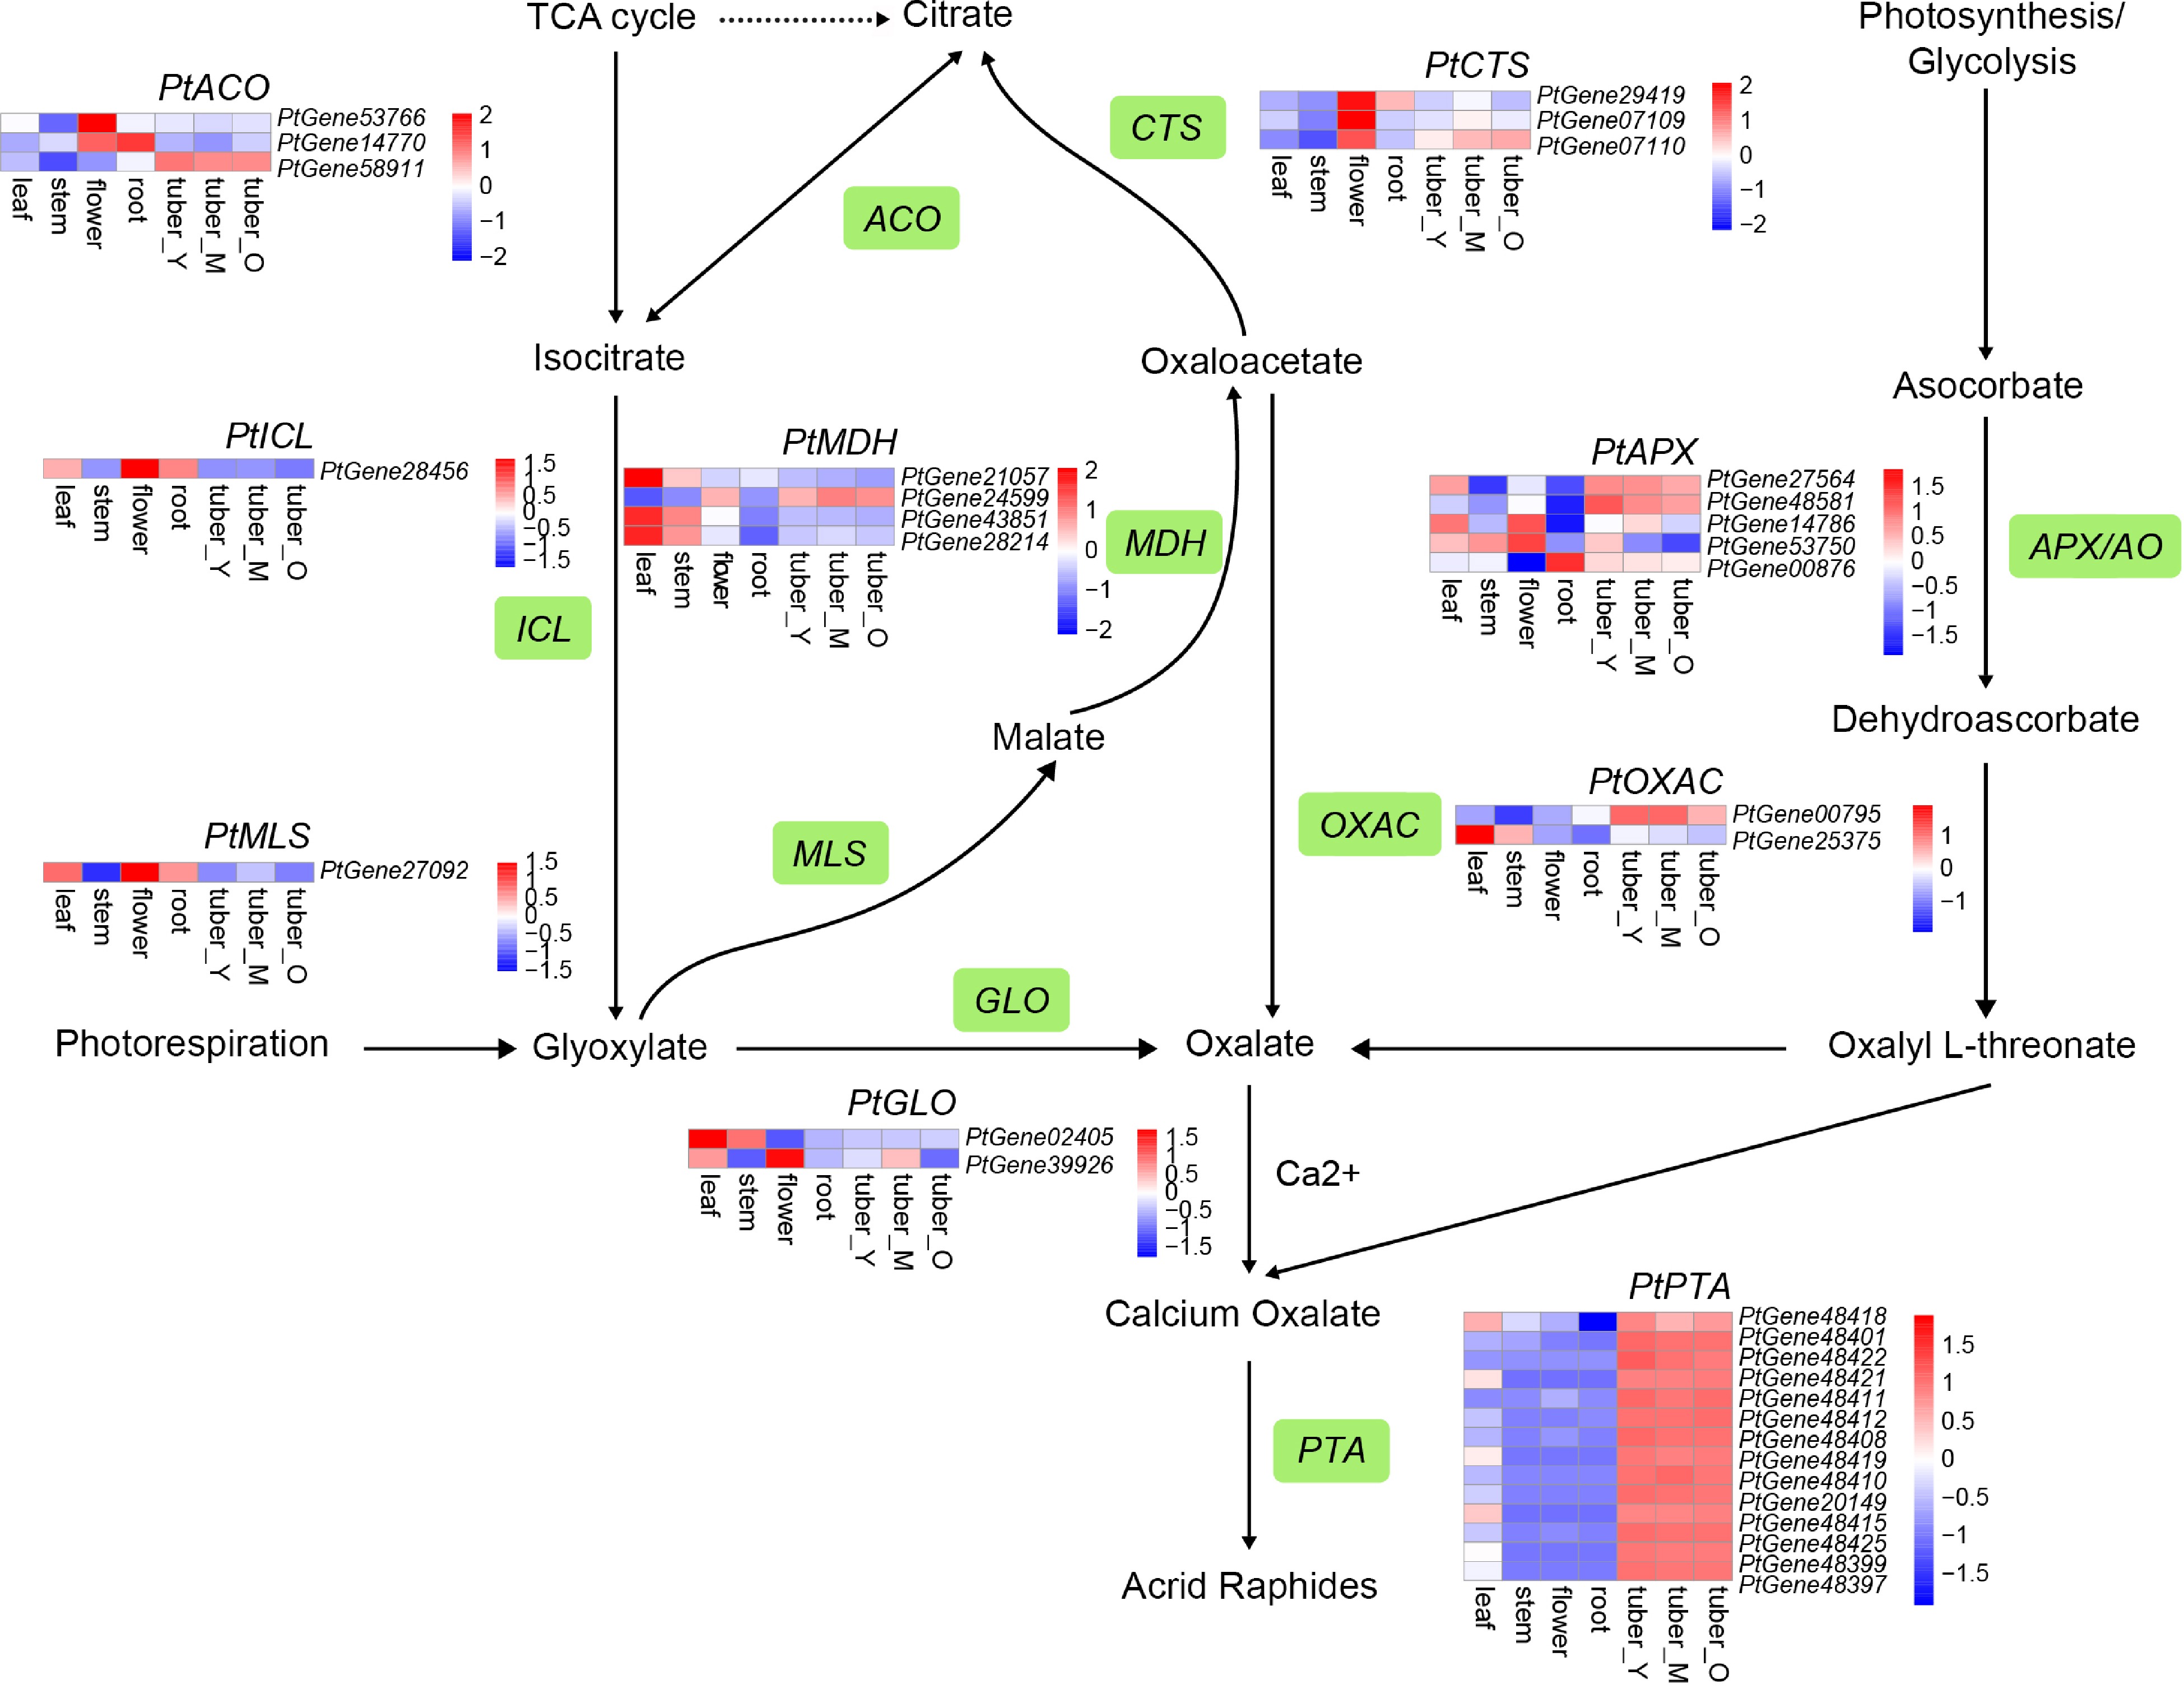
Figure 5.
Simplified representation of oxalate biosynthesis and acrid raphides formation. The enzyme names are as follows: glycolate oxidase (GLO); oxaloacetate acetylhydrolase (OXAC); malate synthase (MLS); malate dehydrogenase (MDH); citrate synthase (CTS); aconitase (ACO); isocitrate lyase (ICL); ascorbate peroxidase/ascorbate oxidase (APX/AO); lectin. Top hits for pathway genes identified by blast are highlighted in green. The expression value for each gene is indicated in color on a log2 (FPKM + 1) scale for seven tissue types: leaf, stem, flower, root, tuber_Y, tuber_M, and tuber_O.
Figures
(5)
Tables
(0)