-
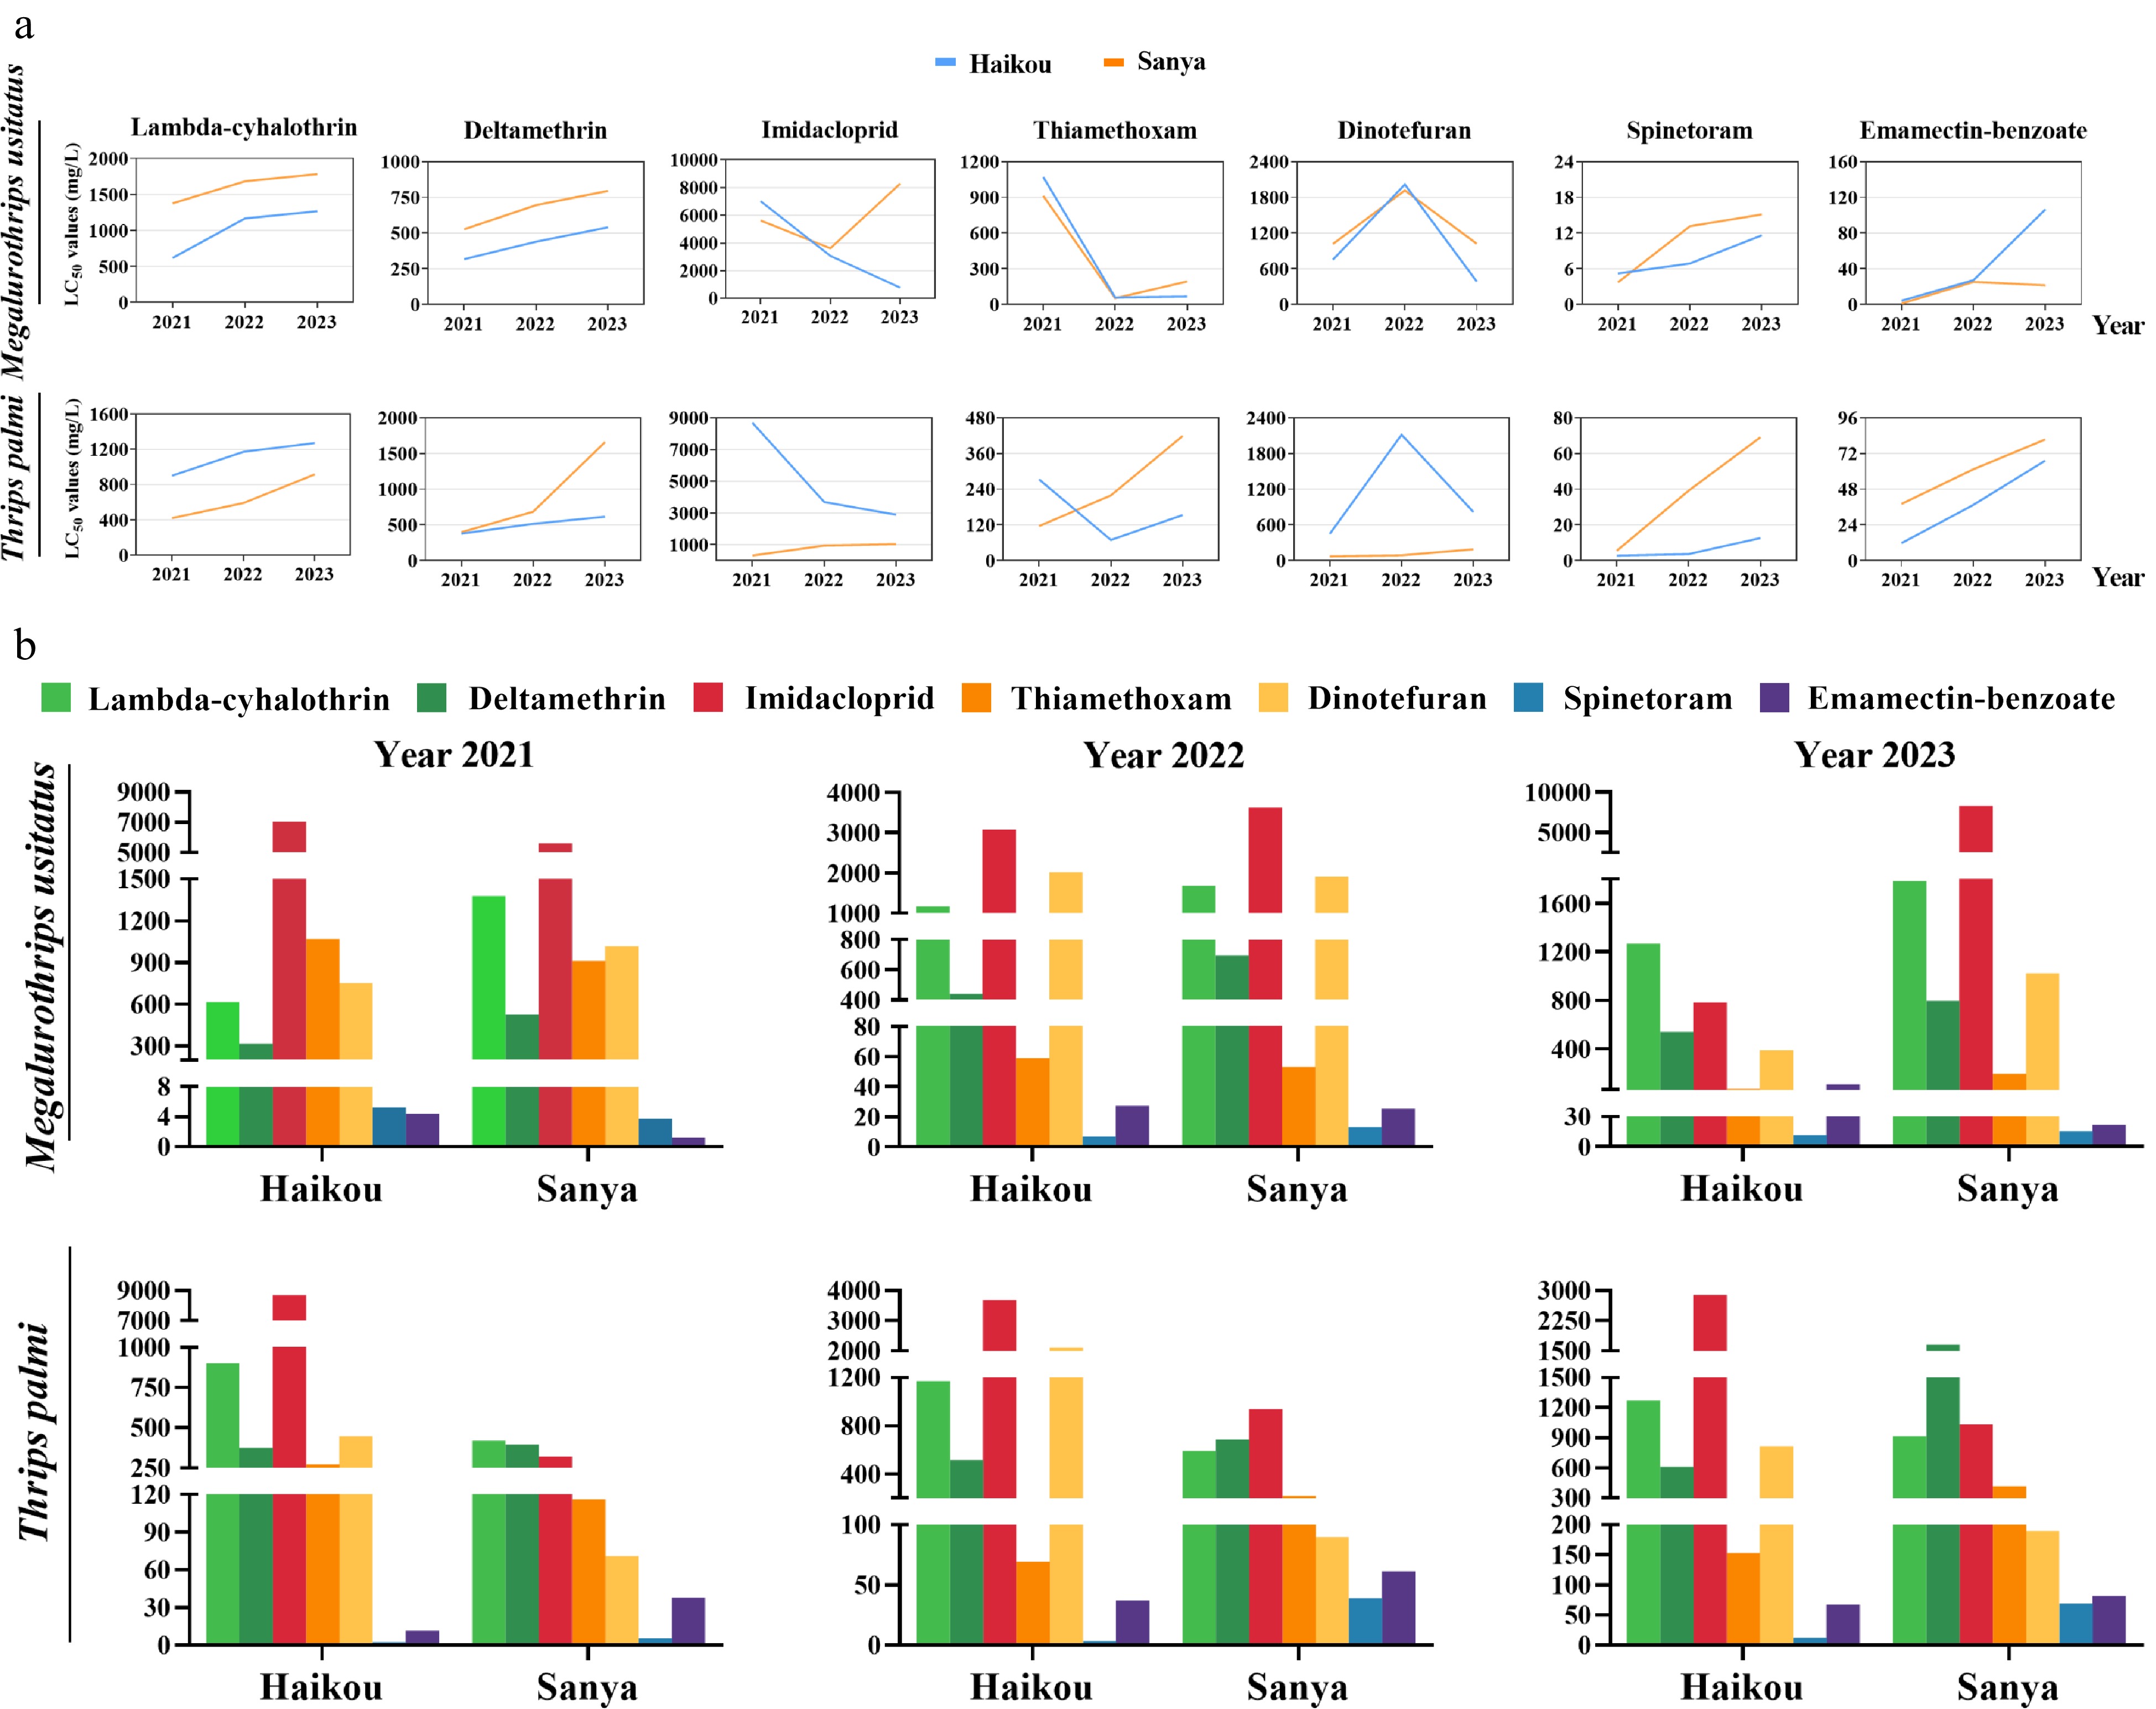
Figure 1.
Insecticide resistance of M. usitatus and T. palmi. (a) The resistance levels of two field populations to each insecticide from 2021 to 2023. (b) The annual resistance levels of the thrip populations to seven insecticides in the Haikou and Sanya regions (China).
-
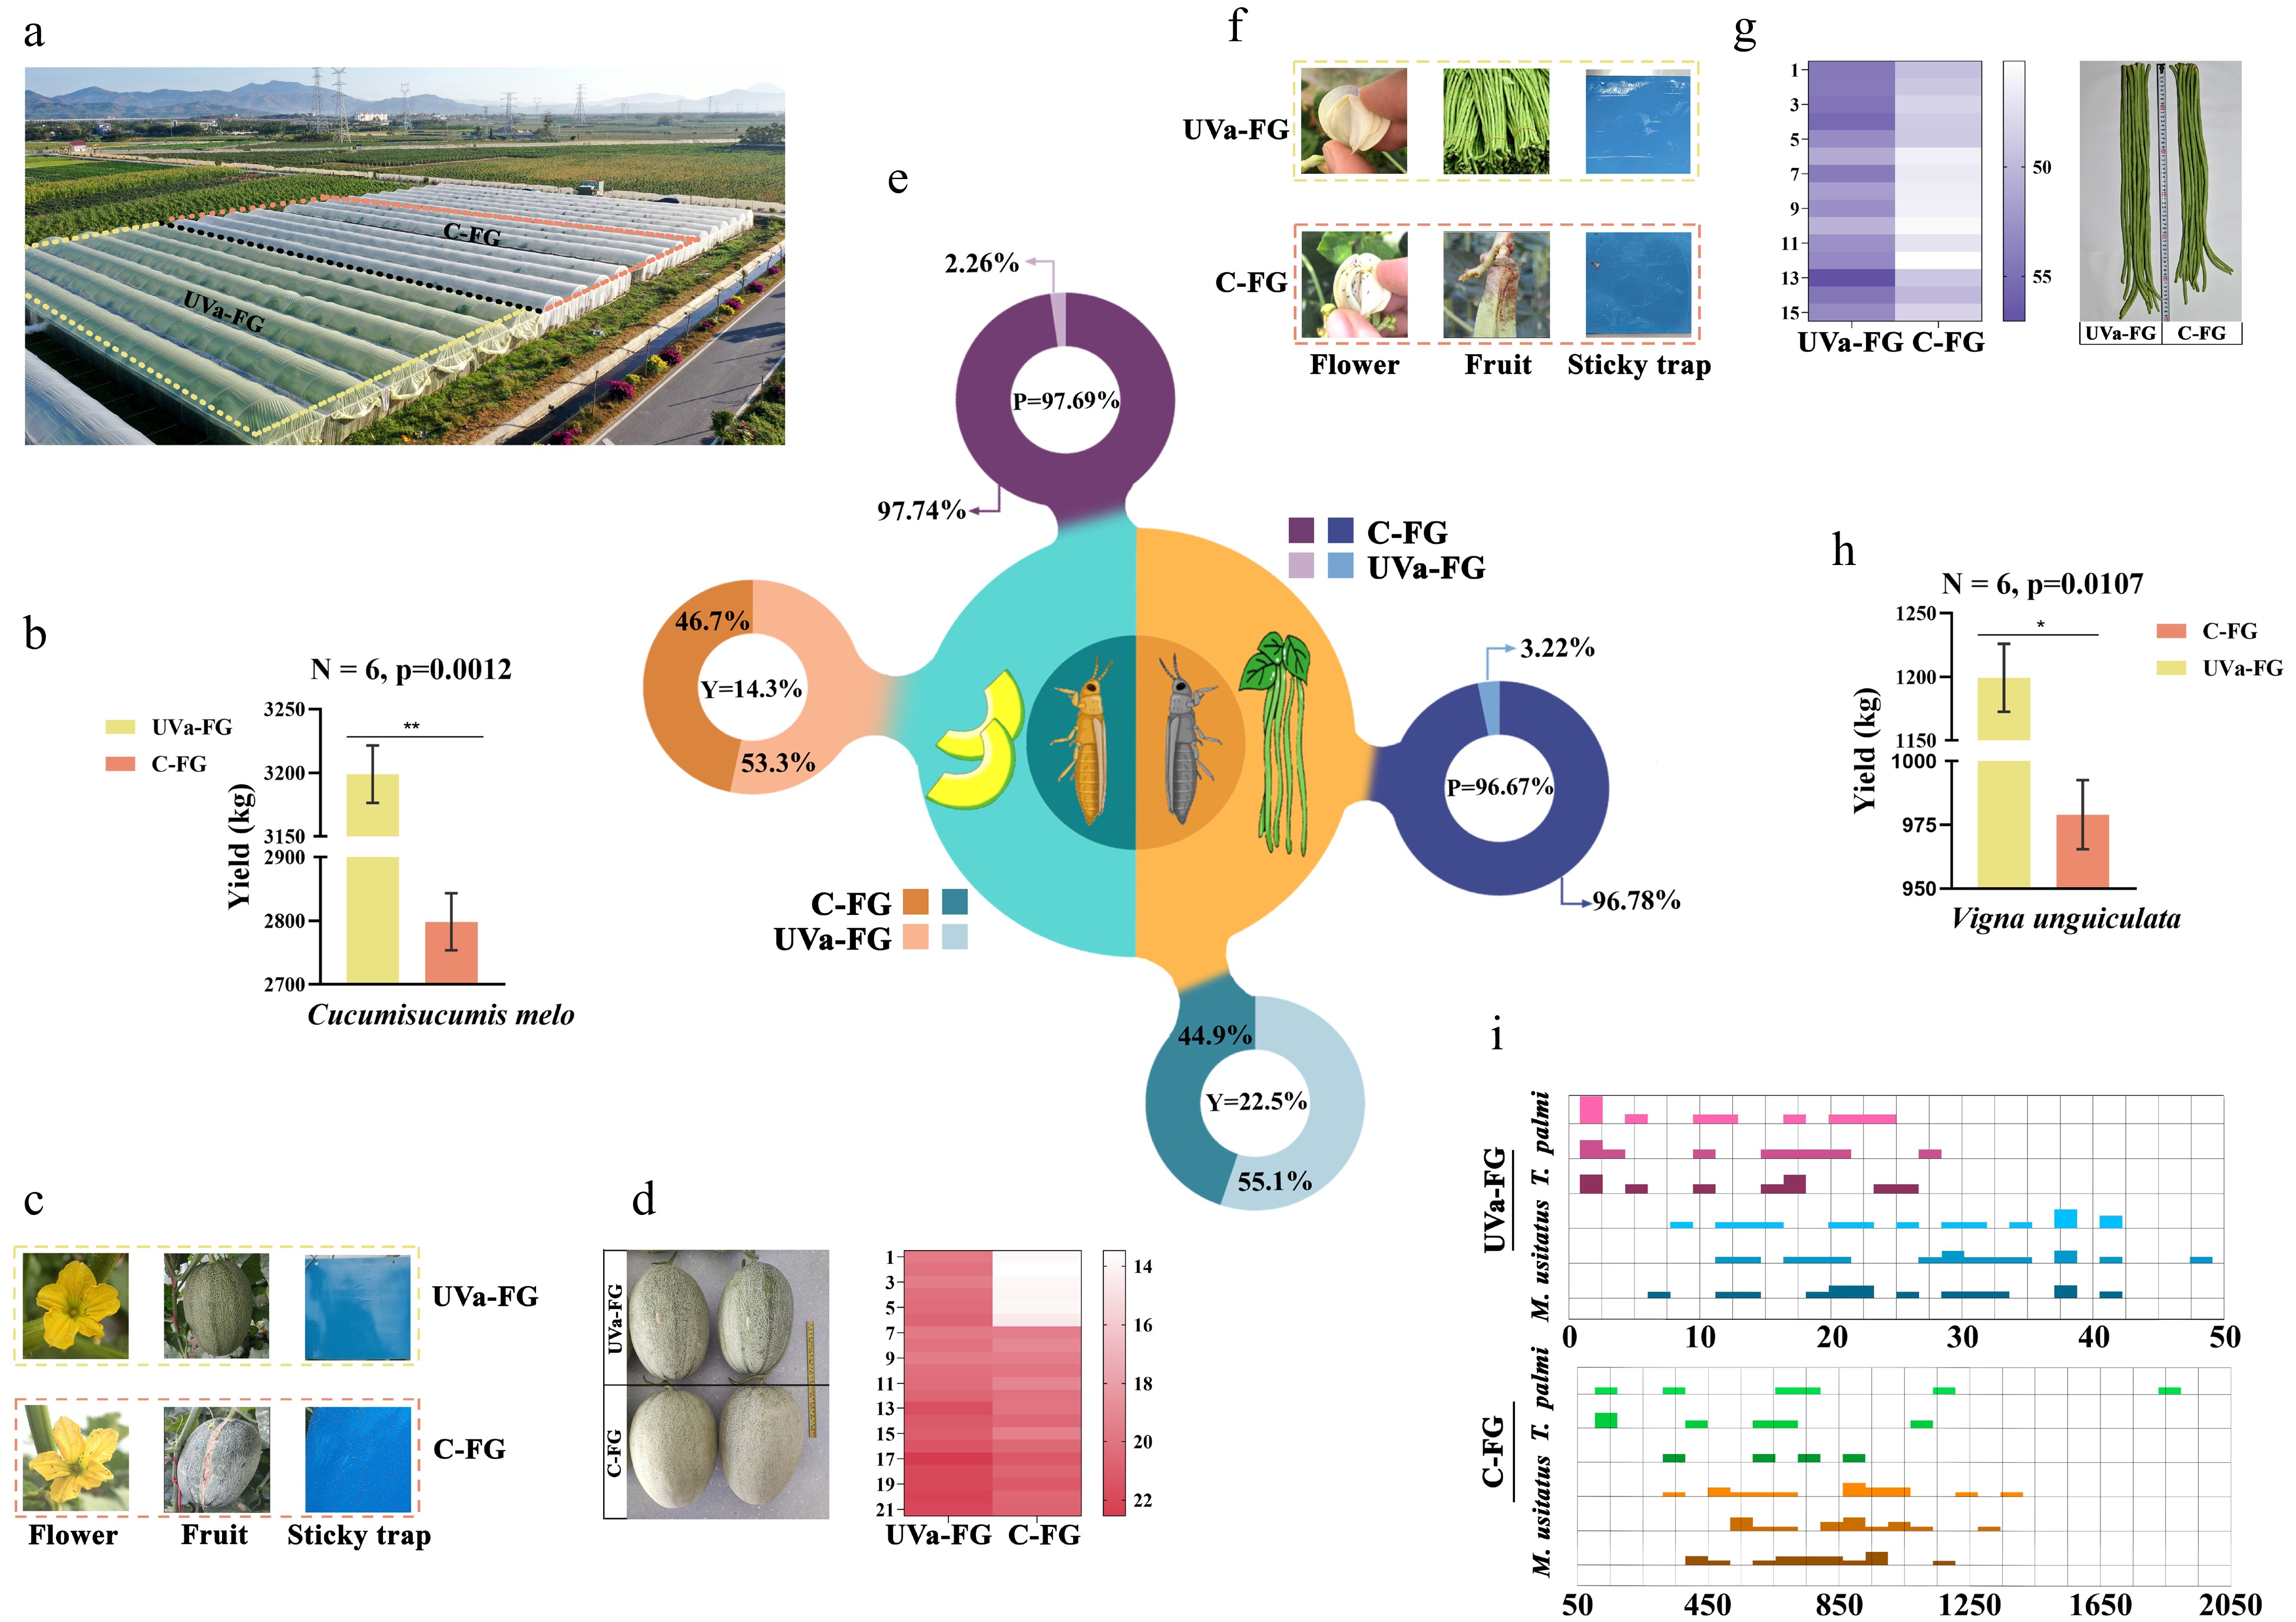
Figure 2.
Effect of UV-absorbing film greenhouse on thrips control, crop quality and yield of cowpea and Hami melon. (a) Greenhouses covered with two different light-transmitting films, conventional film greenhouses (C-FG) and UV-absorbing film greenhouses (UVa-FG), respectively. (b) Yield of Hami melon in two greenhouses (UVa-FG and C-FG). (c) Comparison of number of T. palmi on flowers and sticky trap and damage to Hami melon fruits of UVa-FG and C-FG. (d) Effect on the size of Hami melon. Left panel shows the size of the Hami melon in UVa-FG and C-FG. Right panel shows a heat map of the geometric mean of the longitudinal diameter, transverse diameter and perimeter of the Hami melon. (e) Prevention and control rate (P) and yield increase rate (Y) in UVa-FG and C-FG. (f) Comparison of the numbers of M. usitatus on flowers and sticky traps and damage to cowpea fruits of UVa-FG and C-FG. (g) Effect on the size of cowpeas. Left panel shows the size of the cowpea in UVa-FG and C-FG. Right panel shows a heat map of the geometric mean of the weight and length of the cowpea. (h) Yield of cowpea in UVa-FG and C-FG. (i) The histogram showed the occurrence of two species of thrips in UVa-FG and C-FG. The height of the column shows the density of the distribution under this number. The width of the column is shown in the number distribution range (triple repetition).
-
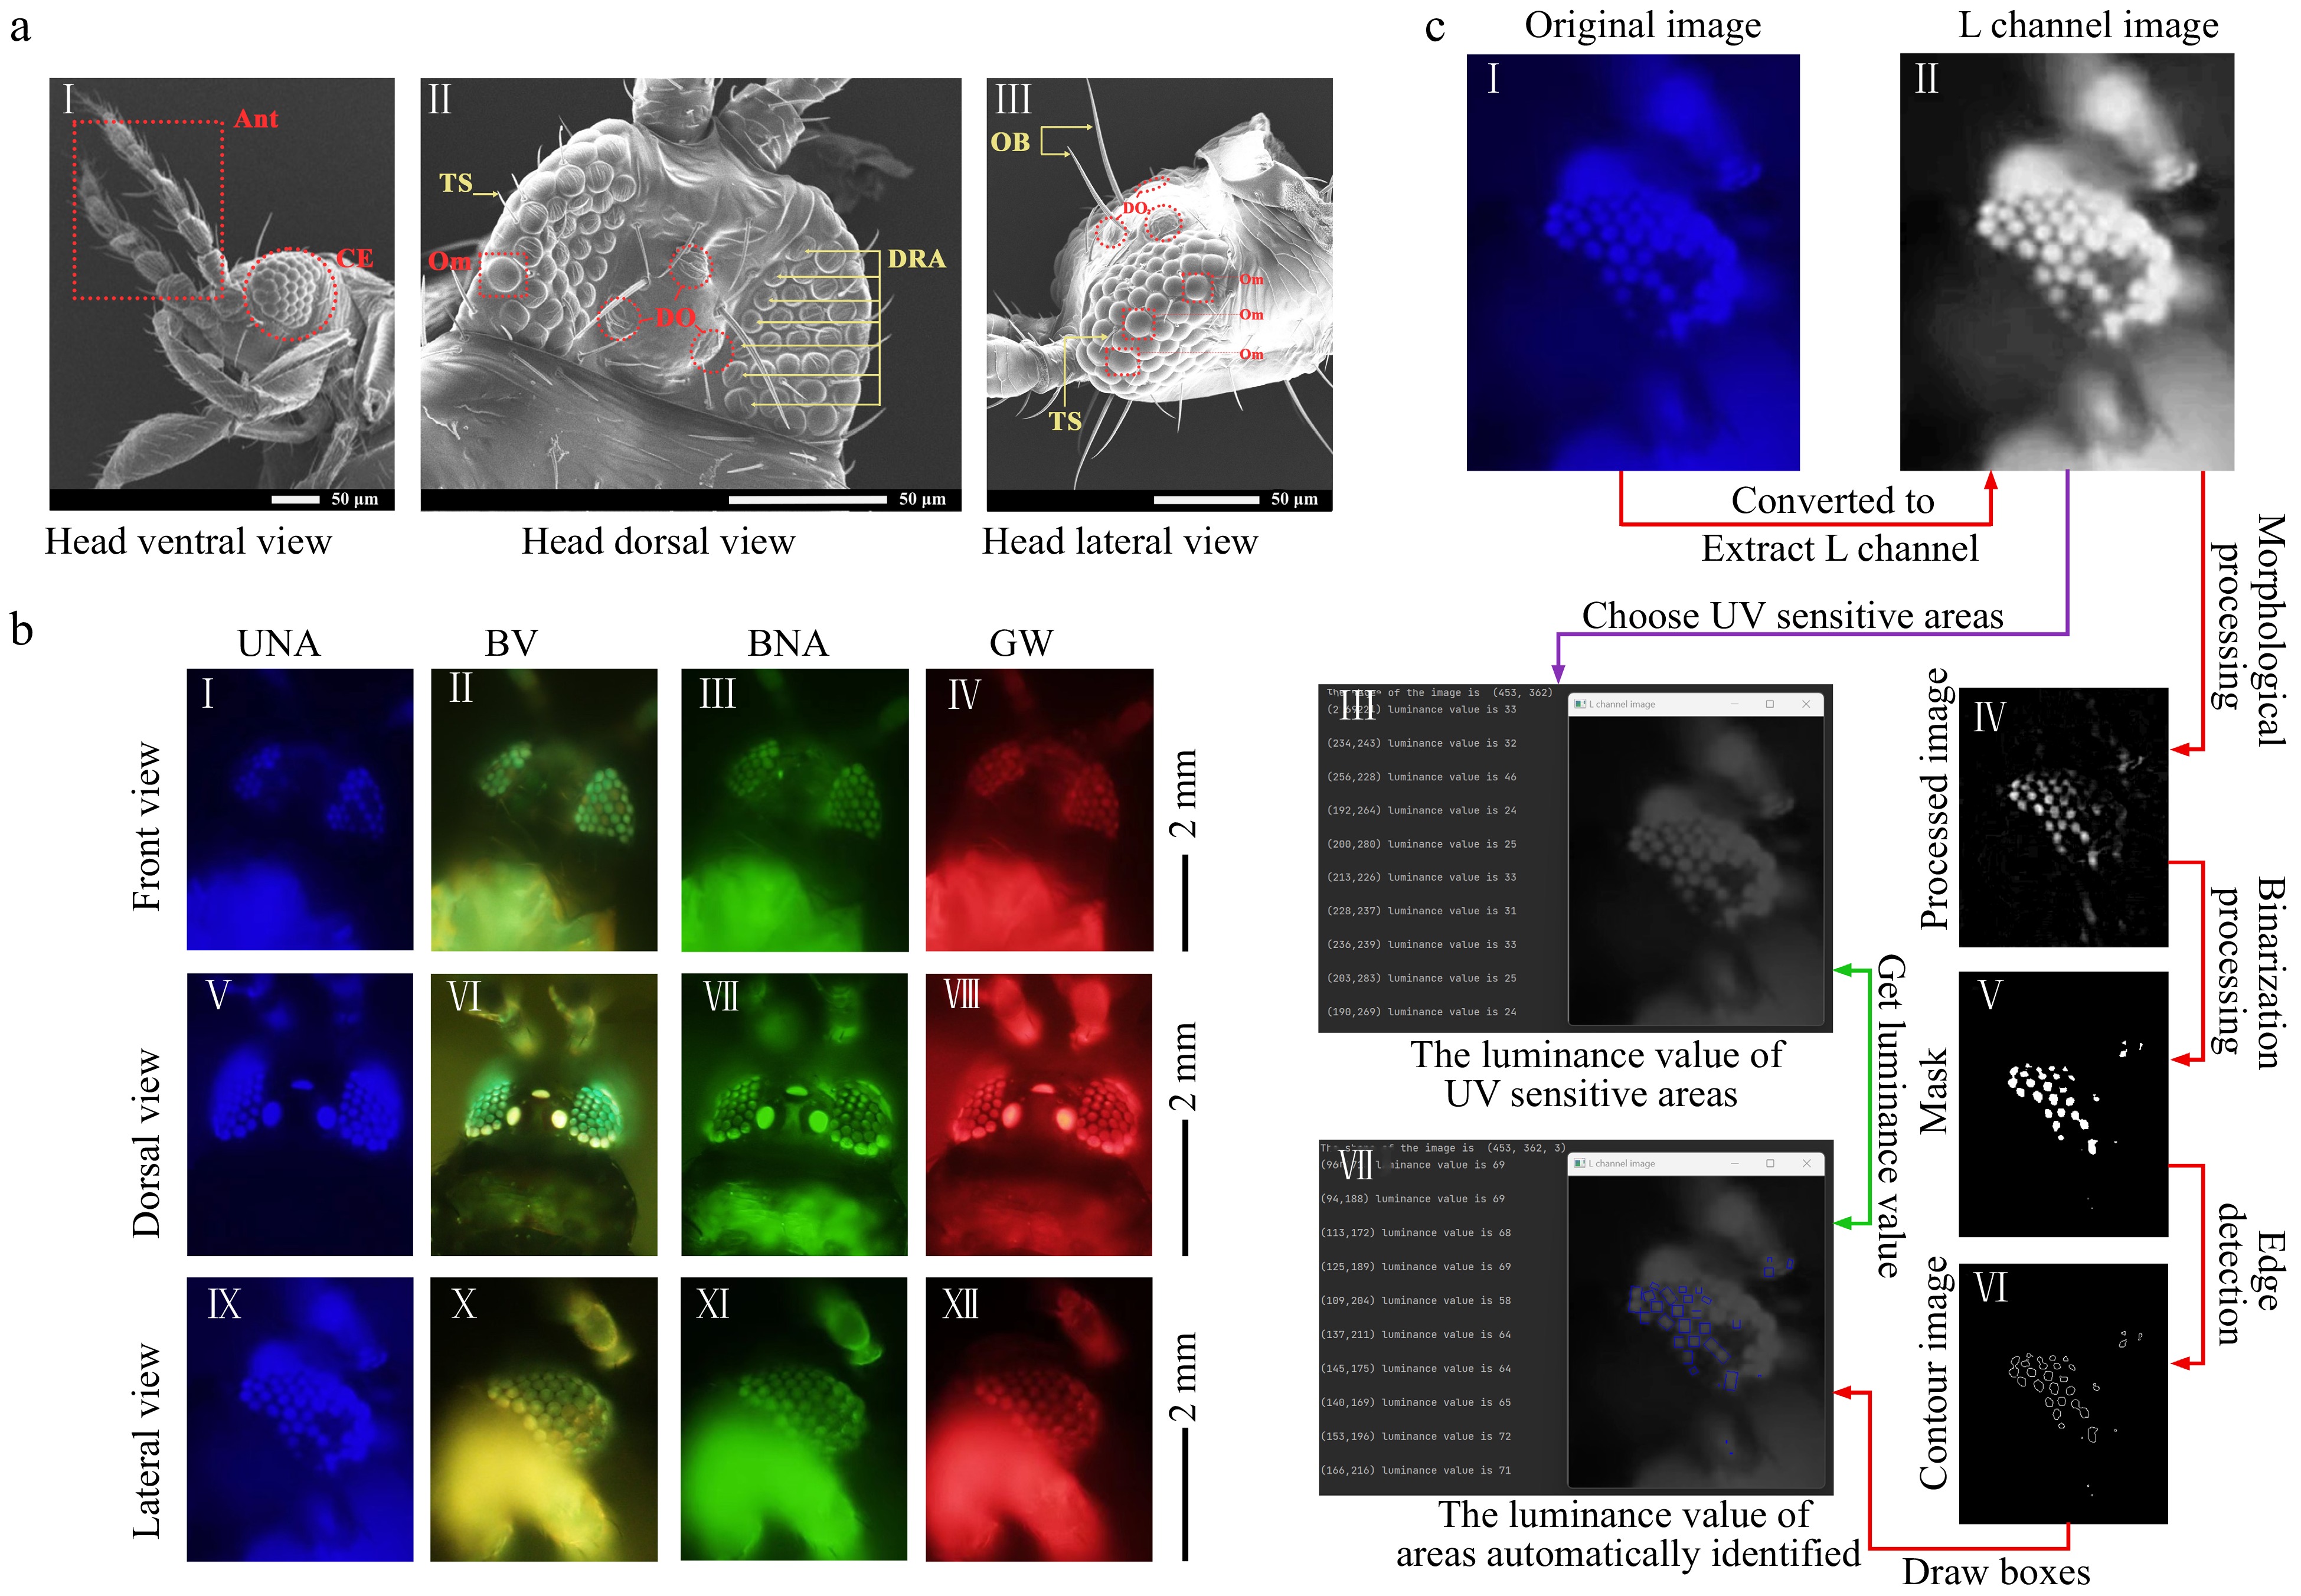
Figure 3.
External morphology, ultrastructure and the response of compound eyes of Megalurothrips usitatus under different wavelengths. (a) Microscopic observation of visual receptors of Megalurothrips usitatus. (aI) Ventral view of head; Ant: Antenna; CE: Compound eye. (aII) Dorsal view of head; TS: Trichoid sensillum; Om: Ommatidium; DO: Dorsal ocellus; DRA: Dorsal rim area. (aIII) Lateral view of head; OB: ocellar bristles; DO: Dorsal ocellus; Om: Ommatidium; TS: Trichoid sensillum. (b) Fluorescent area of Megalurothrips usitatus compound eyes irradiated by UNA (360−370 nm), BVW (400−440 nm), BNA (470−495 nm) and GW (530−550 nm) in the front, dorsal and lateral view. The triangles (▲) mark the position of the UV-sensitive ommatidium. (c) The images of computer vision aided analysis by OpenCV. (cI) The original image which shows the fluorescent area of Megalurothrips usitatus compound eyes irradiated by UNA in the lateral view. (cII) A grayscale image of the original luminance channel. (cIII) The image with clear fluorescent responsive areas morphologically processed of the L channel image. (cIV) The binary image binarized from Fig. 3c-III. (cV) The contours of the mask (cVI) Left panel shows the luminance values for ten points located in the UV-sensitive ommatidium areas and the position coordinates of the corresponding points, and right panel is the corresponding image. (cVII) Left panel shows the luminance values for ten points located in the clear fluorescent responsive areas chosen by OpenCV with box and the position coordinates of the corresponding points, and right panel is the corresponding image with blue boxes.
-
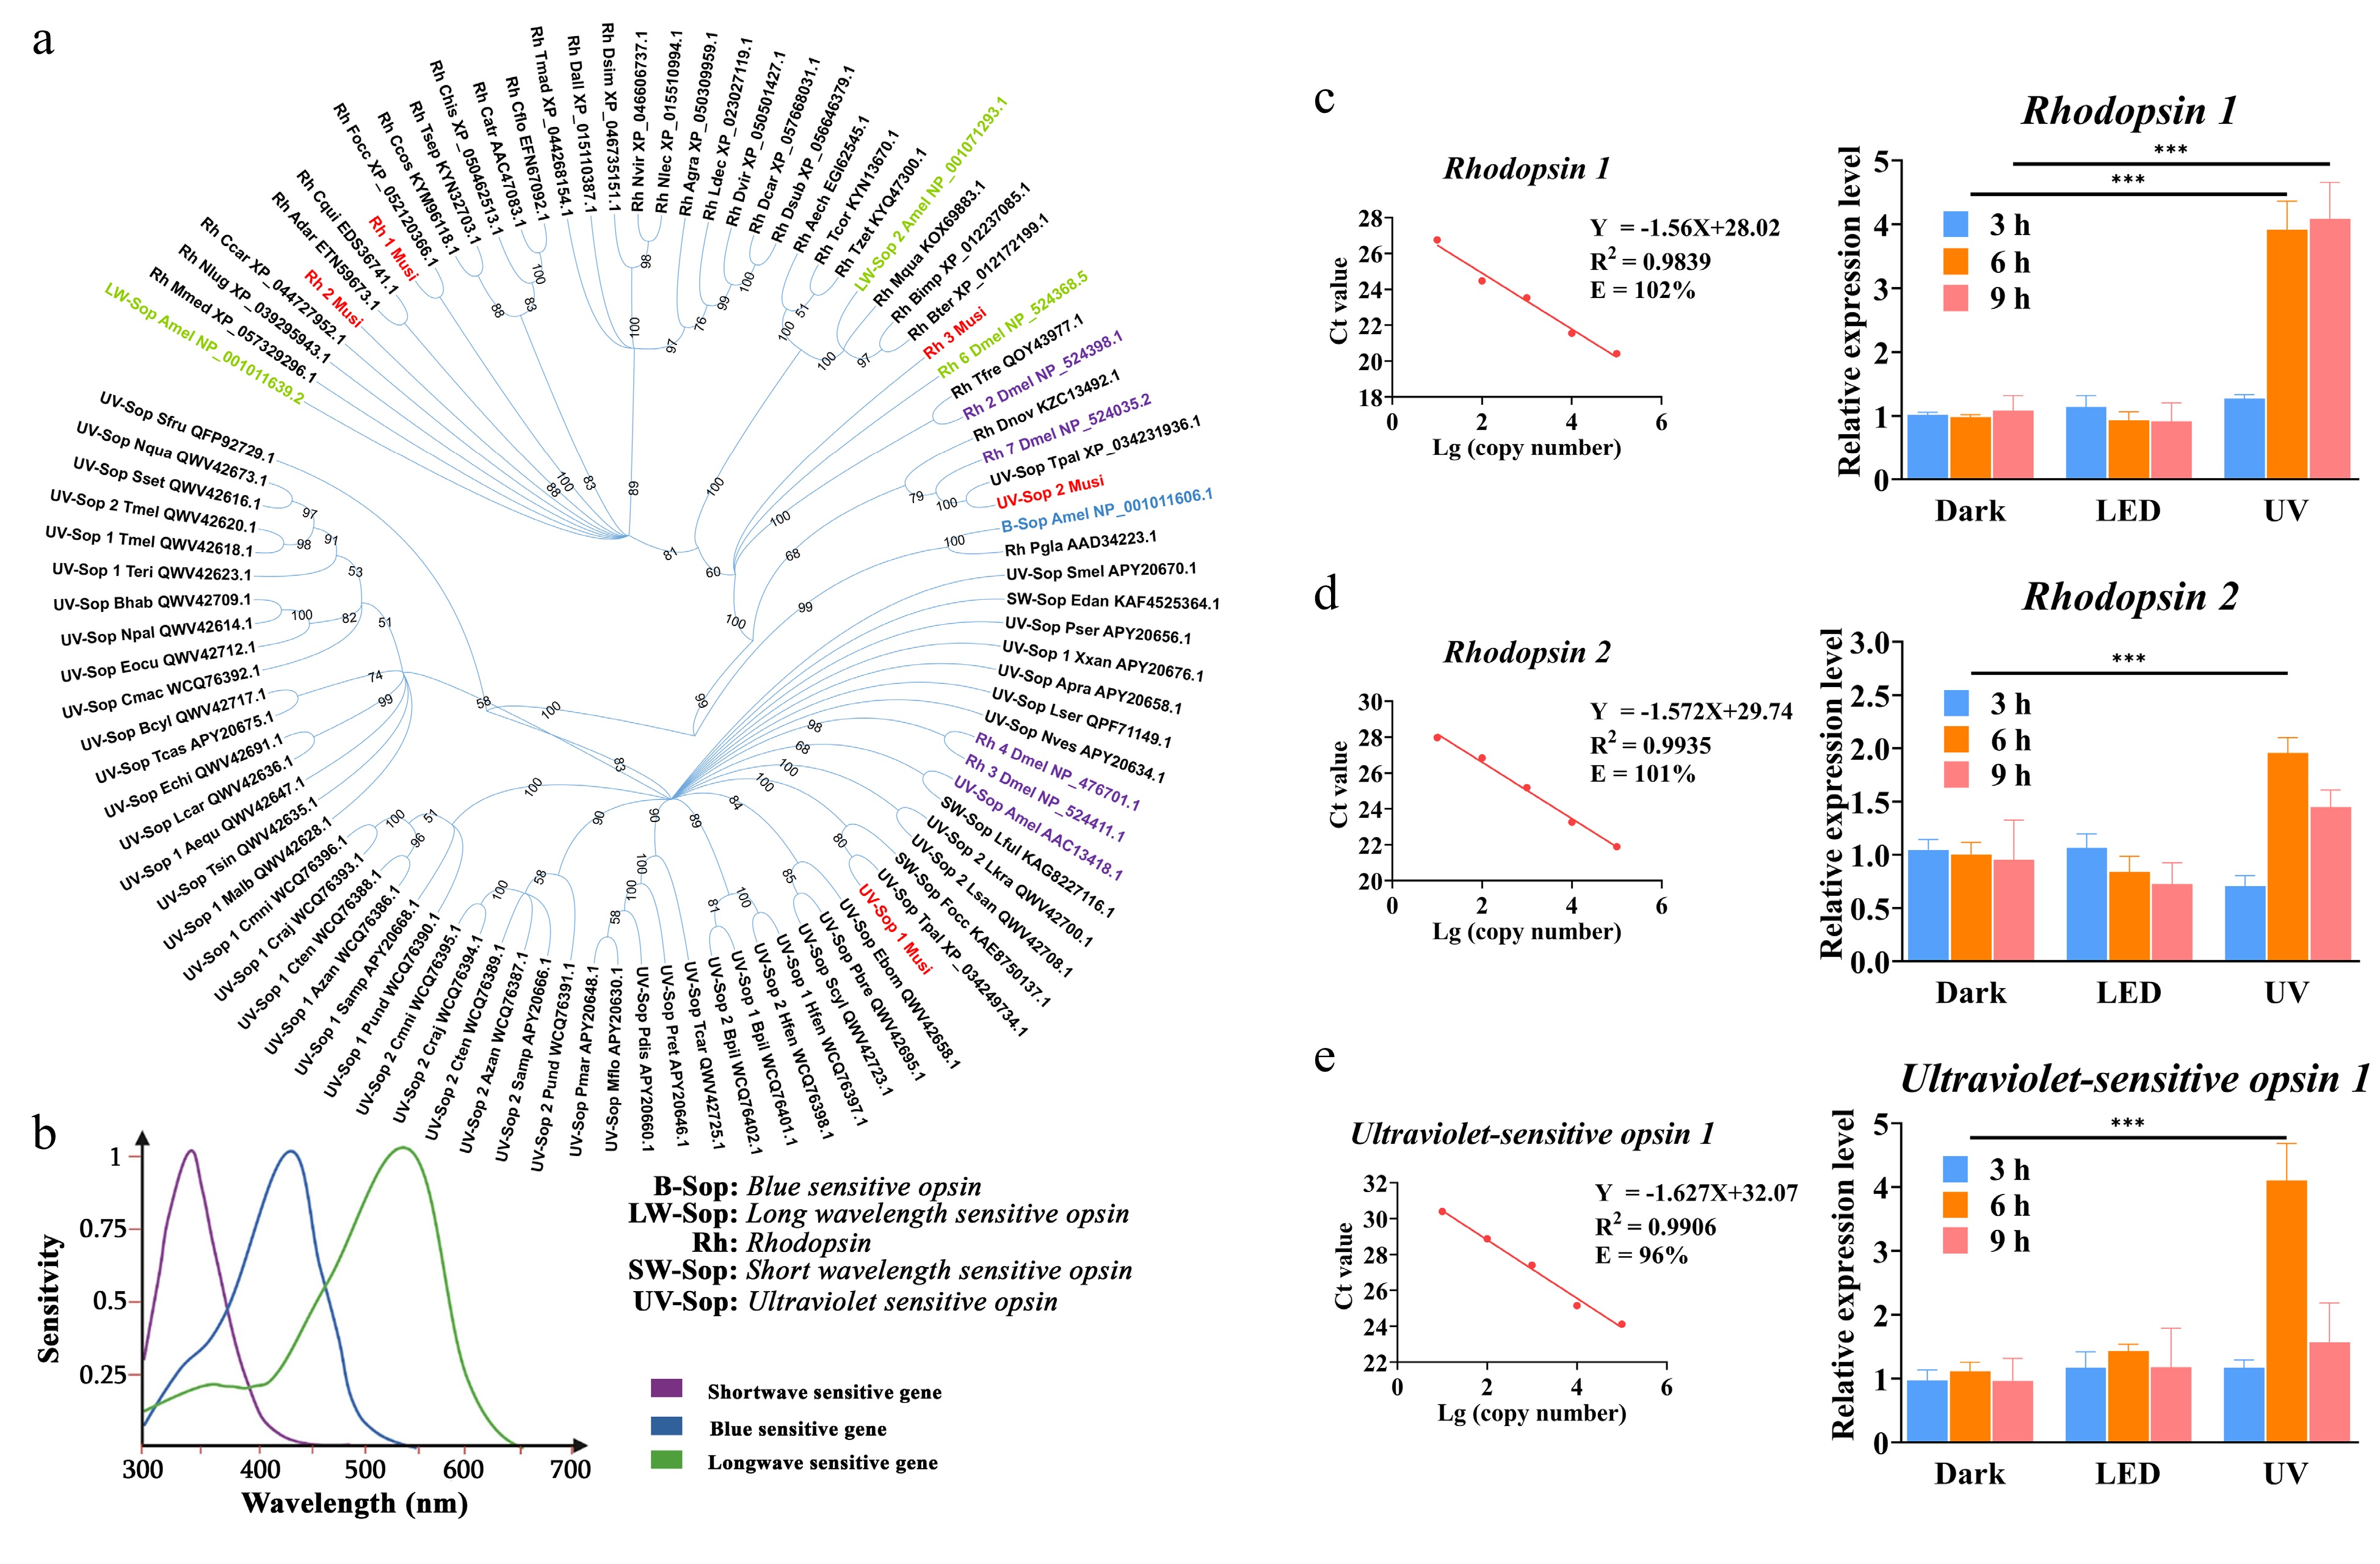
Figure 4.
Homology and expression analysis of opsin genes of Megalurothrips usitatus and their sensitivity to light range. (a) Homology analysis of five vision-related proteins of Megalurothrips usitatus to other vision-related proteins of photosensitive insects which have been reported. Purple font: short wavelength (< 400 nm), blue font: blue wavelength (400−500 nm), green font: long wavelength (500−550 nm). Note: Full names of all species are listed in Supplemental Table S5. (b) Wavelength sensitive peak of thrips, modified from Makabe et al.[29]. (c), (d) and (e) Expression levels of vision related genes in thrips. RT-qPCR analysis of three vision genes after 3, 6, and 9 h without UV and UV stress. *** p < 0.0001. The line chart shows the range of parameters of a standard curve.
Figures
(4)
Tables
(0)