-
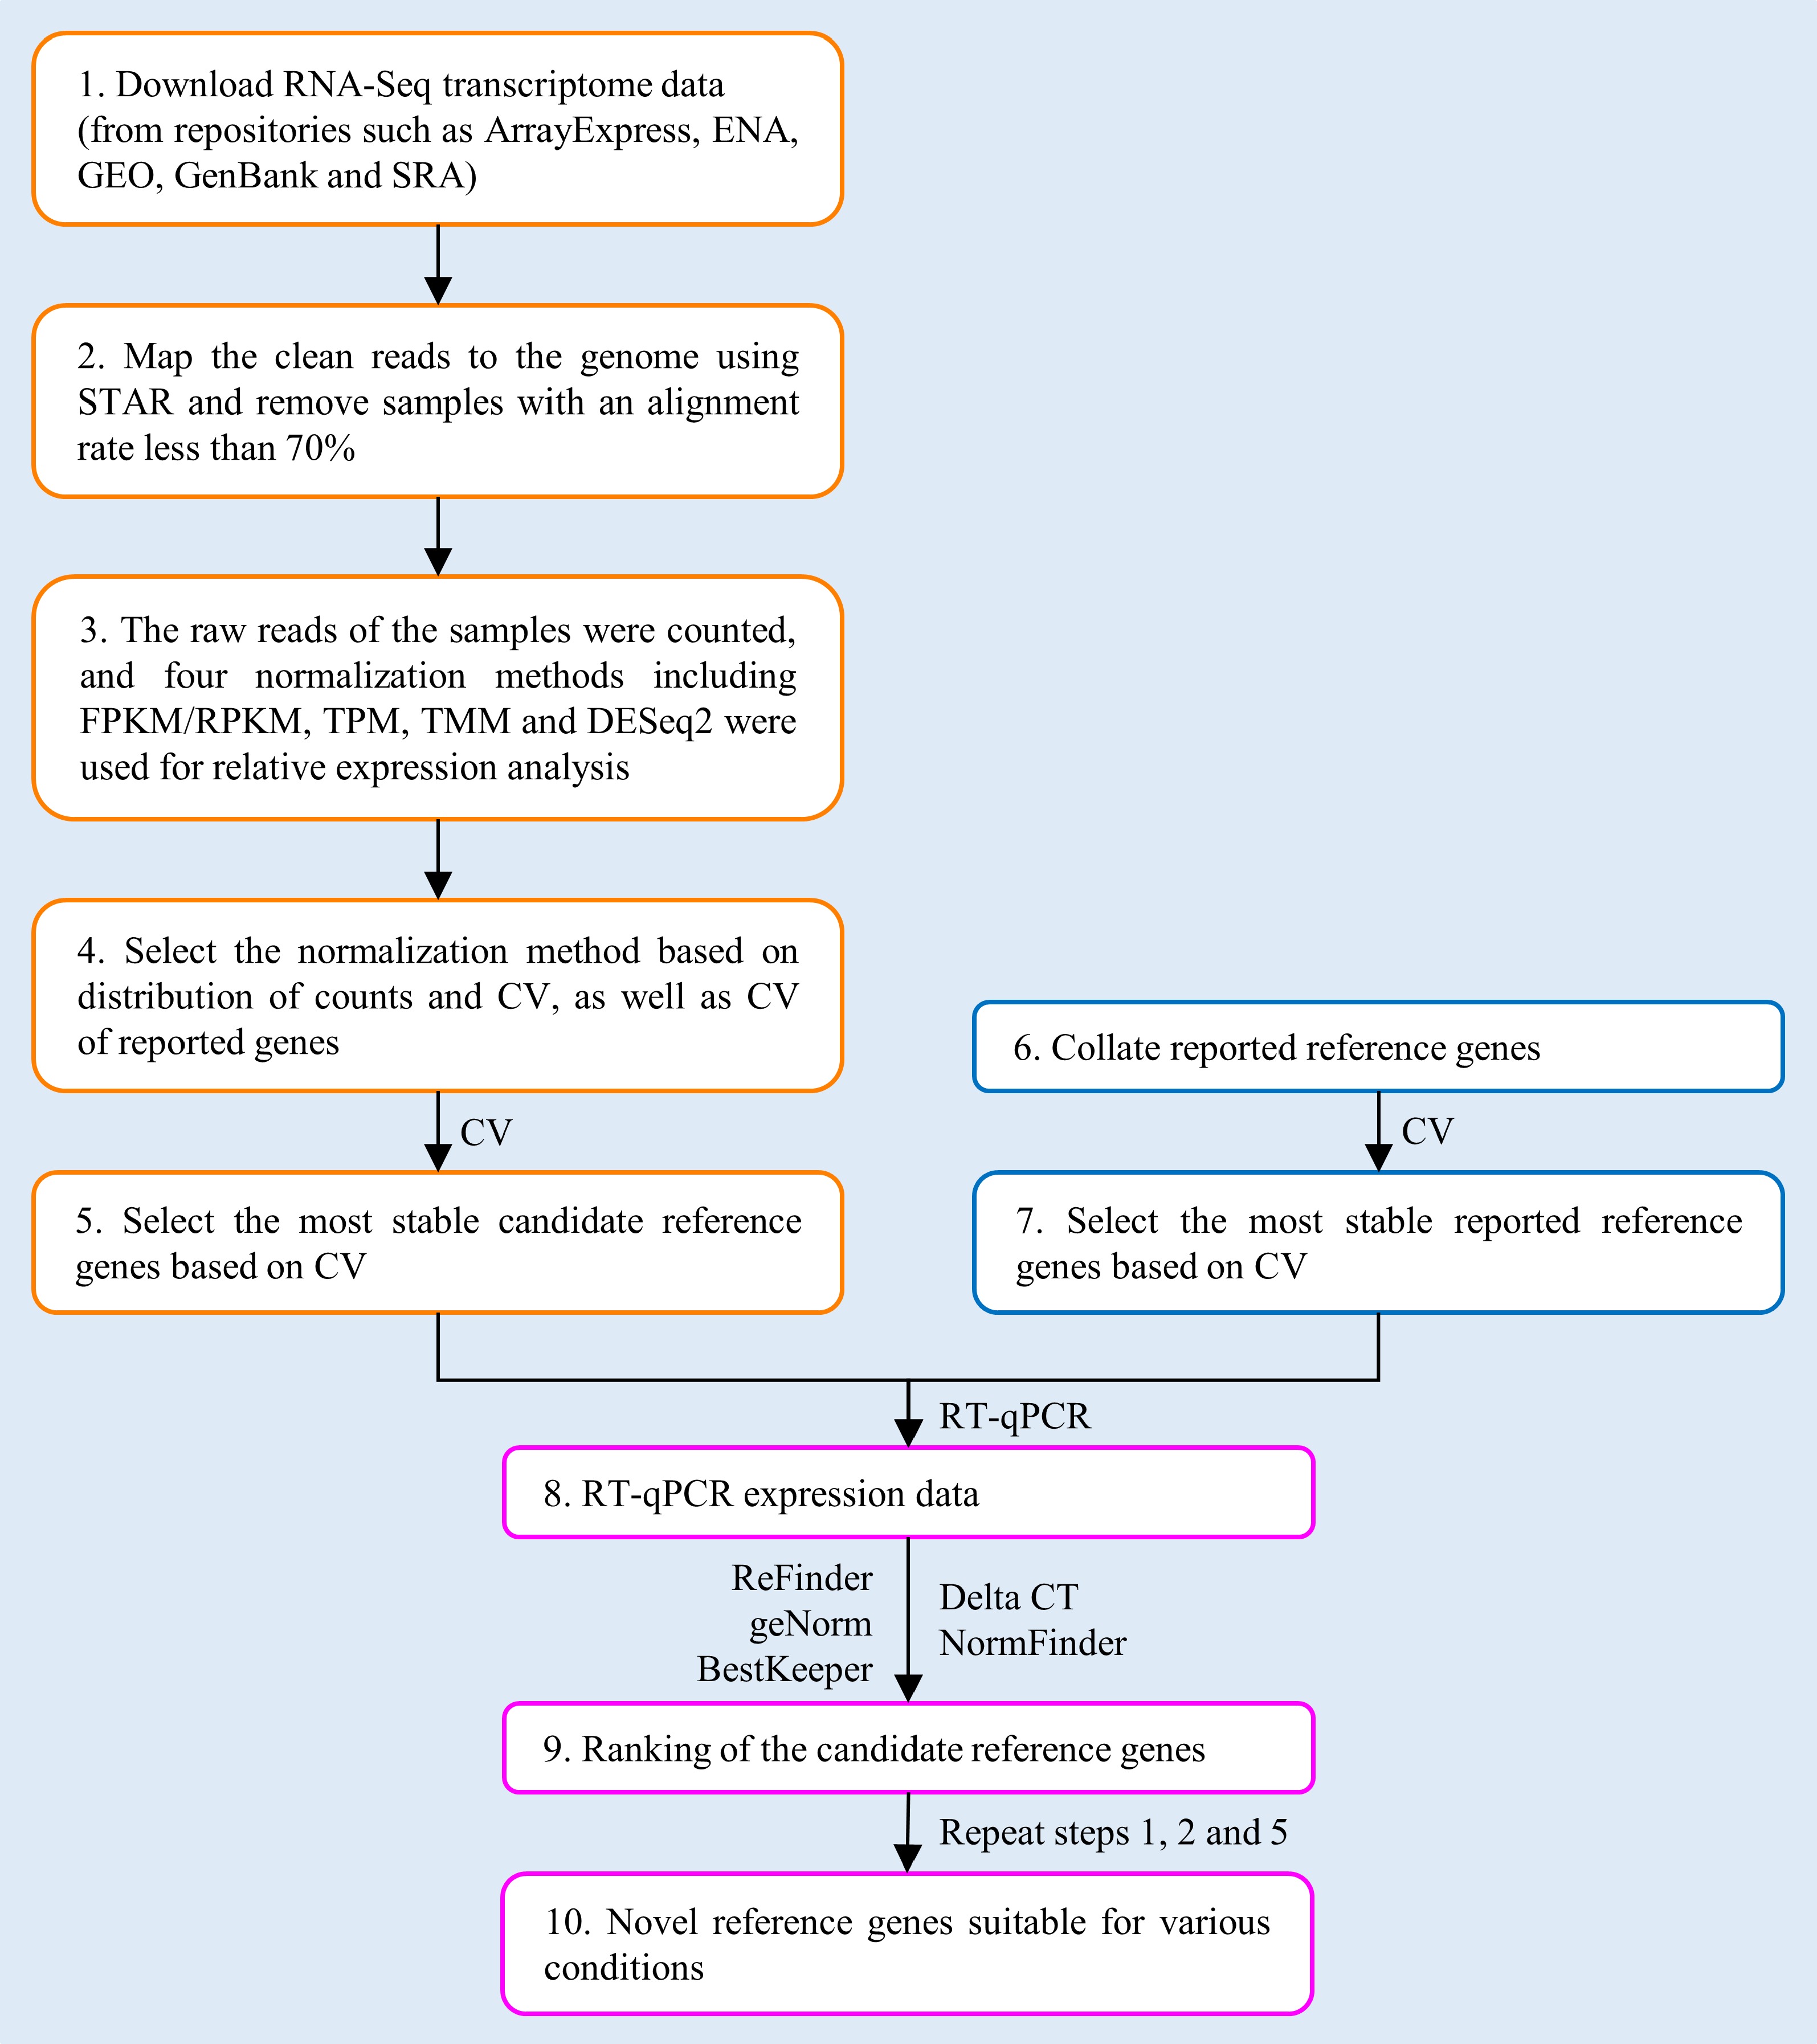
Figure 1.
Workflow for selecting novel reference genes (RGs) based on RNA-Seq data.
-
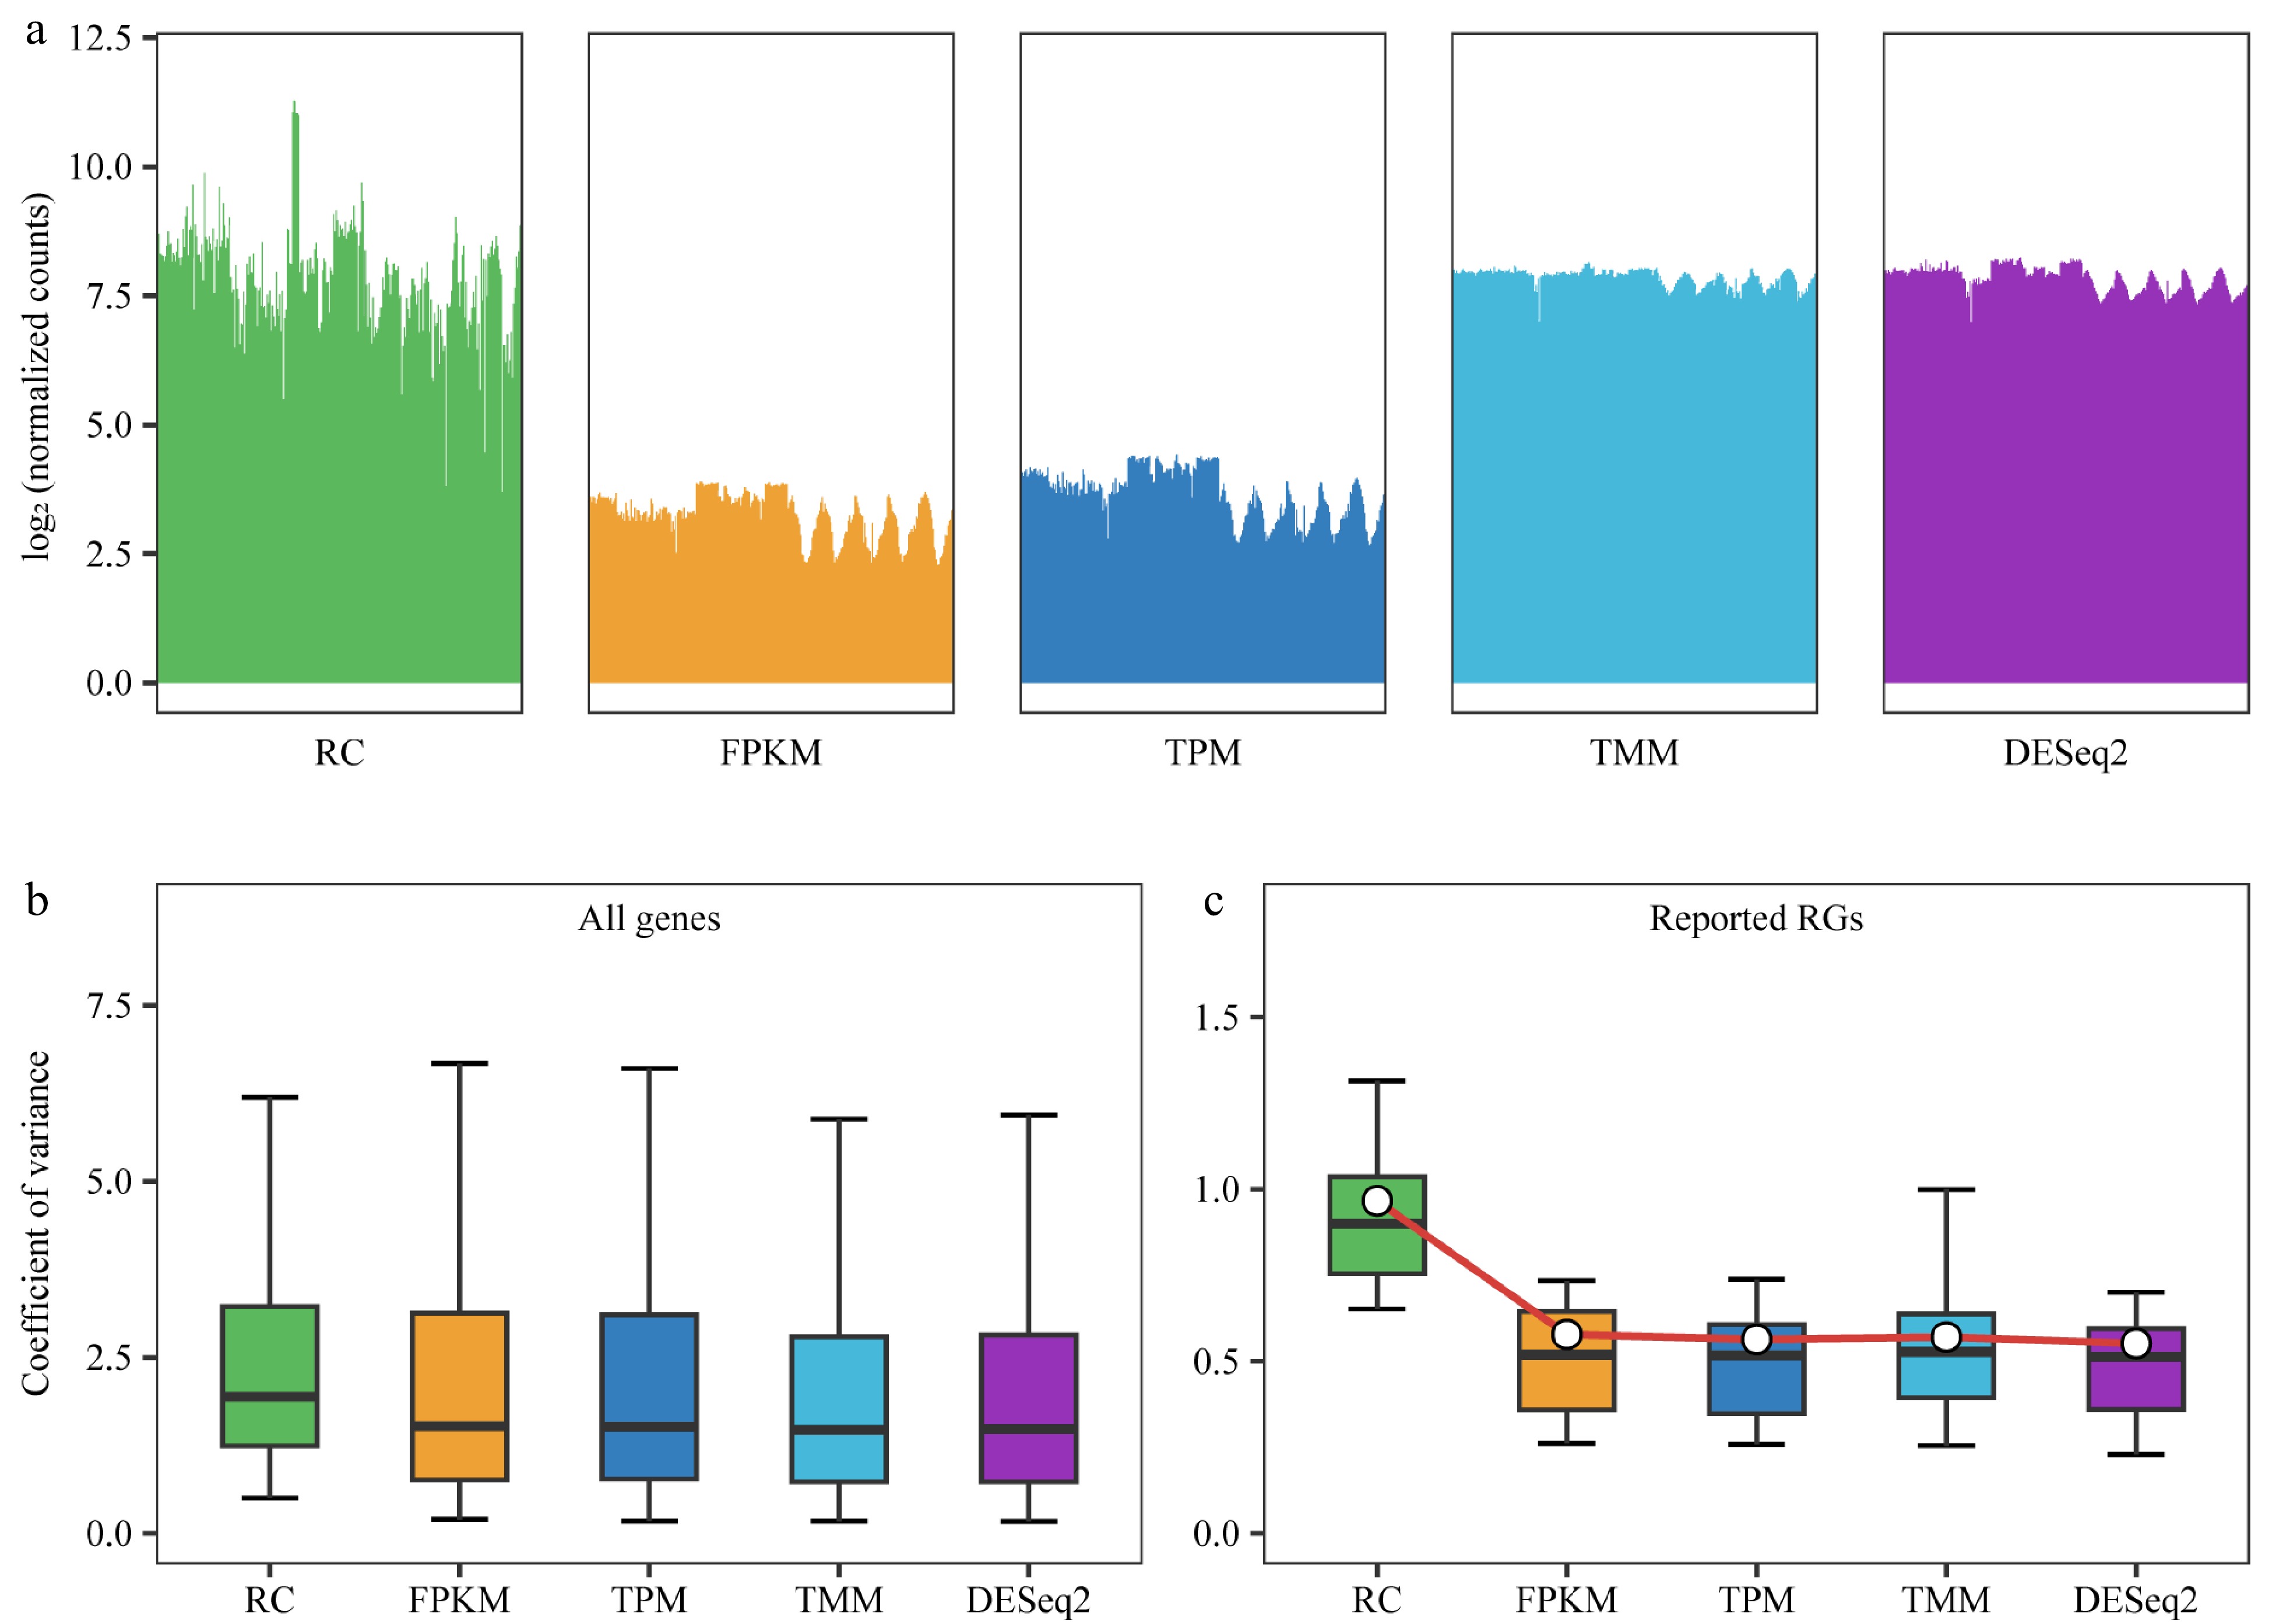
Figure 2.
Comparison of normalization methods. RC (raw counts) represents raw counts without normalization, while FPKM, TPM, TMM, and DESeq2 are results after normalization using four different methods. (a) Distribution of counts for all genes in each sample before and after normalization using 292 samples. Bar plots are employed instead of box plots, with the upper limit of the bar representing the upper quartile and the lower limit representing the lower quartile of the data. (b) Box plot demonstrates the coefficient of variance (CV) of gene expression levels for all genes before and after normalization, utilizing data from 292 samples. (c) Box plot depicting the CV for 30 previously reported reference genes (RGs) after different normalizations across all 292 samples, with the central white point indicating the mean CV.
-
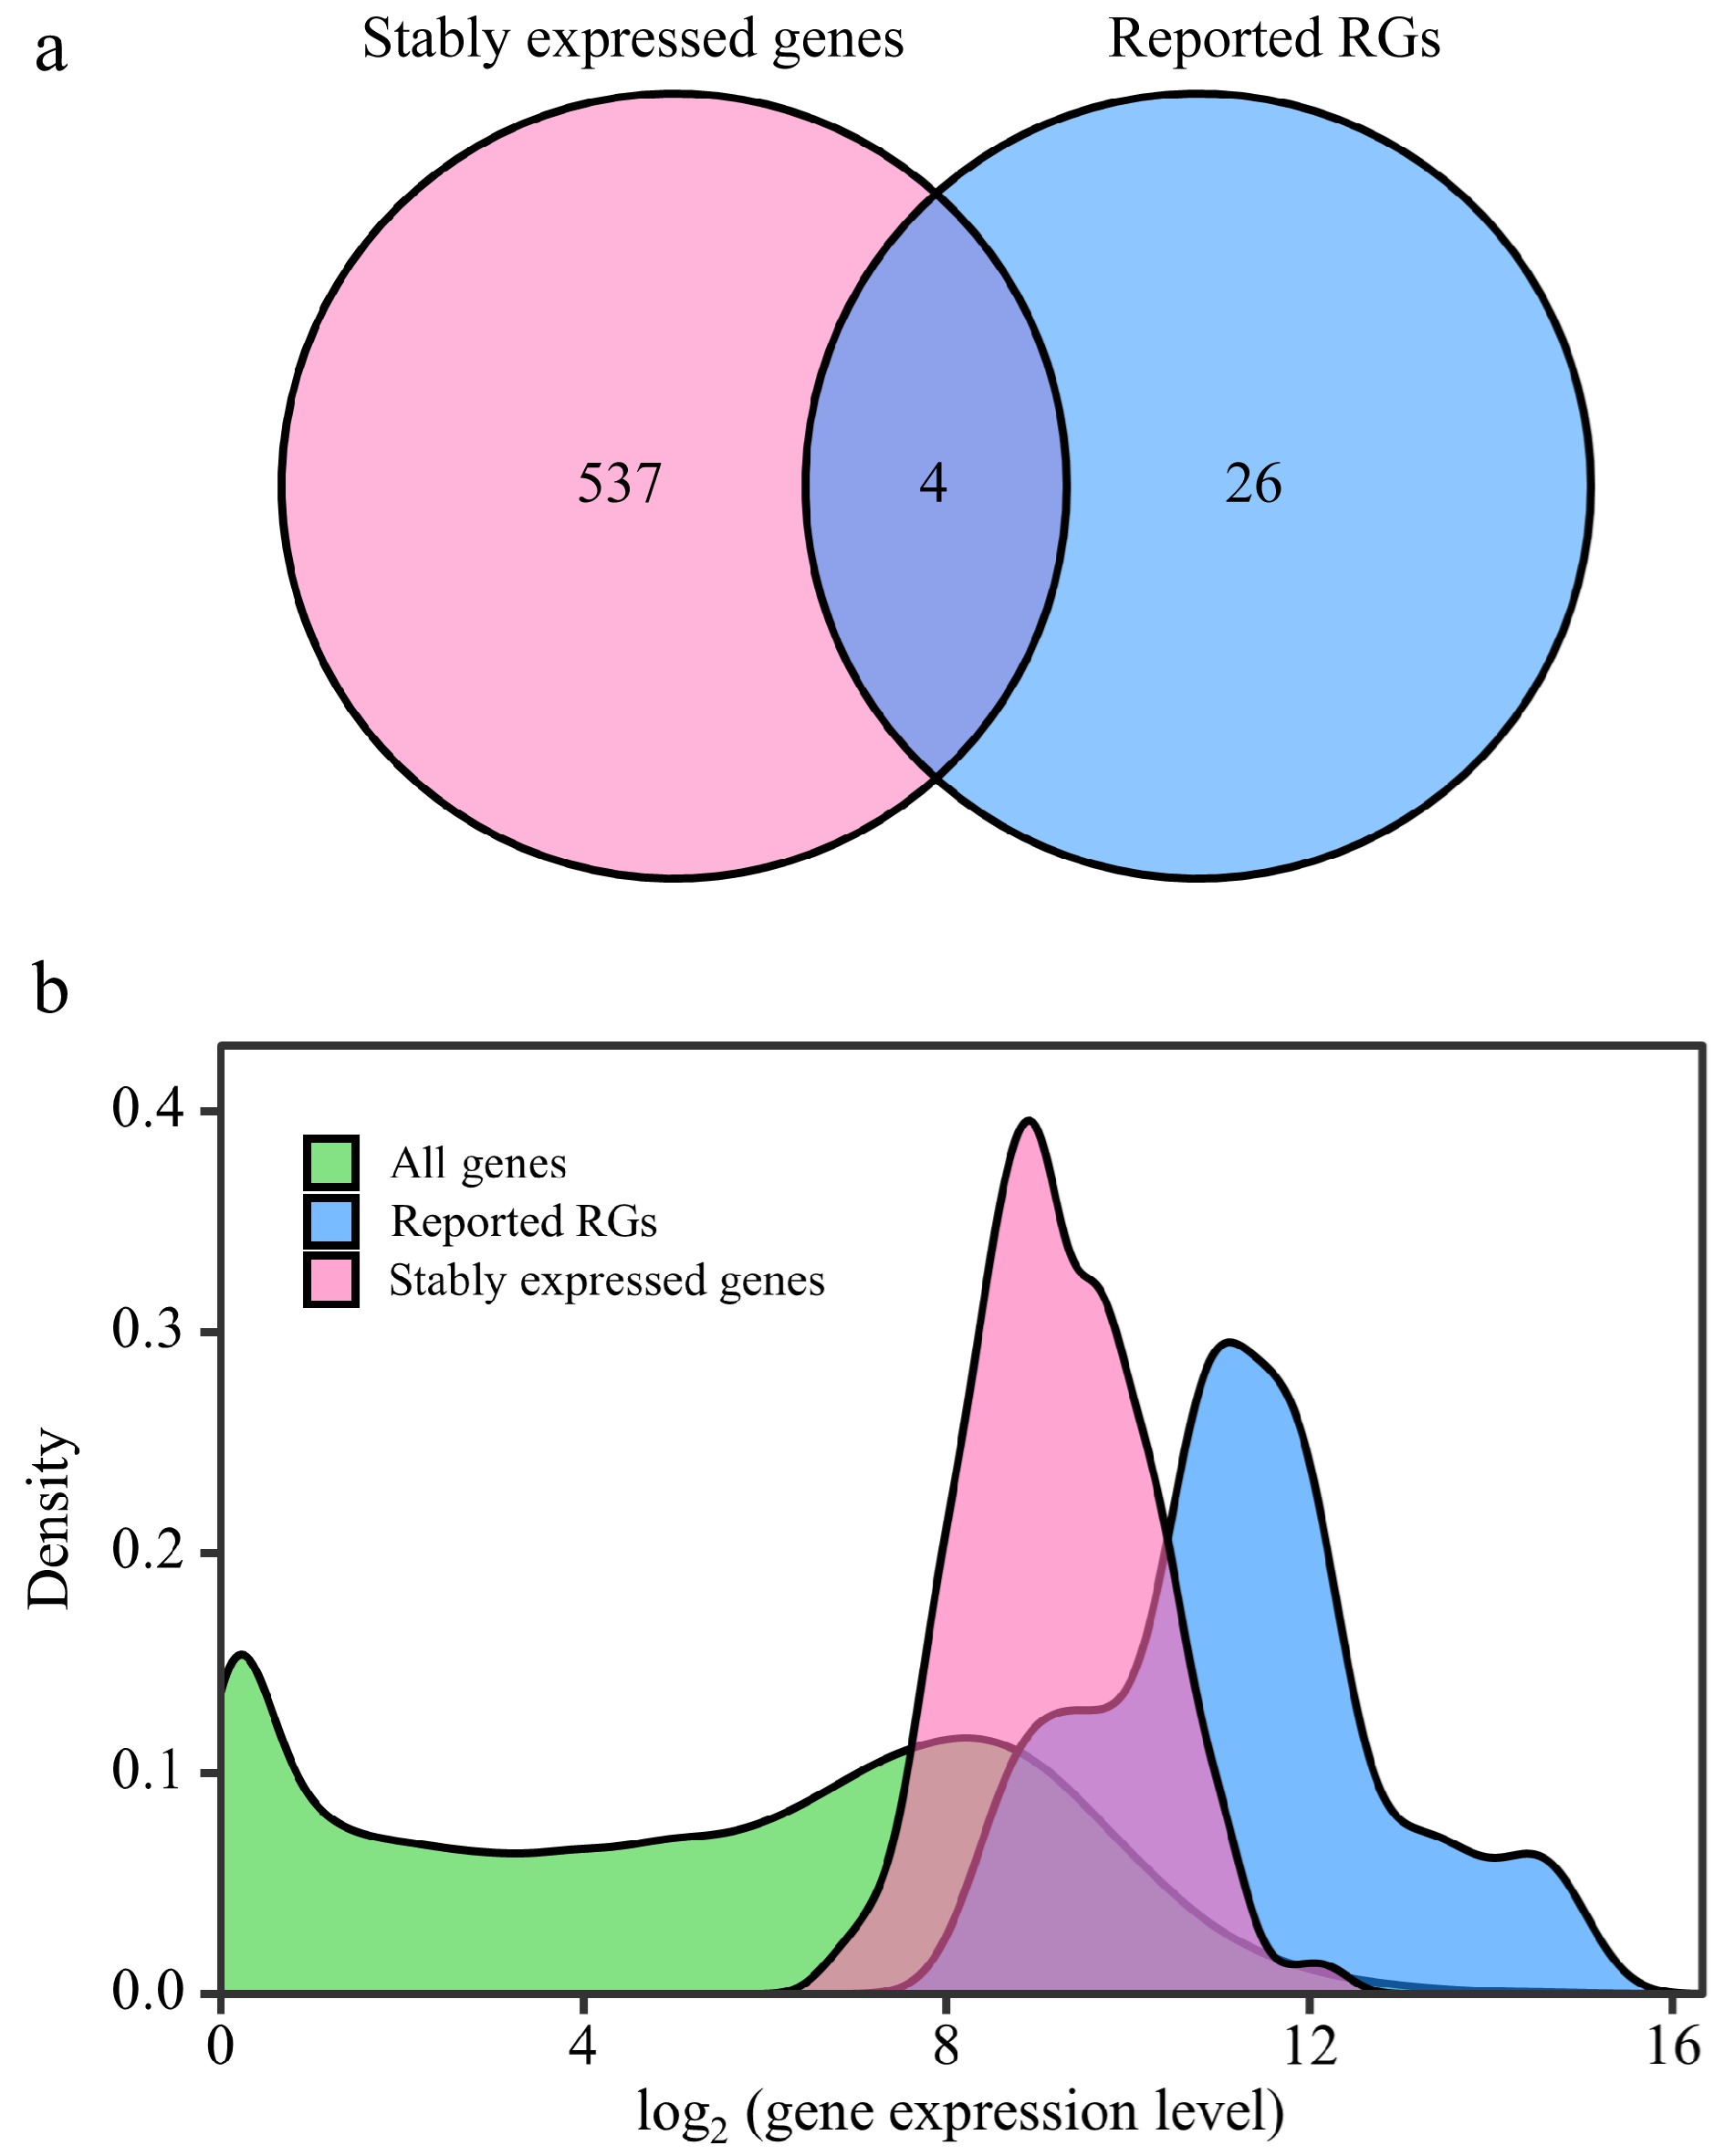
Figure 3.
Comparative analysis between stably expressed genes and reported reference genes (RGs). This figure presents a comparison of expression patterns between stably expressed genes and previously reported RGs. (a) Venn diagram illustrates the overlap between stably expressed genes (with CV ≤ 0.3) identified from 292 RNA-Seq samples and the reported RGs. (b) The density distribution of gene expression levels is depicted for all genes in the Populus genome, stably expressed genes, and reported RGs. The X-axis represents log2(counts + 1), and the Y-axis represents gene density.
-
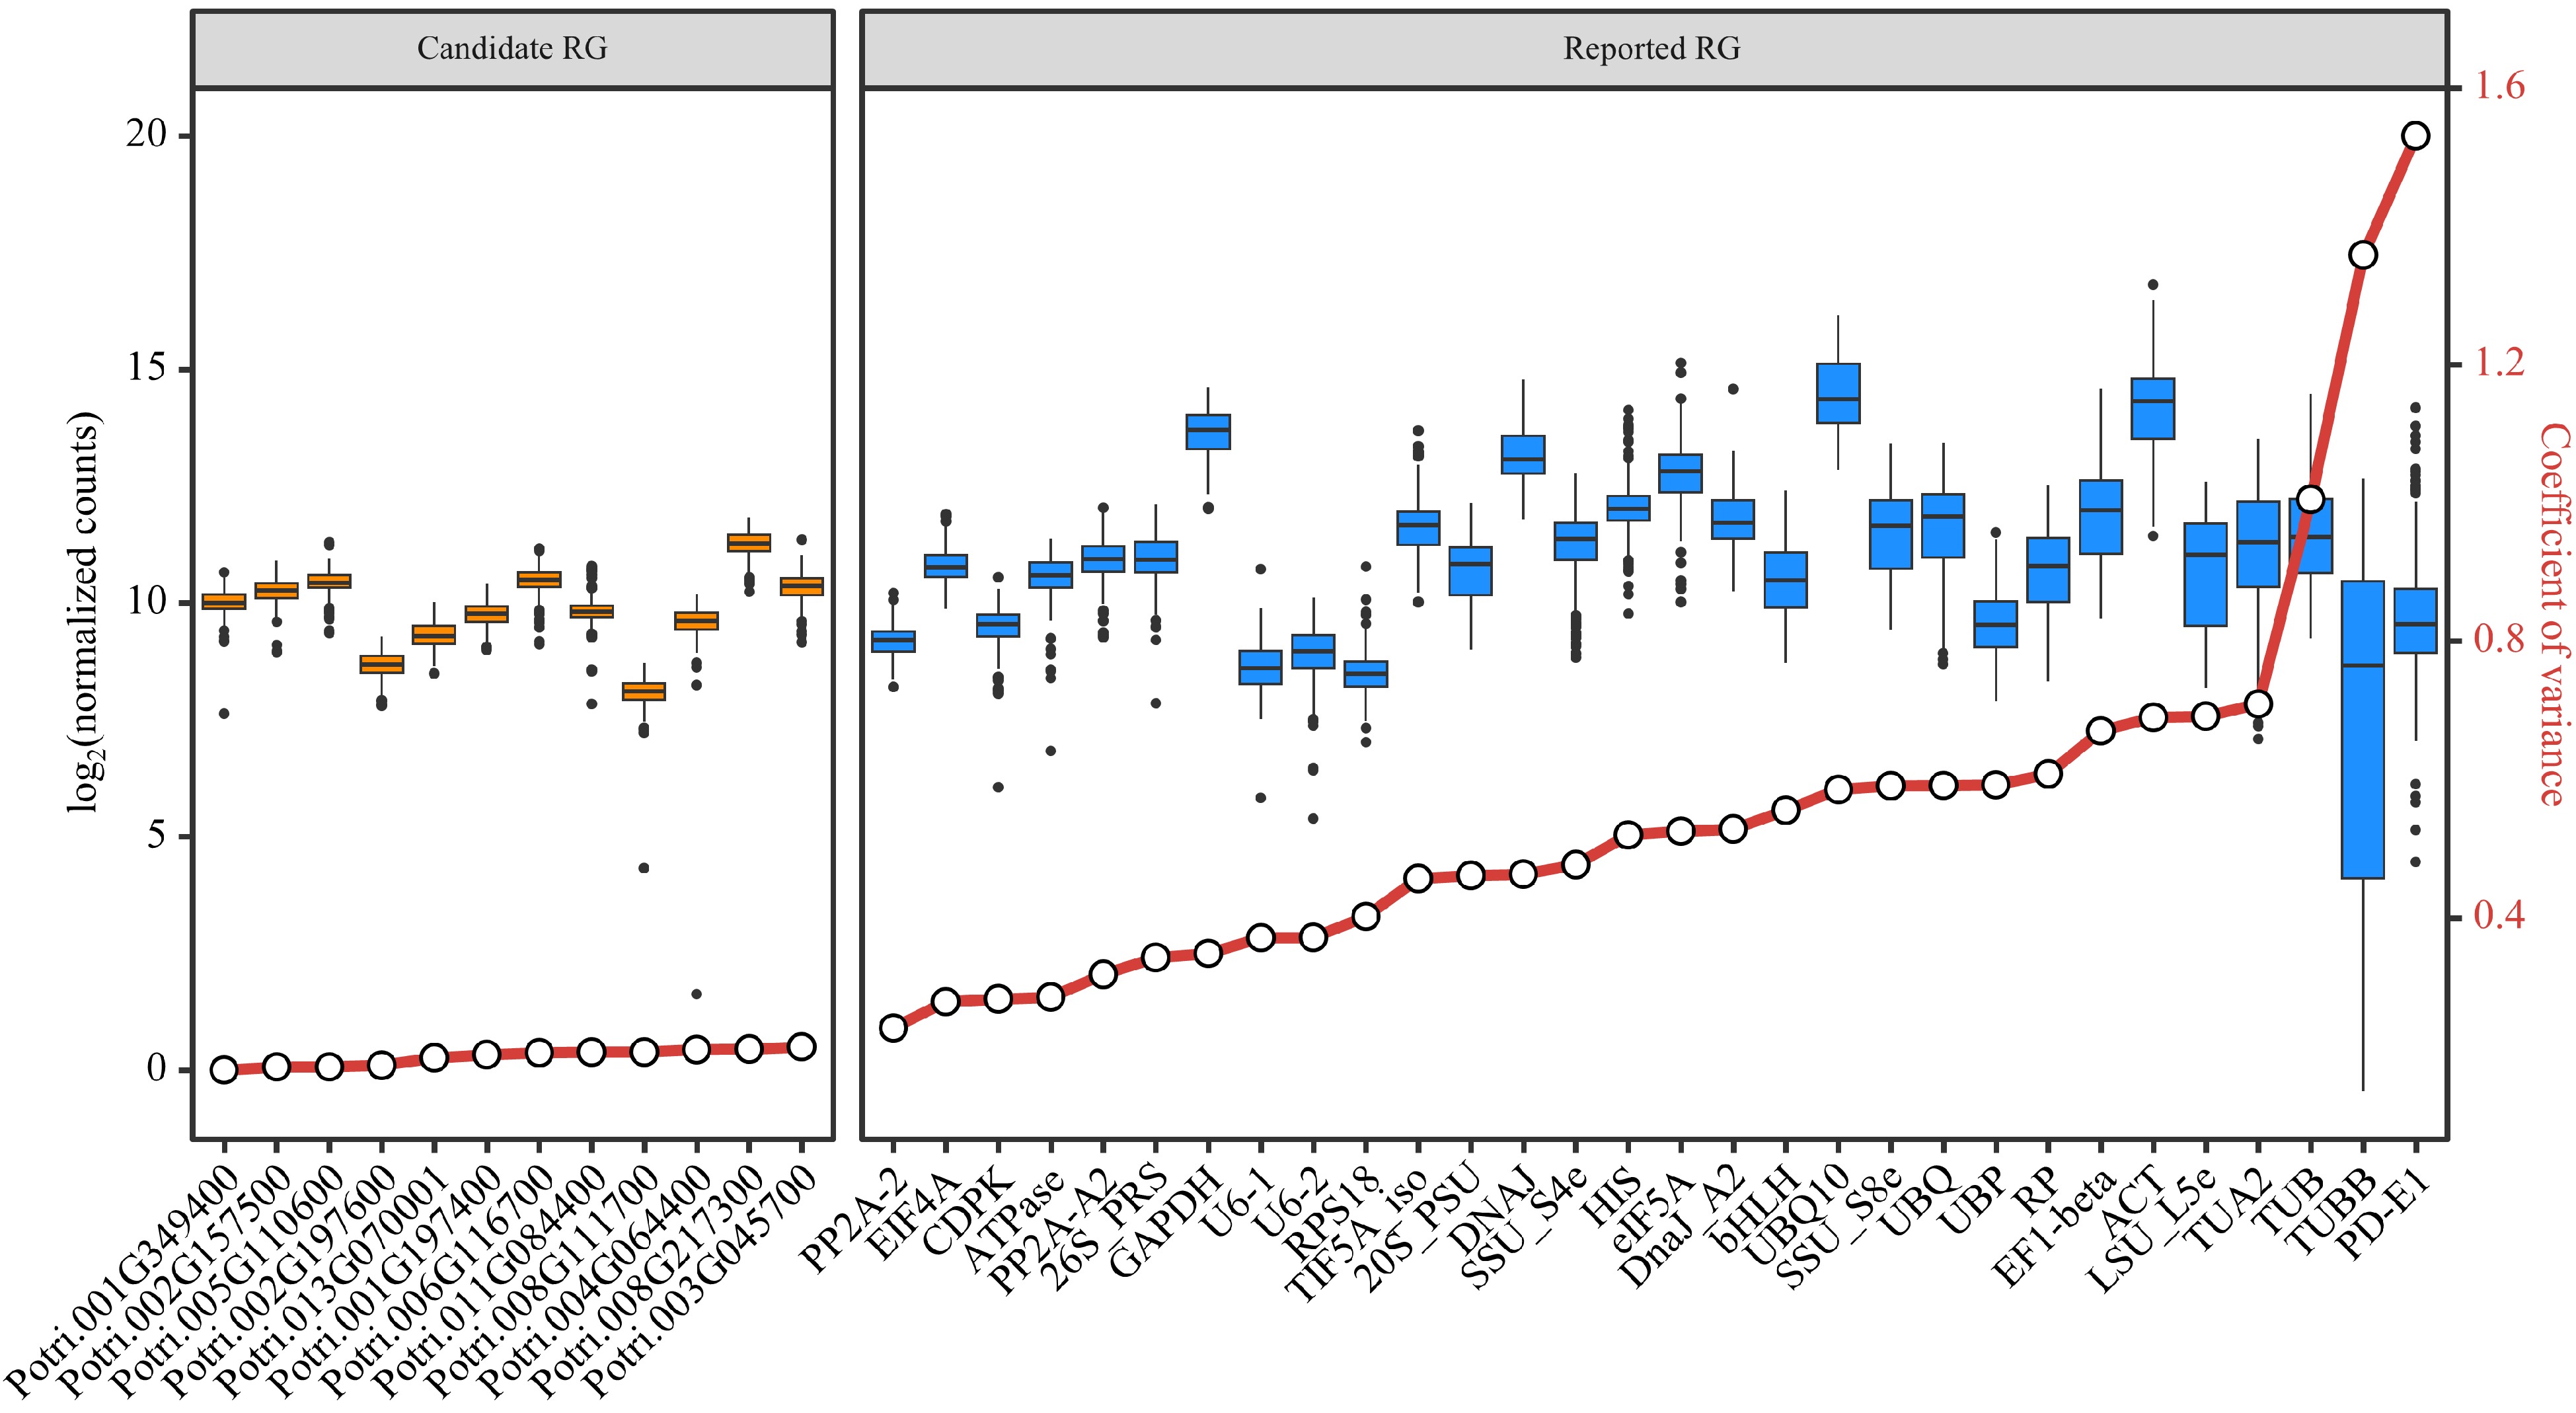
Figure 4.
Assessment of candidate and reported reference genes (RGs) stability based on RNA-Seq data. Box plots are employed to display the distribution of expression levels for 12 candidate RGs and 30 reported RGs. The left side shows the expression distribution of candidate RGs, while the right side shows the expression distribution of reported RGs. The small circles on the red lines represent the coefficient of variance (CV) for the gene expression levels.
-
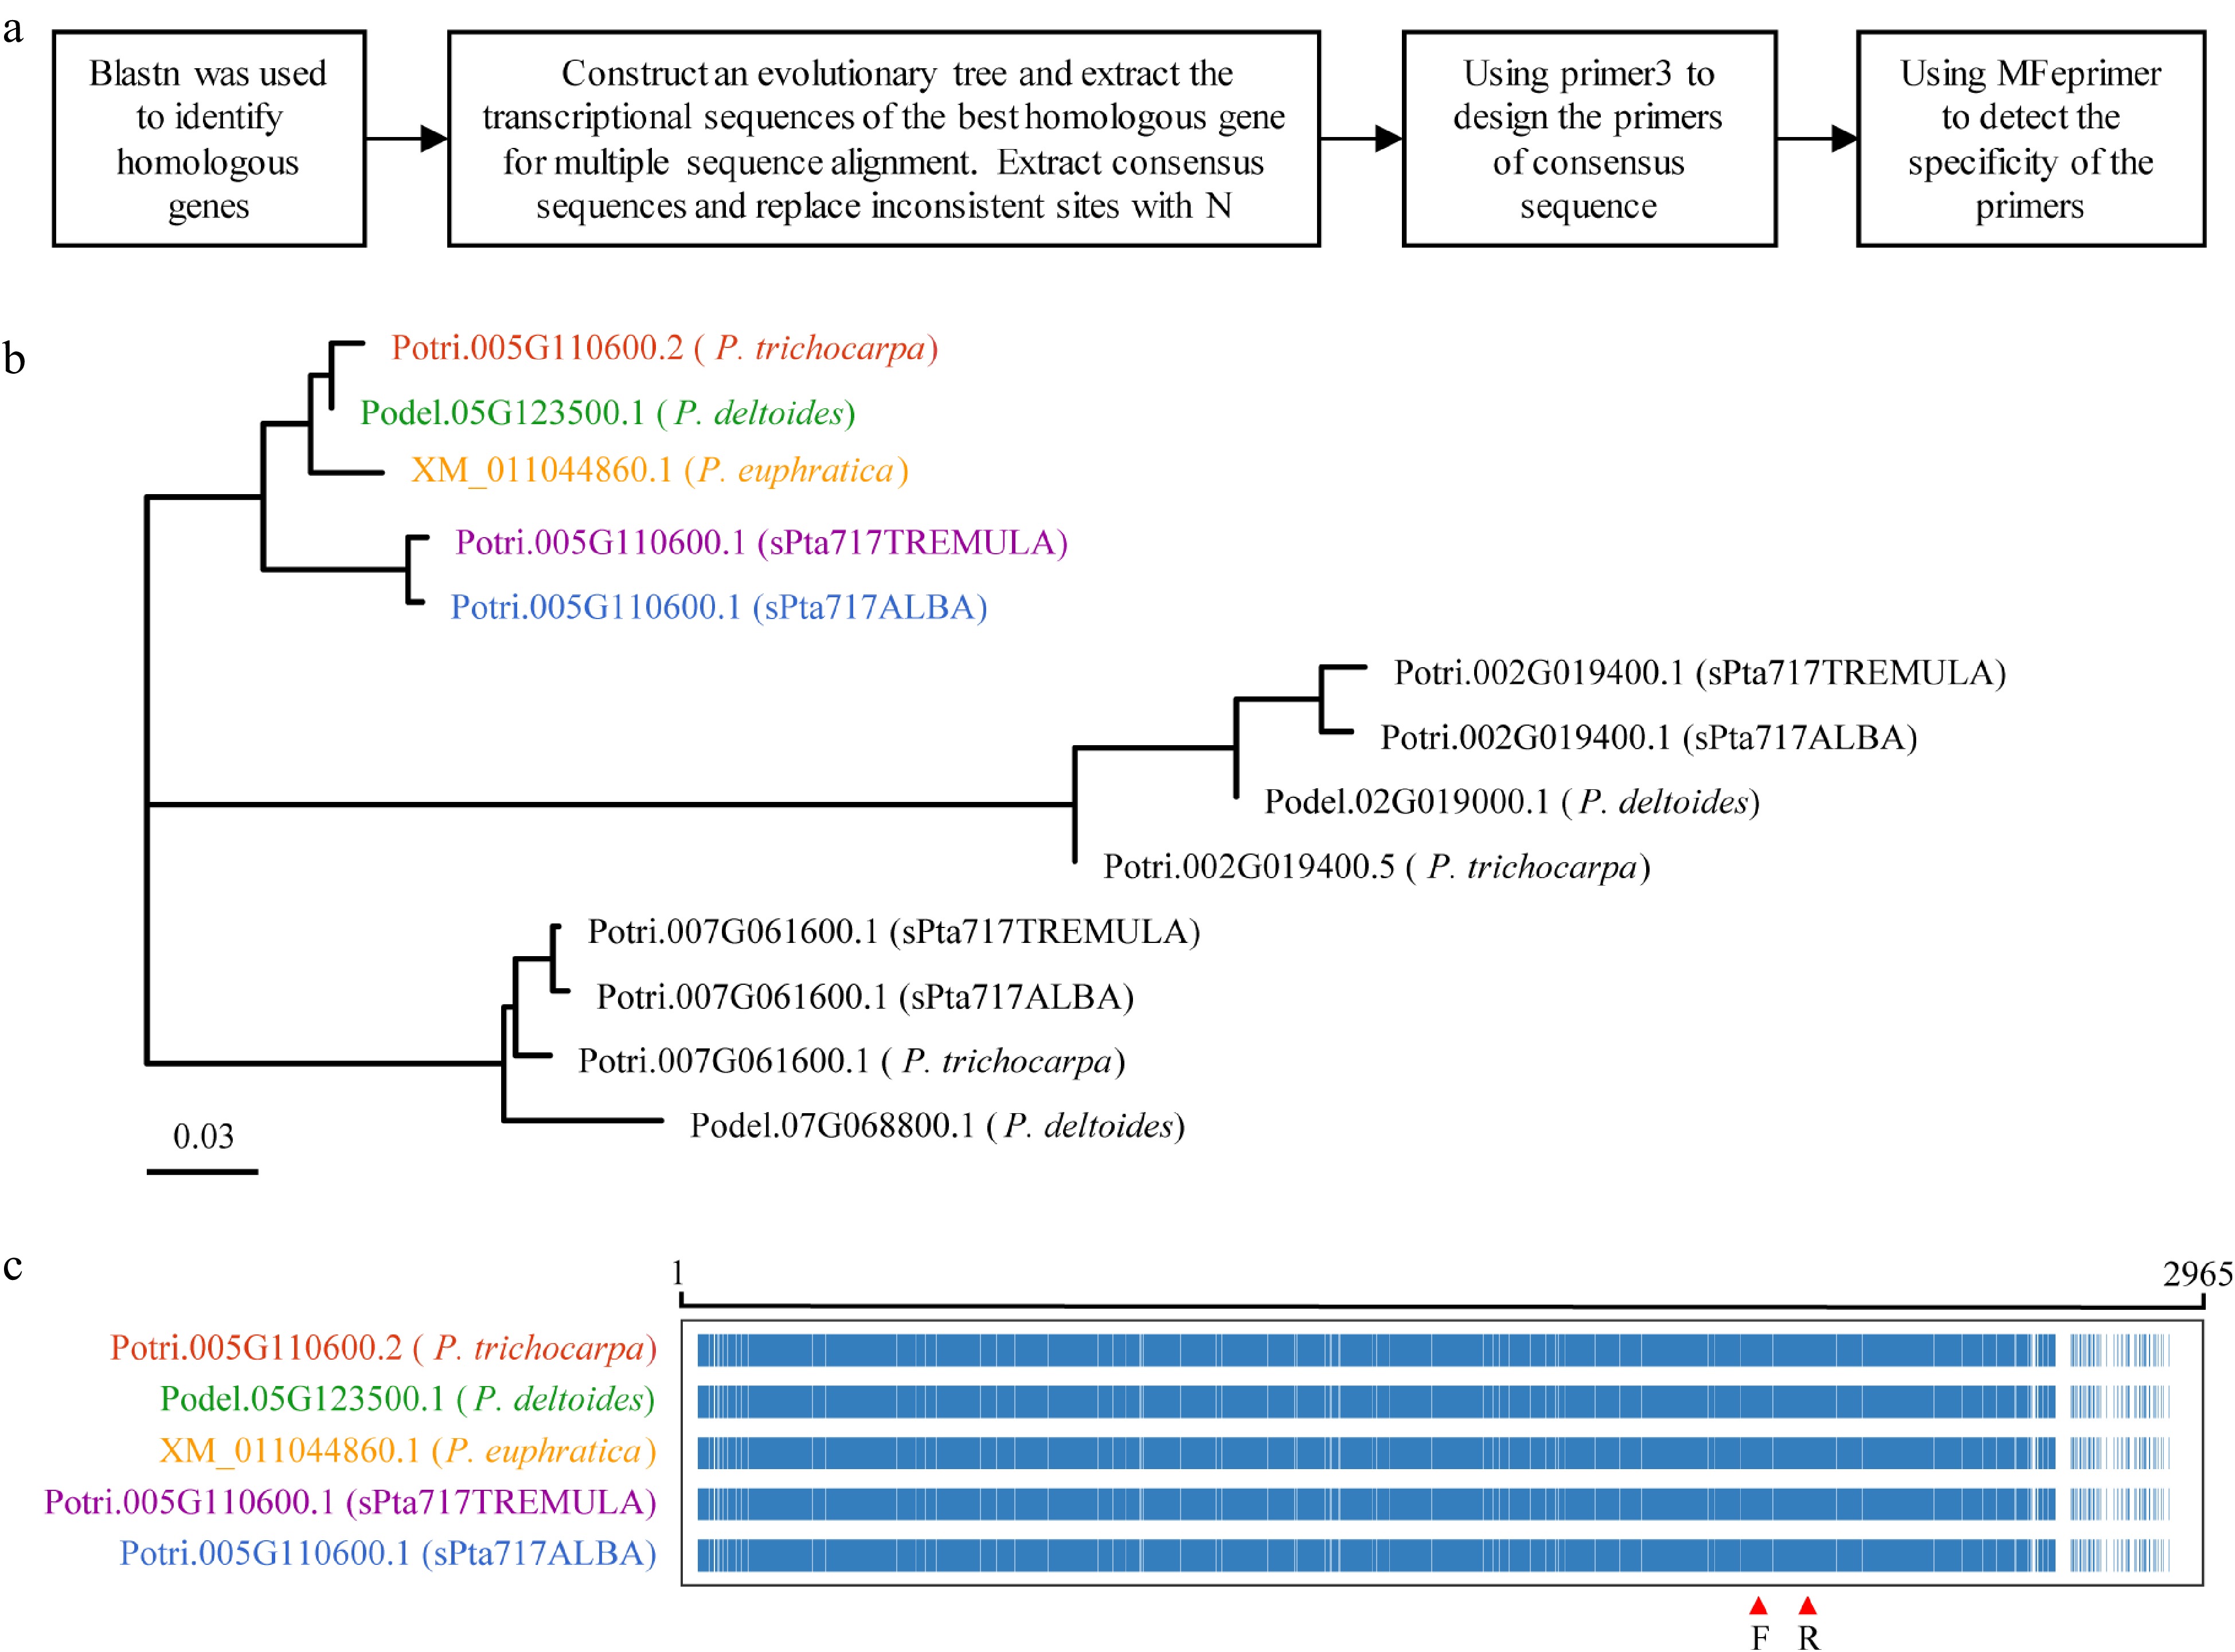
Figure 5.
RT-qPCR primer design. This figure illustrates the process of designing RT-qPCR primers using Potri.005G110600 as a representative example. (a) Flowchart outlining the primer design process is presented. (b) Phylogenetic tree showing the target gene and homologous genes in five different Populus species, with color-coded gene names representing the most homologous genes to the target gene. (c) Multiple sequence alignment of transcript sequences for the target gene Potri.005G110600 and its homologous genes. The alignment highlights conserved positions in blue and non-conserved positions in white. The region indicated by red arrows corresponds to the primer binding site.
-
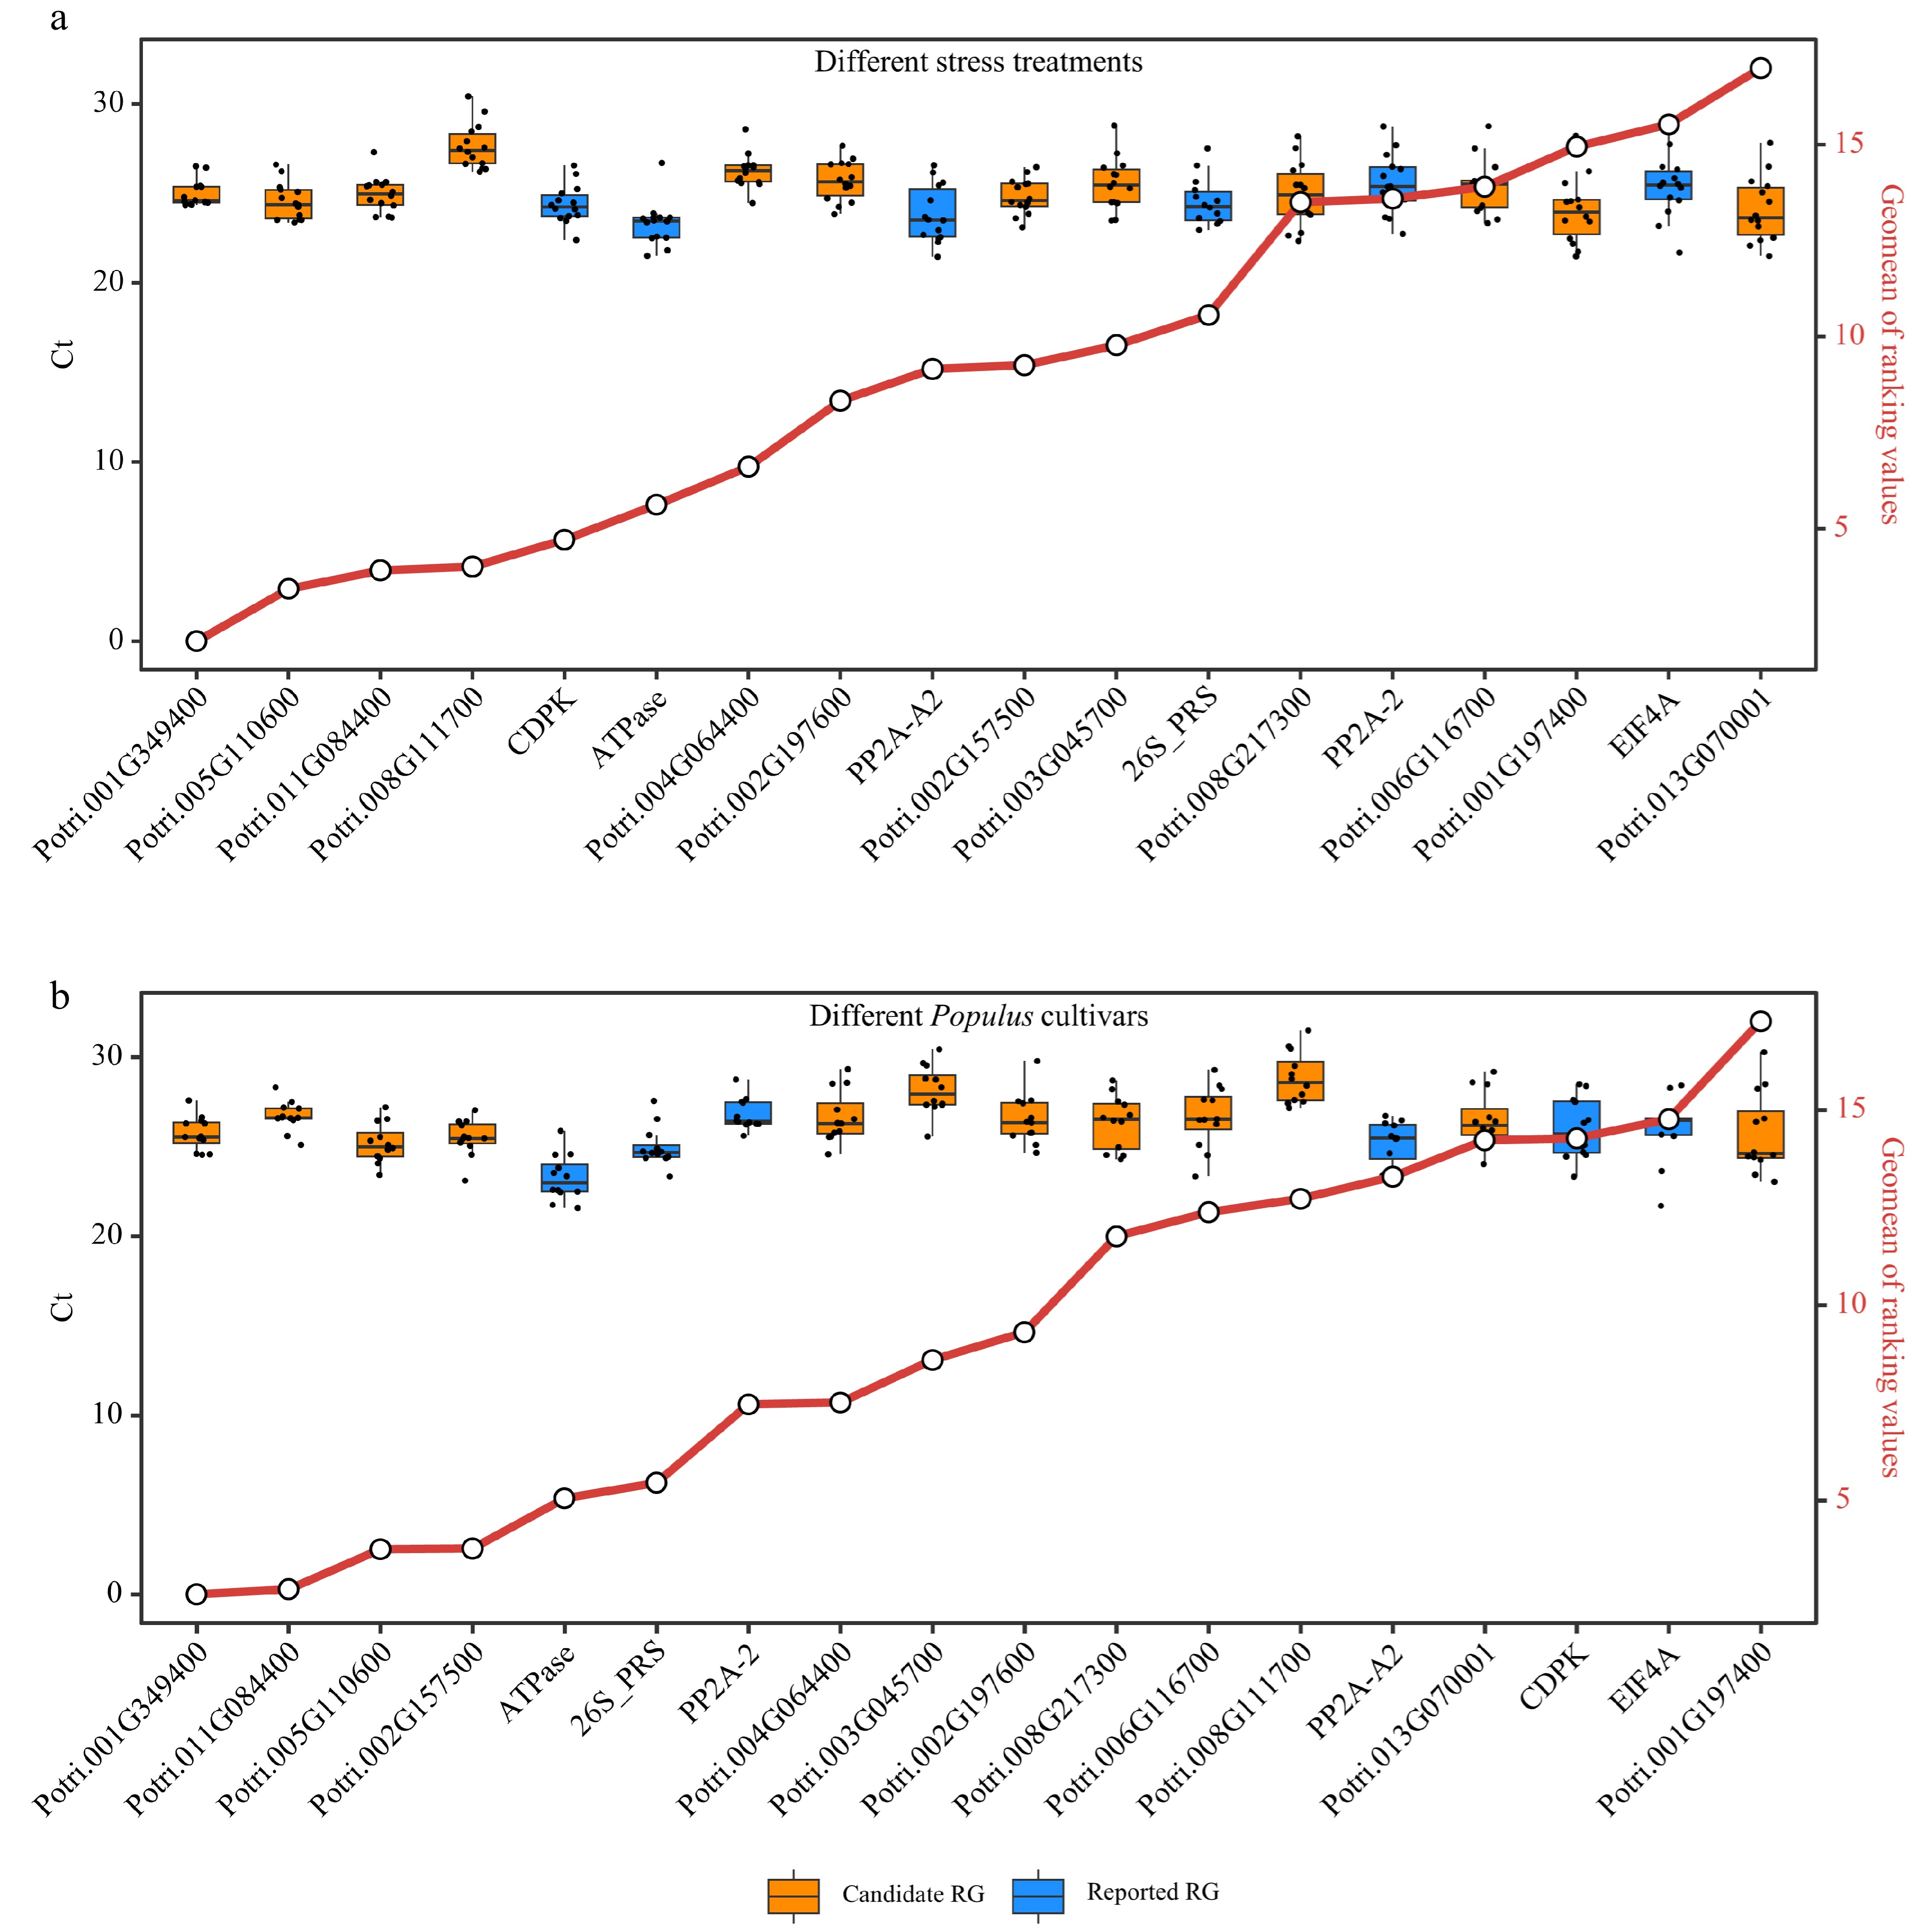
Figure 6.
Comprehensive analysis of expression stability and Ct value distribution of reference genes (RGs). This figure presents a comprehensive evaluation of the expression stability of 18 RGs (12 candidate RGs and six reported RGs) across diverse stress treatments and Populus species using Ref-finder, along with the distribution of Ct values for these 18 RGs. (a) Box plots showing the Ct value distribution and integrated stability ranking of the 18 RGs under different stress treatment experiments (Supplemental Table S5). (b) Box plots depicting the Ct value distribution and integrated stability ranking of the 18 RGs in stems of five different Populus cultivars including P. simonii, P. deltoides, poplar 717, P. alba, and P. adenopoda. The small circles on red line indicate the integrated stability ranking, with smaller values indicating greater stability. All RT-qPCR experiments were performed with three biological replicates and two technical replicates. Each dot of the boxplot represents the average of these six replicates.
-
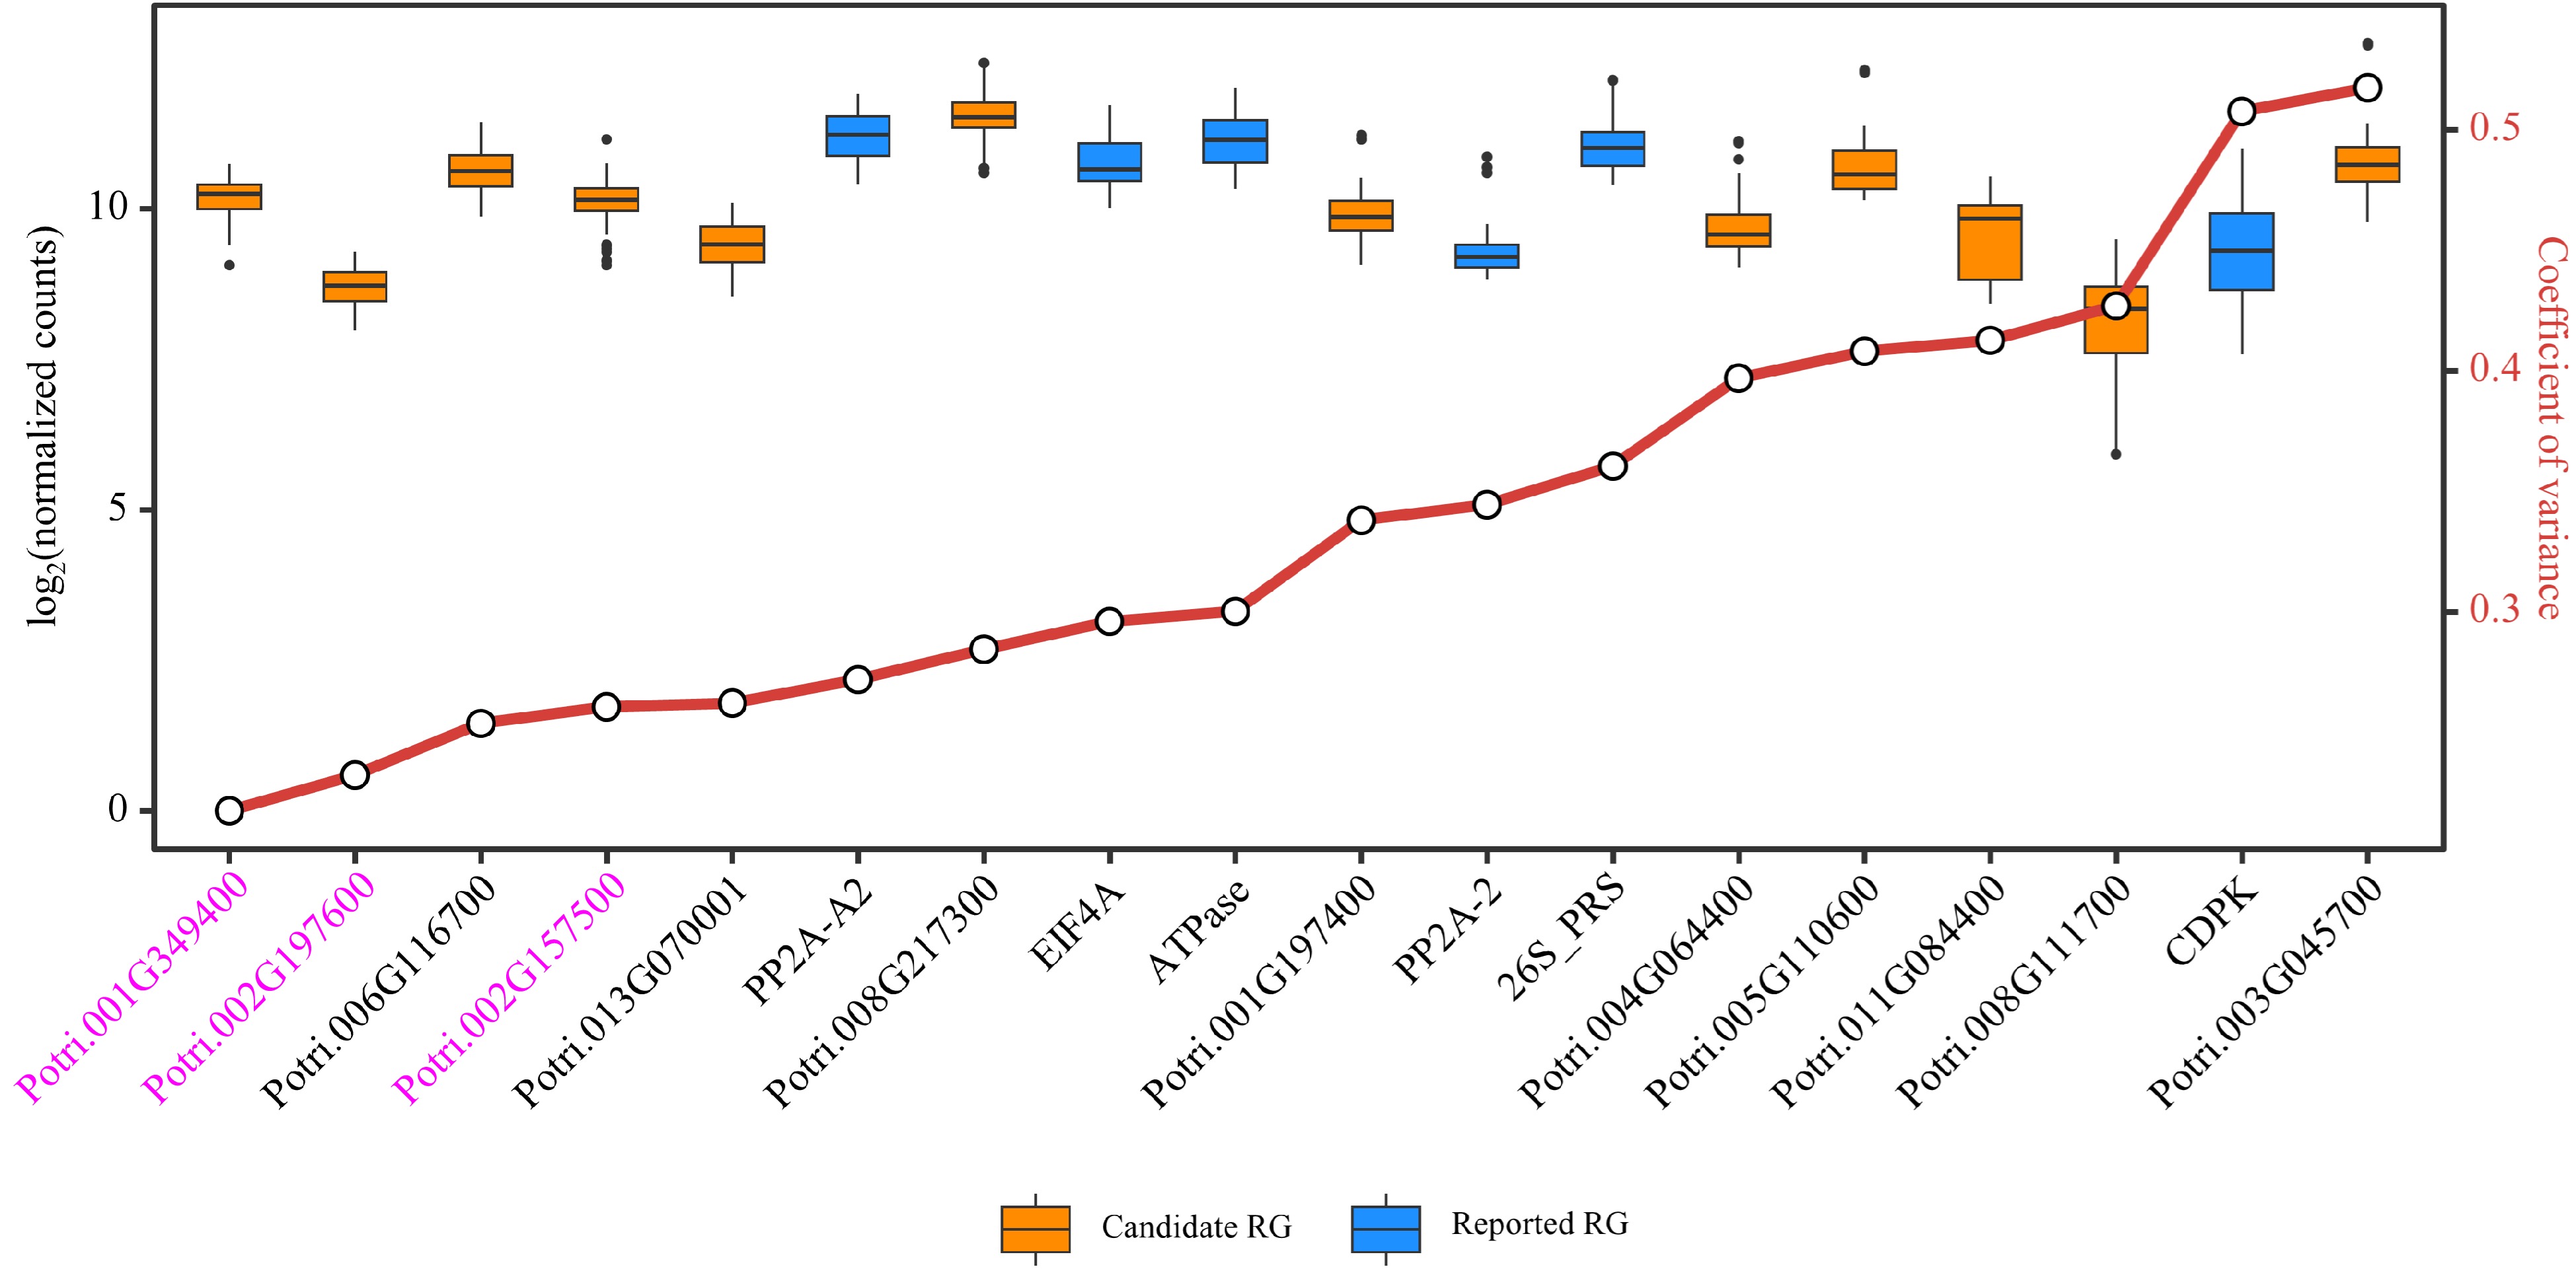
Figure 7.
Evaluation of candidate and reported reference genes (RGs) stability based on RNA-Seq data. Box plots are employed to display the distribution of expression levels for 12 candidate RGs and six reported RGs. The small circles on the red line represents the coefficient of variance (CV) for the gene expression levels, where smaller CV values signify greater stability of gene expression. The three genes considered as novel RGs for poplar stem gene expression analysis are shown in purple.
-
Gene ID Gene name Description CV Potri.001G349400 CNOT2 CCR4-NOT transcription complex subunit 2 0.168 Potri.002G157500 RH8 Similar to DEAD/DEAH box helicase 0.172 Potri.005G110600 VPS35 Vacuolar protein sorting-associated protein 35 0.173 Potri.002G197600 FIP37.1 Similar to ARABIDOPSIS THALIANA FKBP12 INTERACTING PROTEIN 37 0.175 Potri.013G070001 NA UDP-glucose pyrophosphorylase 0.186 Potri.001G197400 Pt-UBP6.2 Similar to UBIQUITIN-SPECIFIC PROTEASE 6 0.190 Potri.006G116700 U2AF1 Splicing factor U2AF 35 kDa subunit 0.193 Potri.008G111700 NA Predicted hydrolases of HD superfamily 0.194 Potri.011G084400 CUL4 Similar to hypothetical protein 0.194 Potri.004G064400 NA Similar to ankyrin protein kinase 0.198 Potri.008G217300 Pt-CUL1.4 Similar to cullin-like protein1 0.199 Potri.003G045700 Pt-ATRLI1.2 Similar to RNase L inhibitor protein; putative 0.202 NA: not available. The estimated CVs were based on the normalization method of DESeq2's median of ratios. Table 1.
Information of candidate reference genes (RGs) with the smallest coefficient of variance (CV) values among the 292 RNA-Seq samples.
Figures
(7)
Tables
(1)