-
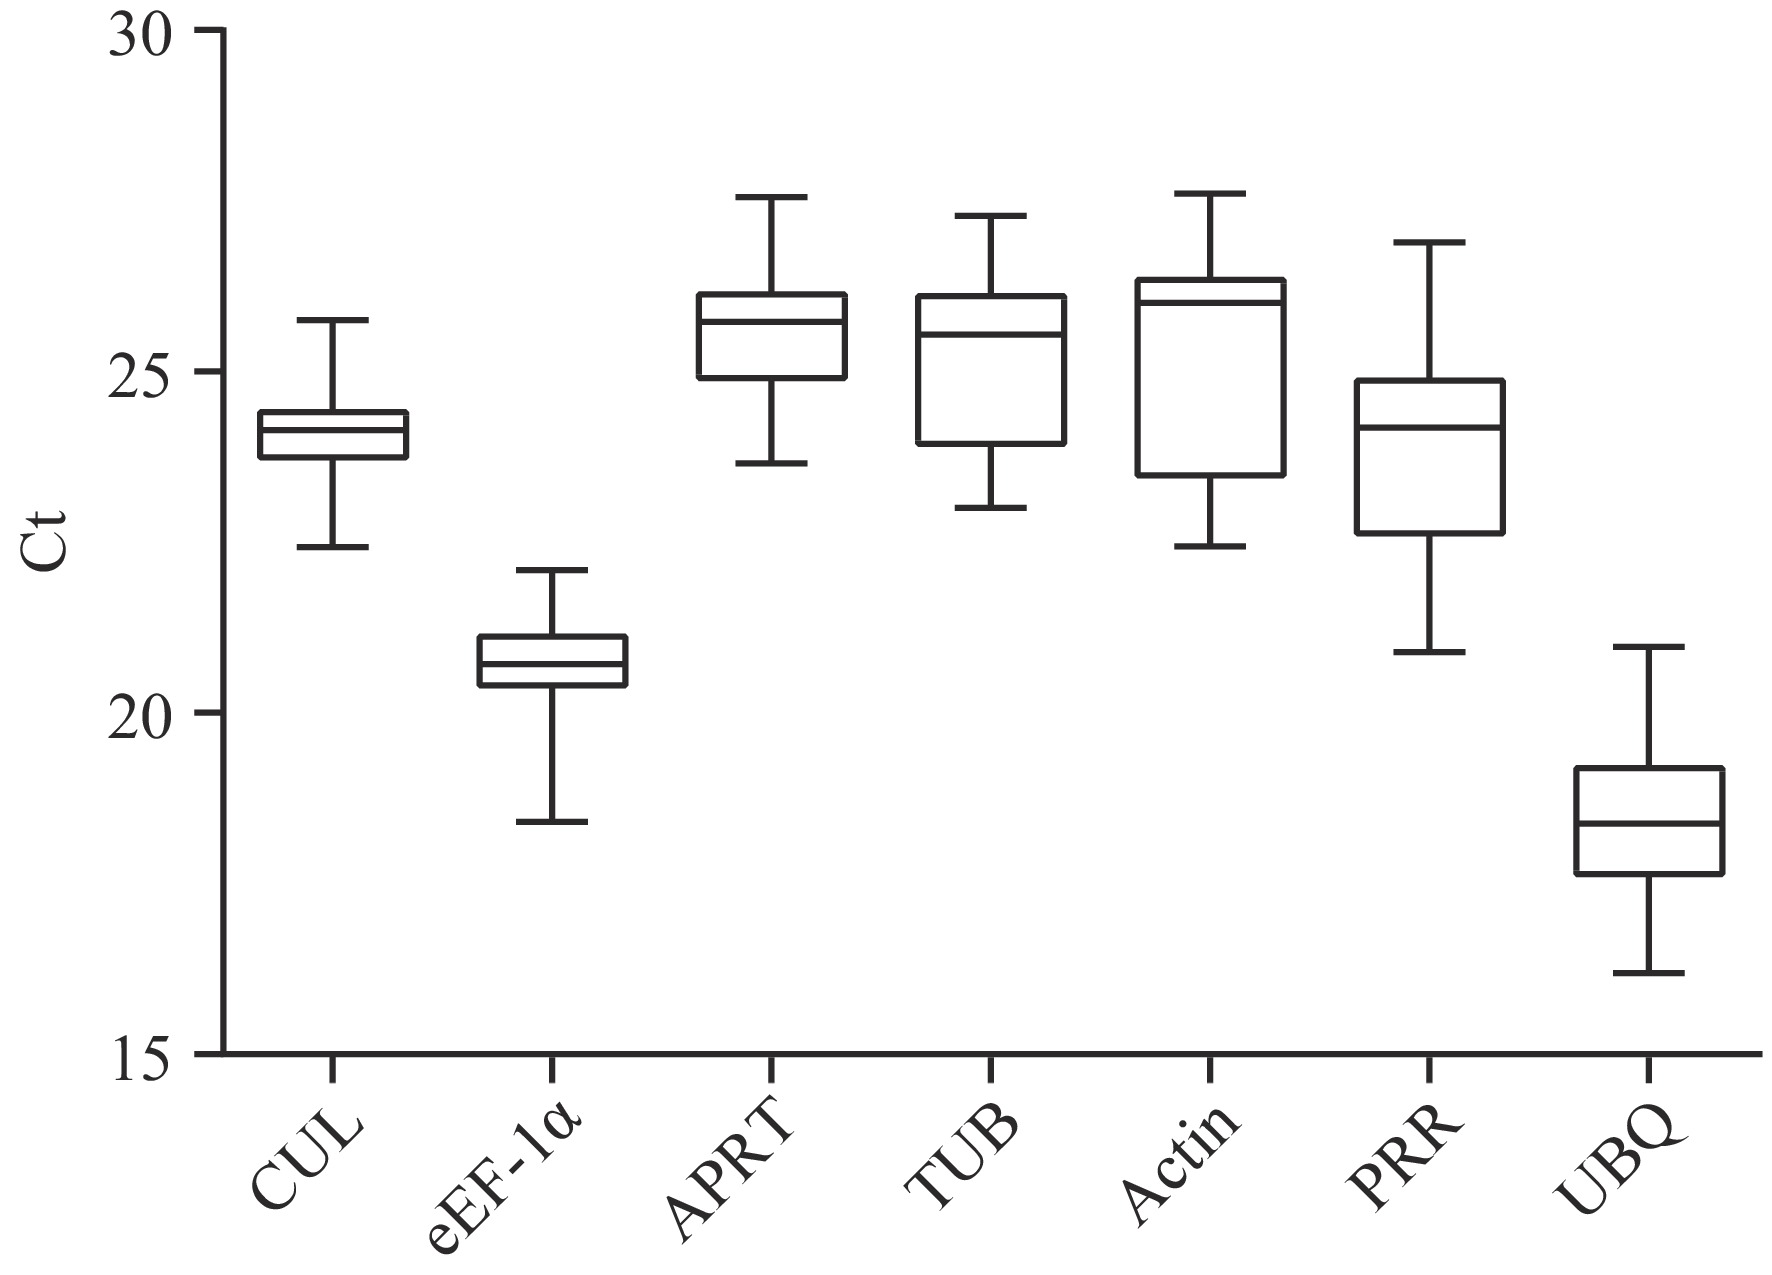
Figure 1.
CT value distribution of the seven candidate internal reference genes in different tissue samples (root, stem, and leaf) and under different stresses (cold stress, MeJA stress, and SA stress) of G. elegans by GraphPad 6.0. The smaller the CT value, the higher the gene expression abundance. The change of the CT value of the same candidate internal reference gene in different samples reflects the gene expression stability. CUL, cullin; eEF-1α, eukaryotic elongation factor 1-alpha; APRT, adenine phosphoribosyl transferase; TUB, β-tubulin; Actin, actin; PRR, pseudo response regulator; UBQ, polyubiquitin.
-
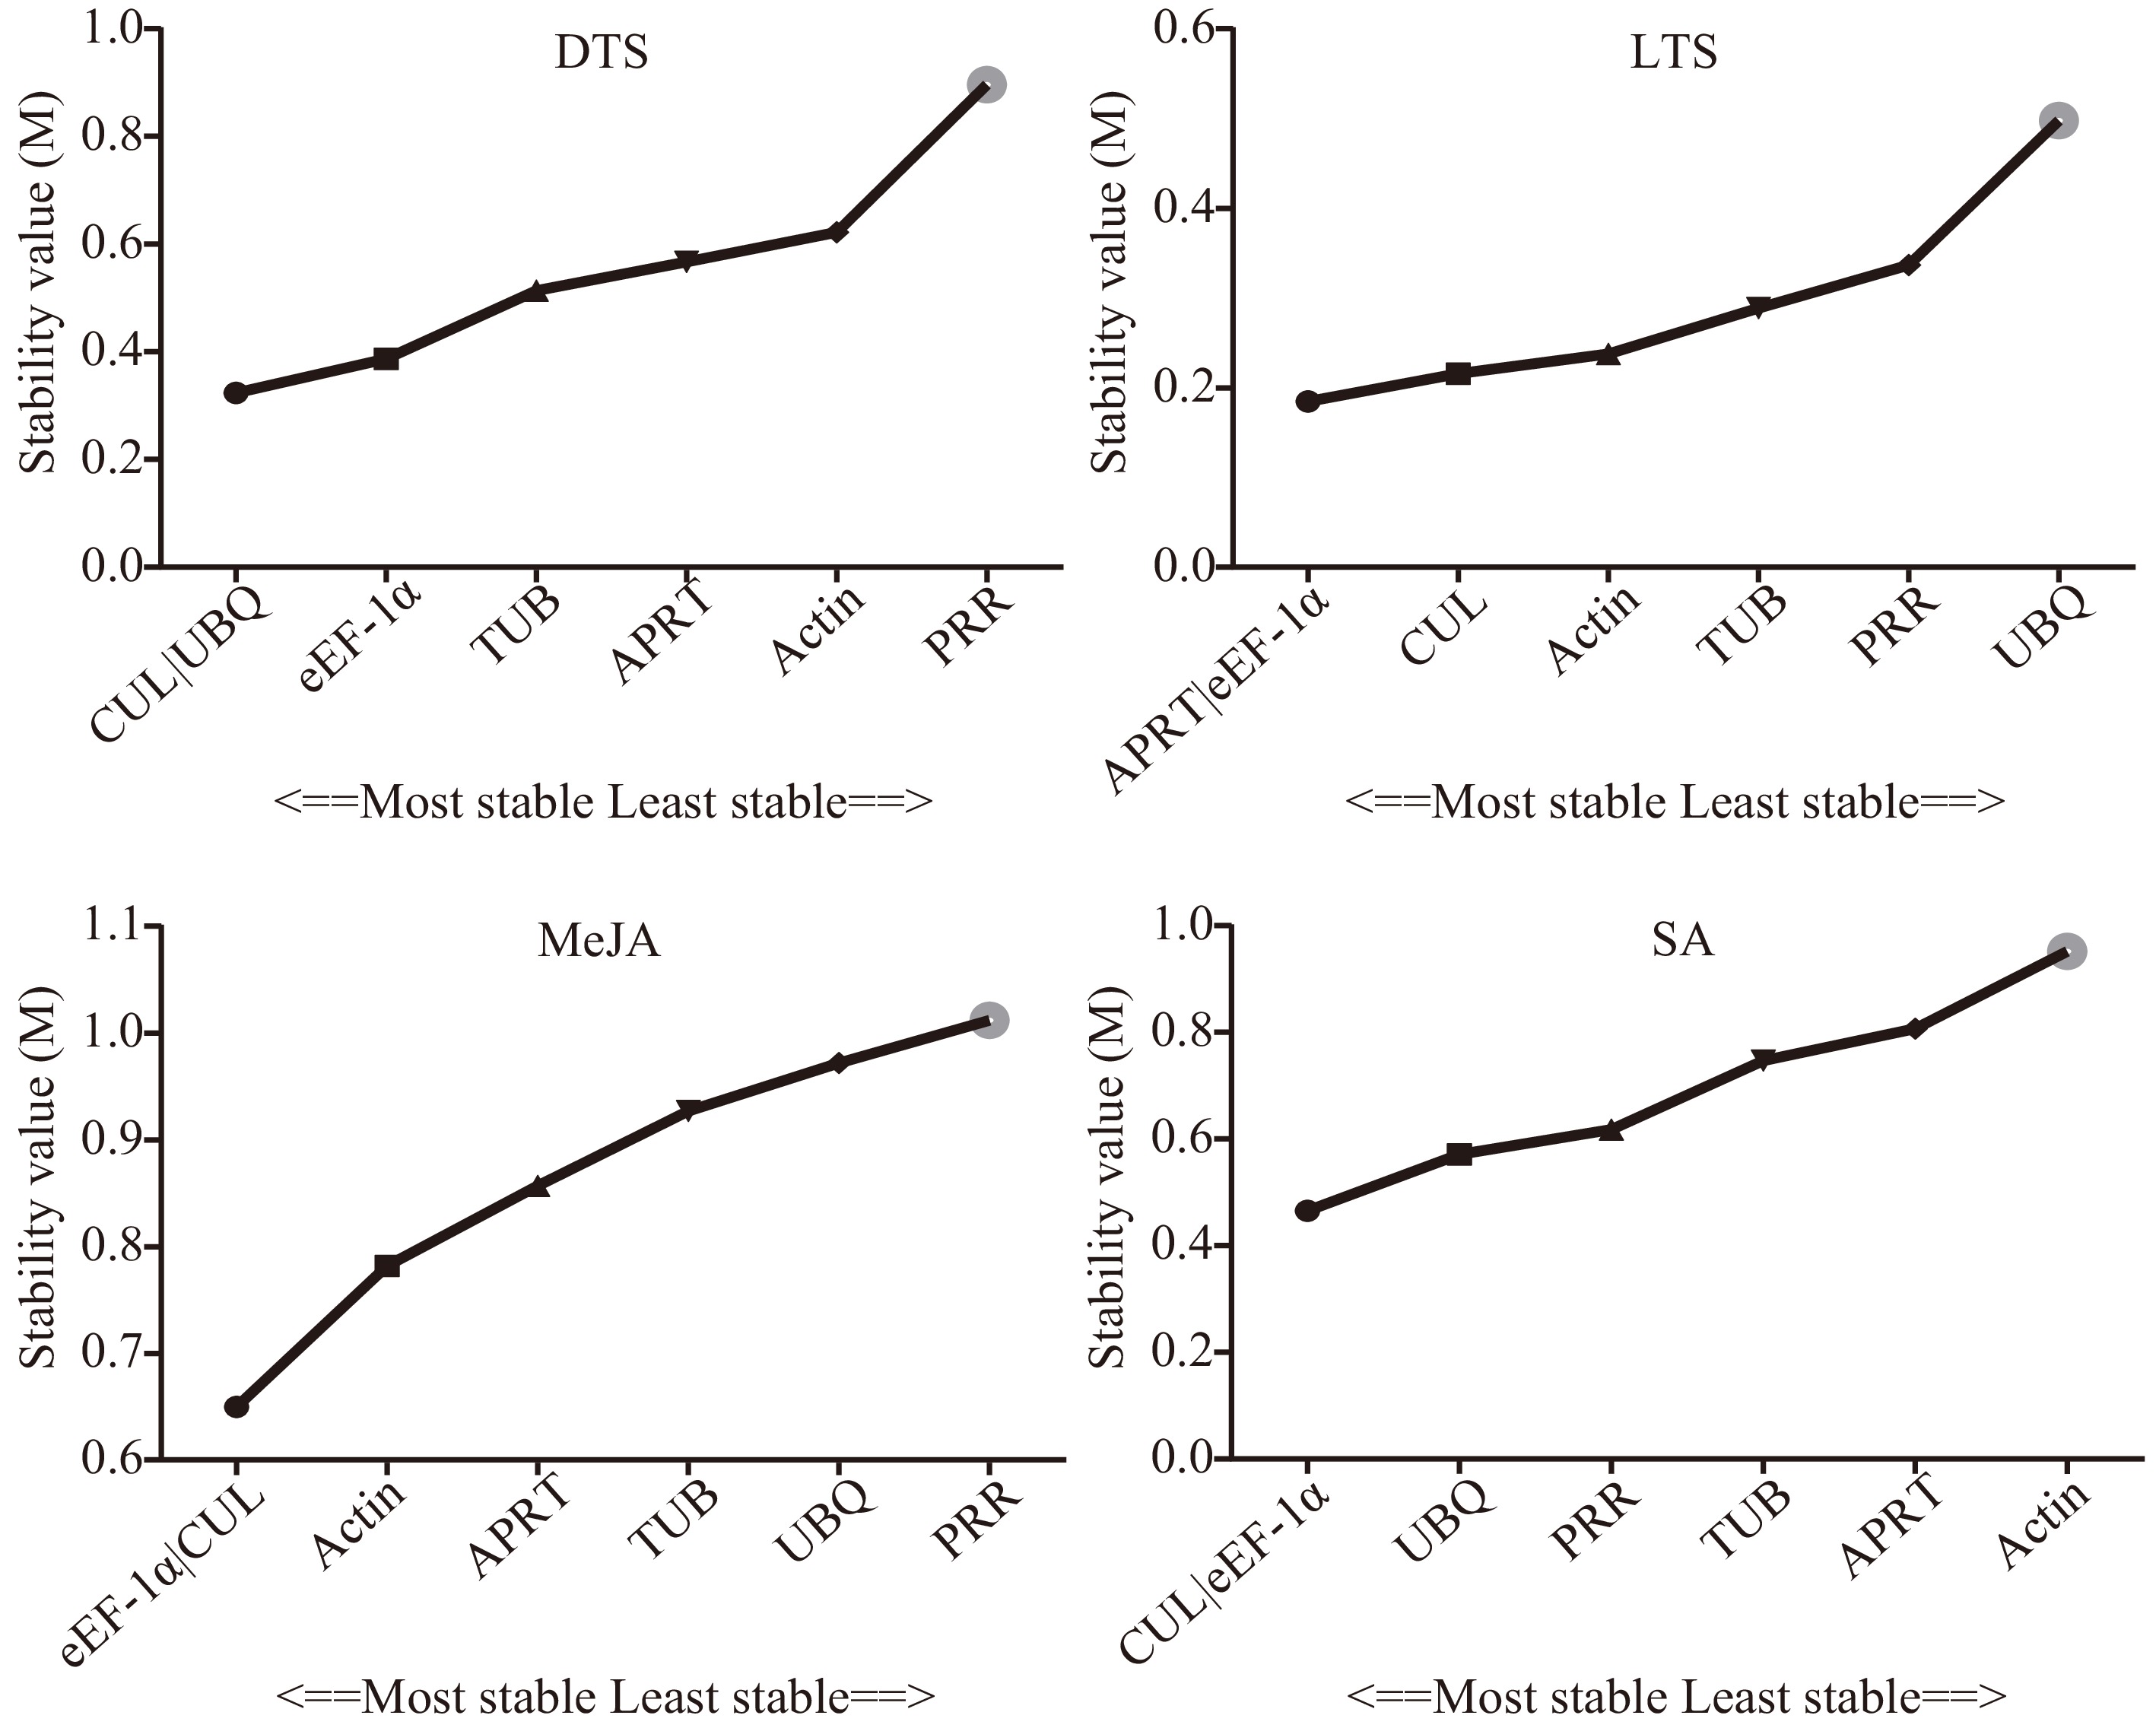
Figure 2.
Stability of the seven candidate internal reference genes by geNorm. DTS, different G. elegans tissue samples; LTS, G. elegans leaves under low-temperature stress; CTS, both of the DTS and LTS samples. CUL, cullin; eEF-1α, eukaryotic elongation factor 1-alpha; APRT, adenine phosphoribosyl transferase; TUB, β-tubulin; Actin, actin; PRR, pseudo response regulator; UBQ, polyubiquitin.
-
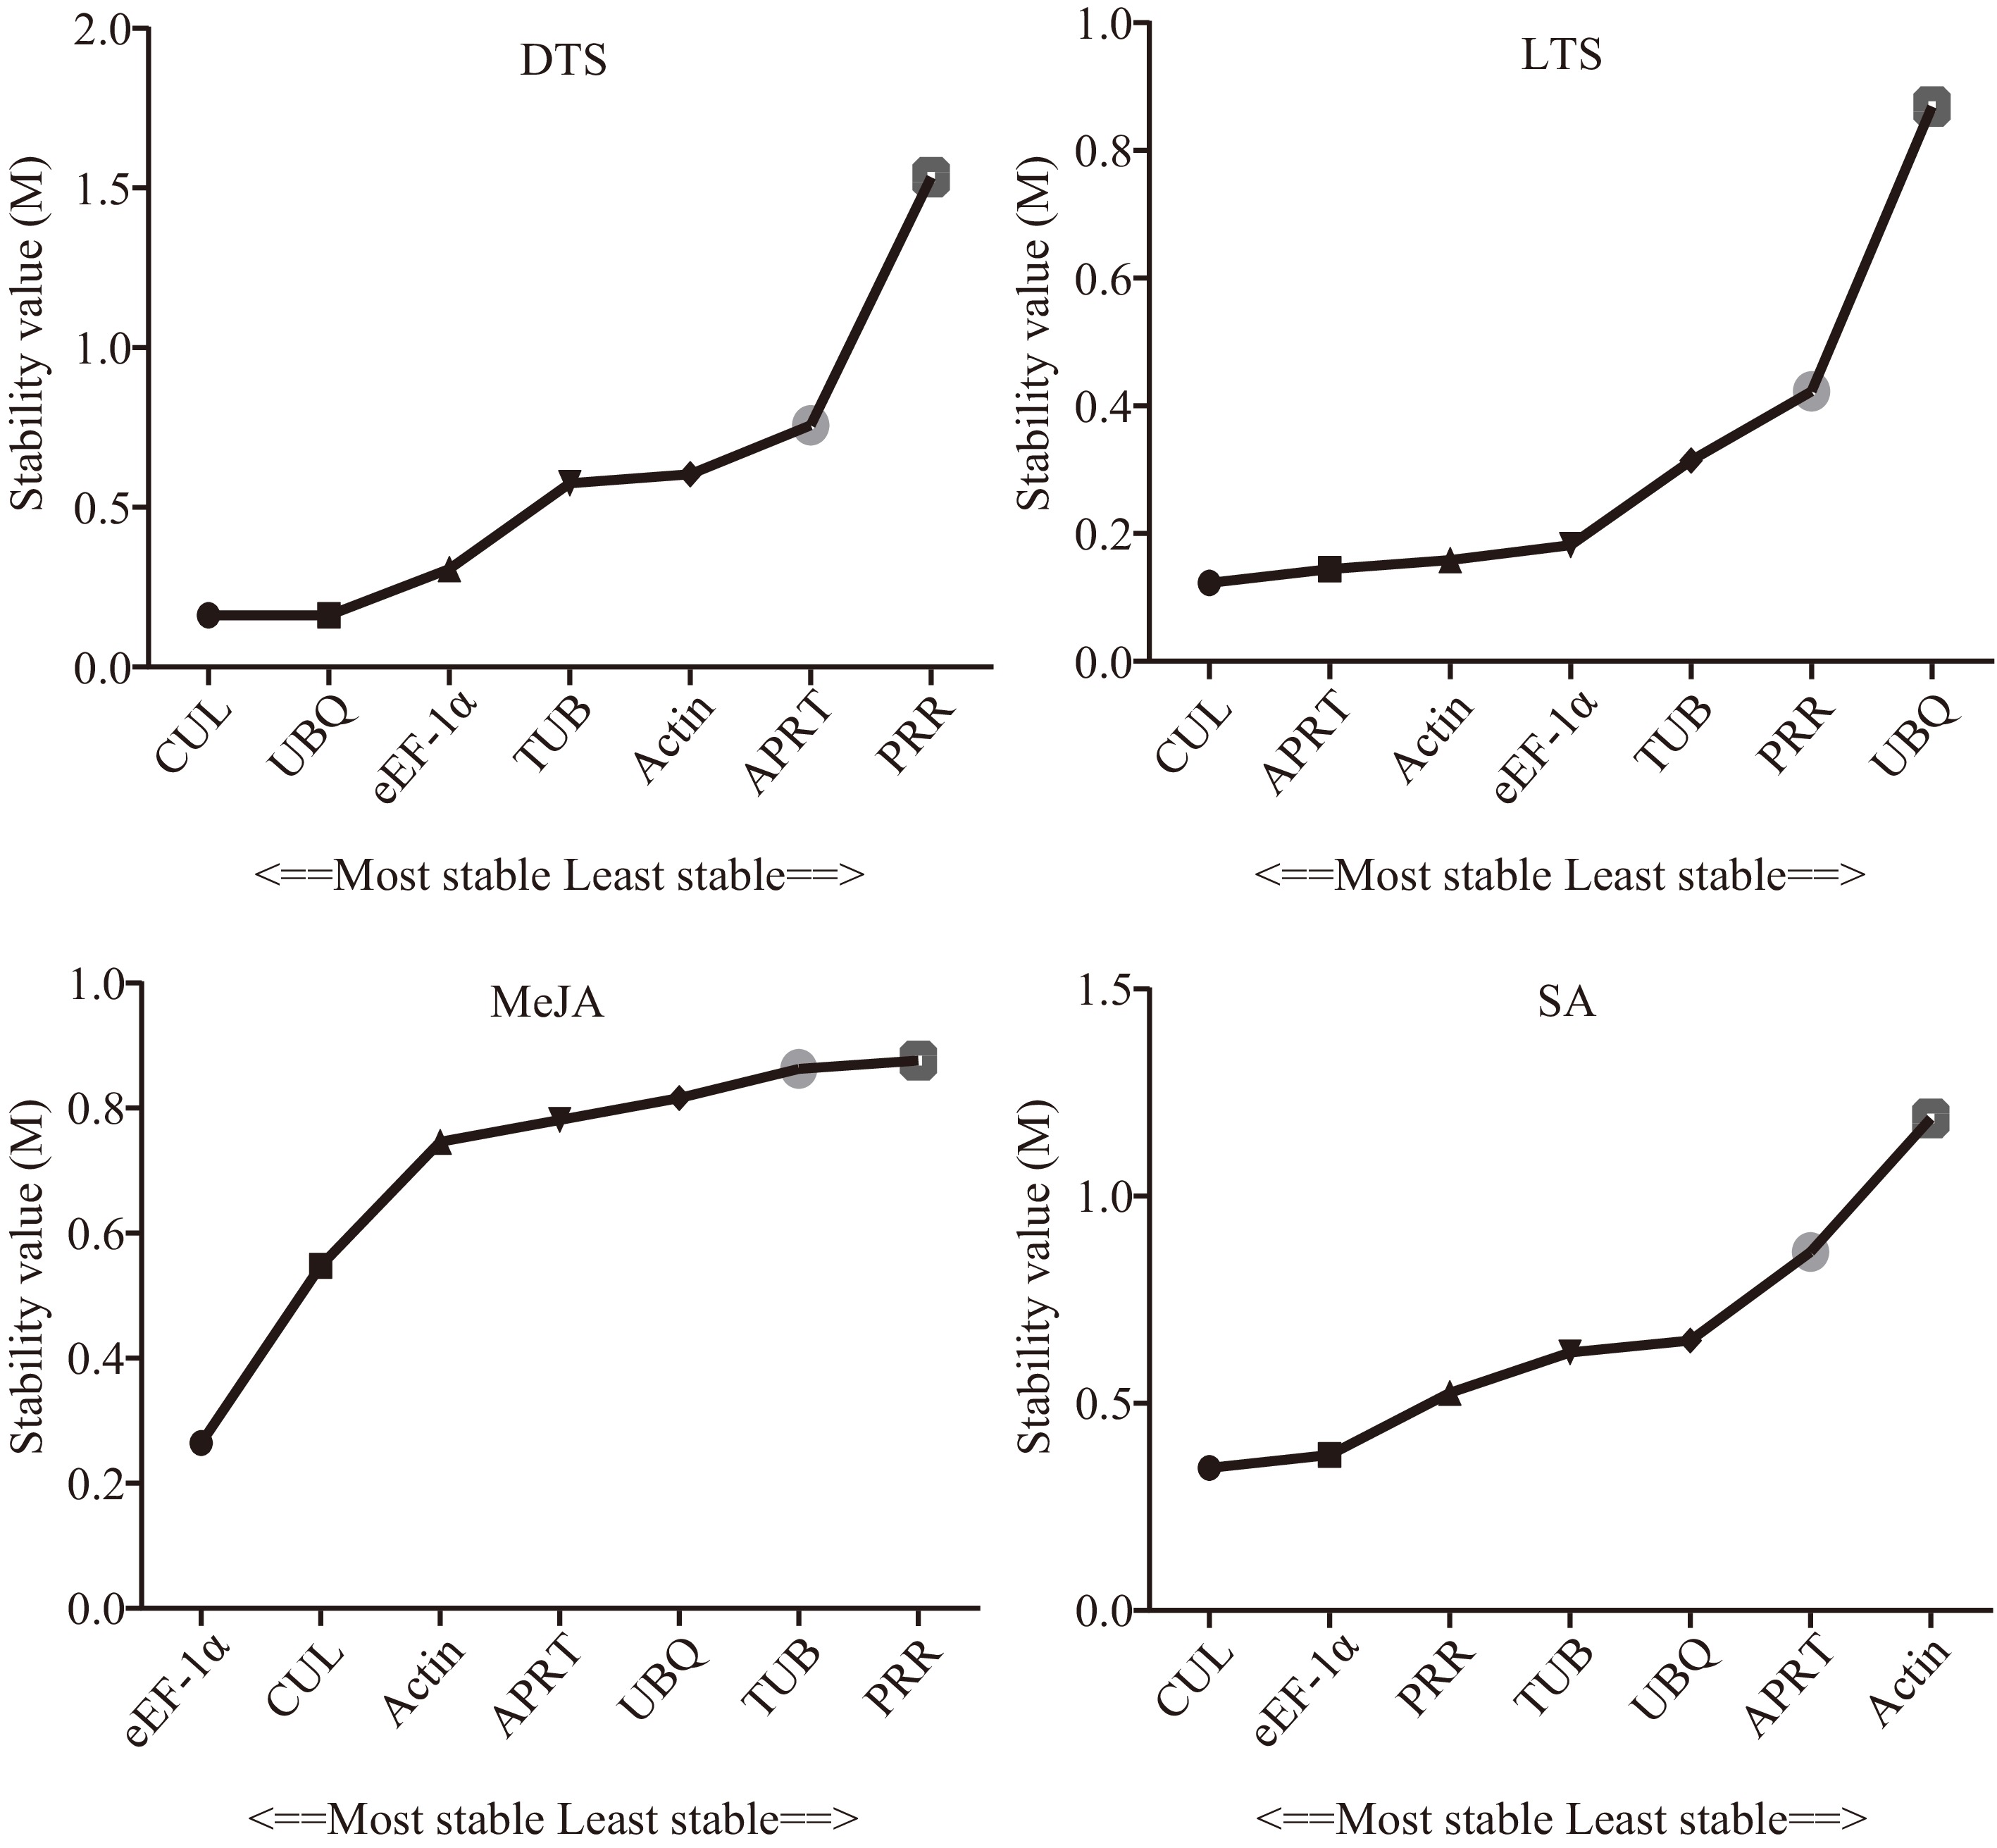
Figure 3.
Stability of the seven candidate internal reference genes by NormFinder. DTS, different G. elegans tissue samples; LTS, G. elegans leaves under low-temperature stress; CTS, both of the DTS and LTS samples. CUL, cullin; eEF-1α, eukaryotic elongation factor 1-alpha; APRT, adenine phosphoribosyl transferase; TUB, β-tubulin; Actin, actin; PRR, pseudo response regulator; UBQ, polyubiquitin.
-
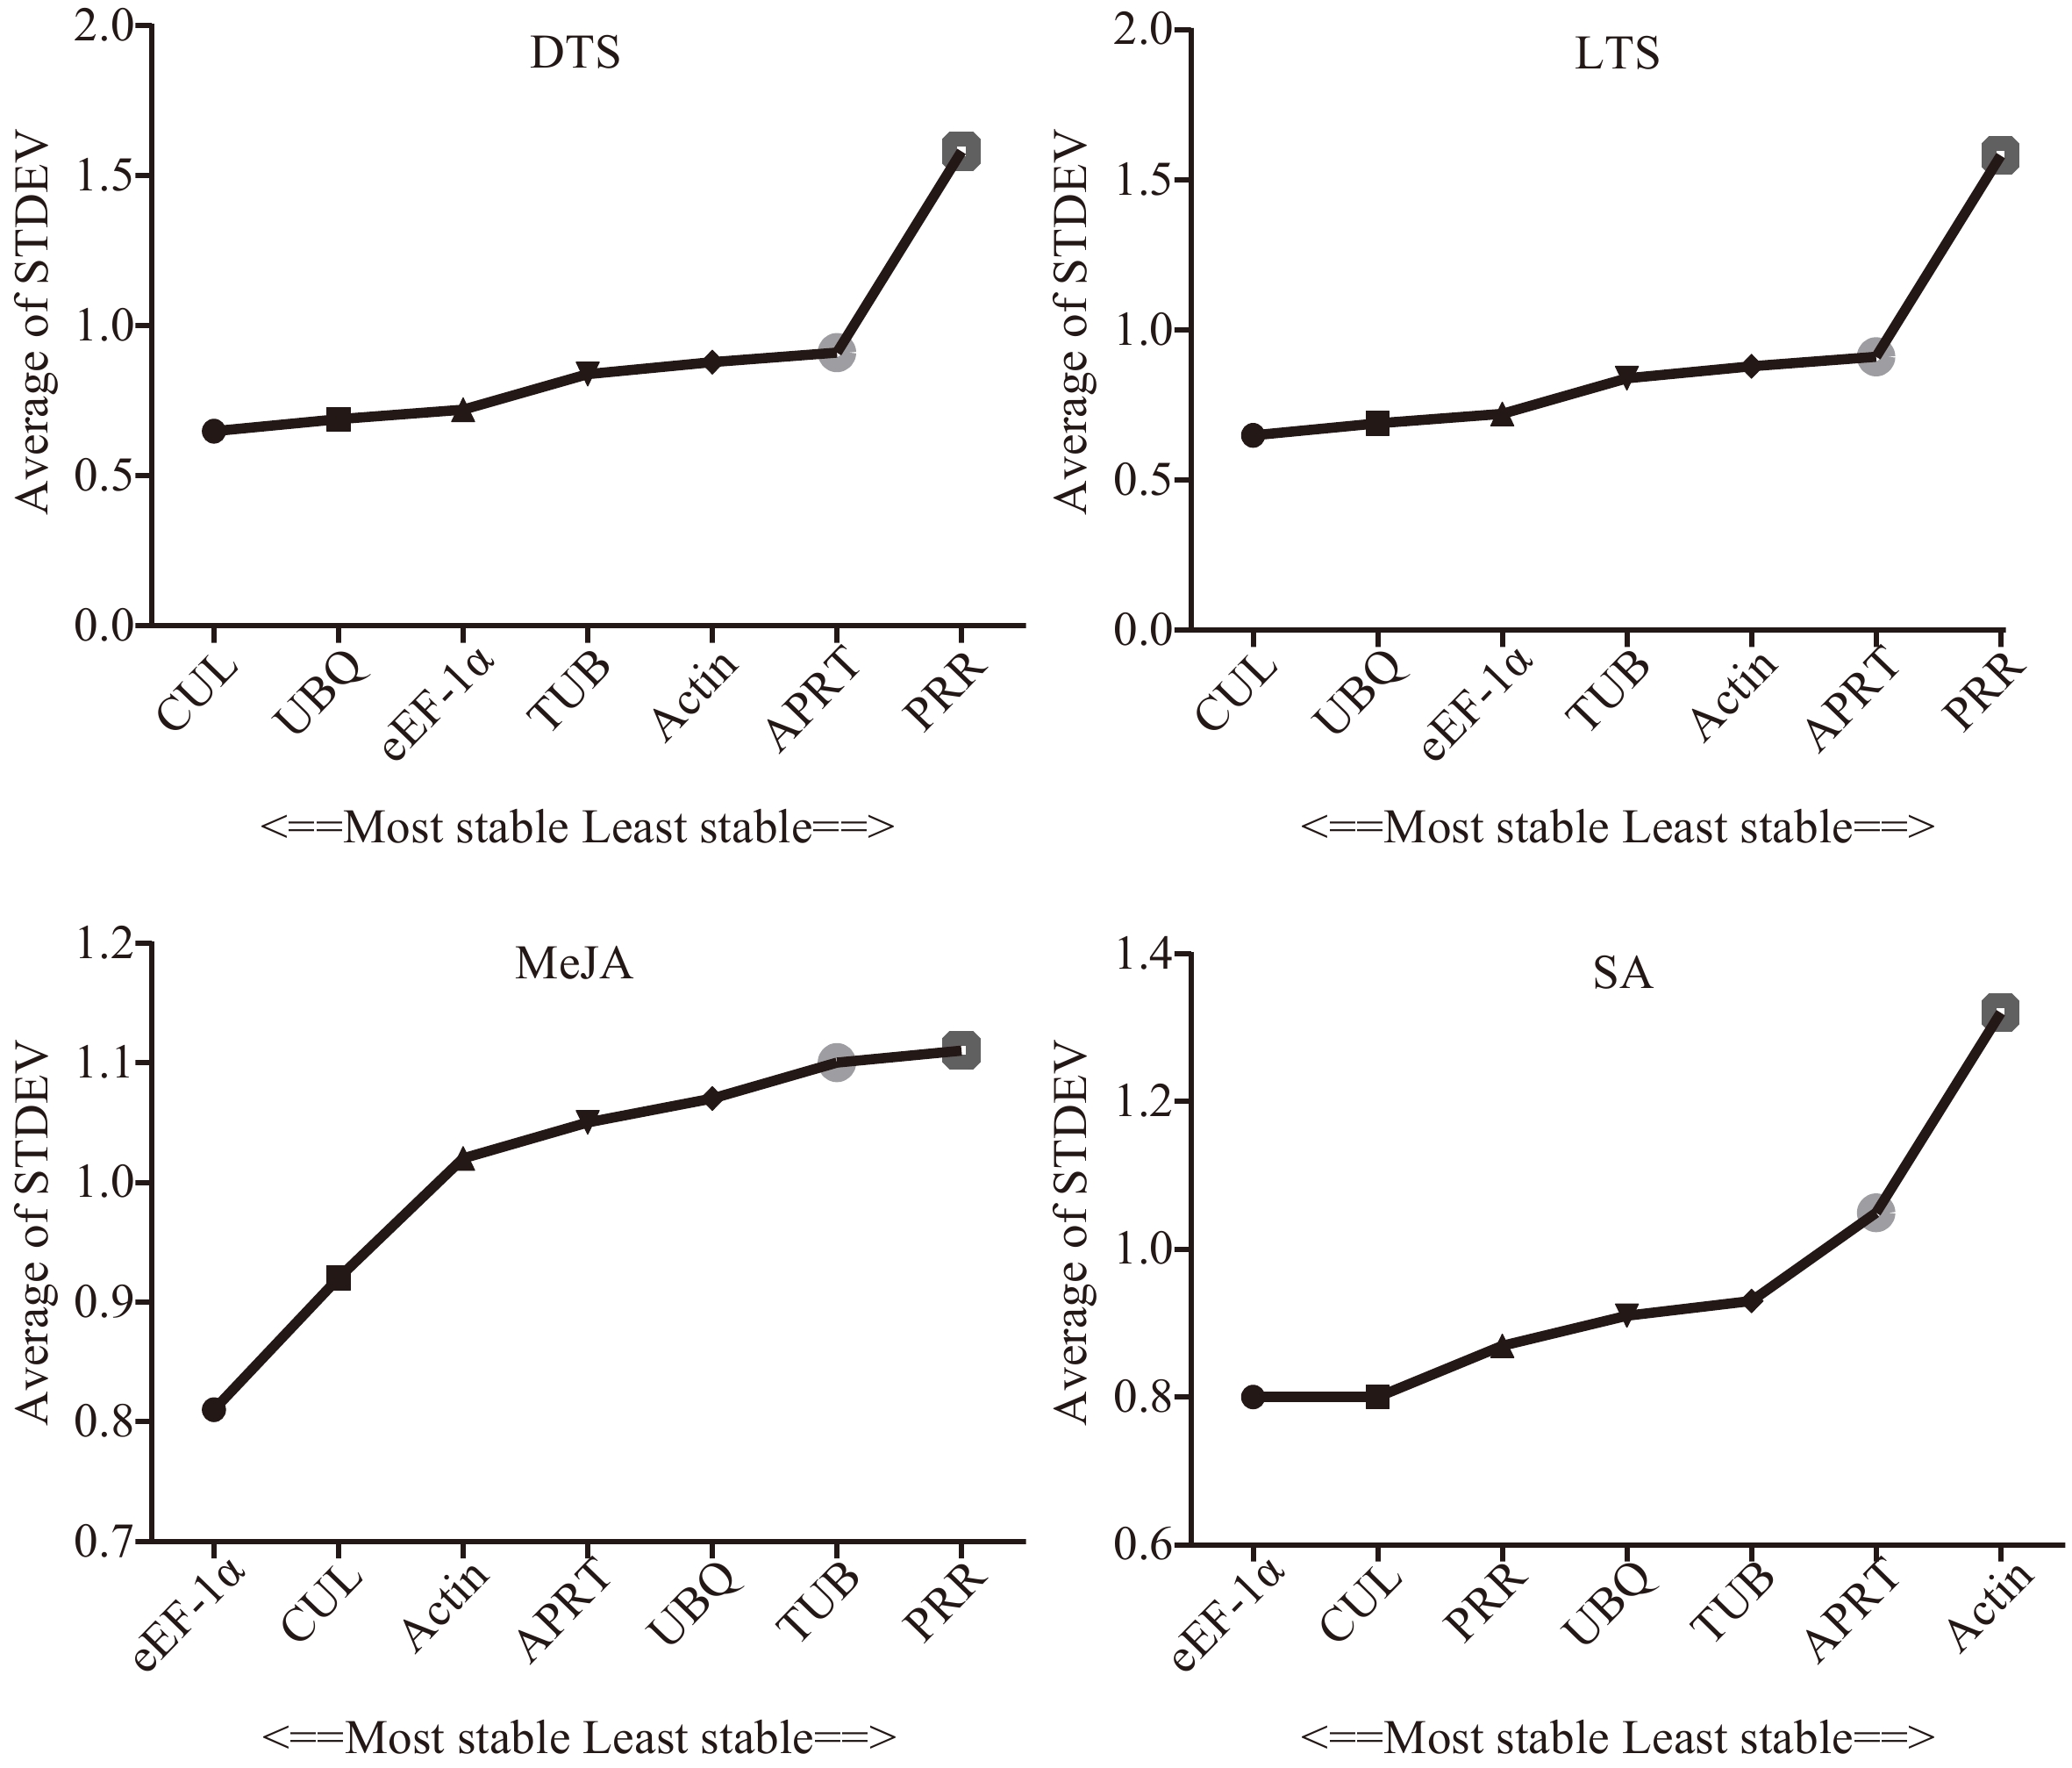
Figure 4.
Stability of the seven candidate internal reference genes by Delta CT. DTS, different G. elegans tissue samples; LTS, G. elegans leaves under low-temperature stress; CTS, both of the DTS and LTS samples. CUL, cullin; eEF-1α, eukaryotic elongation factor 1-alpha; APRT, adenine phosphoribosyl transferase; TUB, β-tubulin; Actin, actin; PRR, pseudo response regulator; UBQ, polyubiquitin.
-
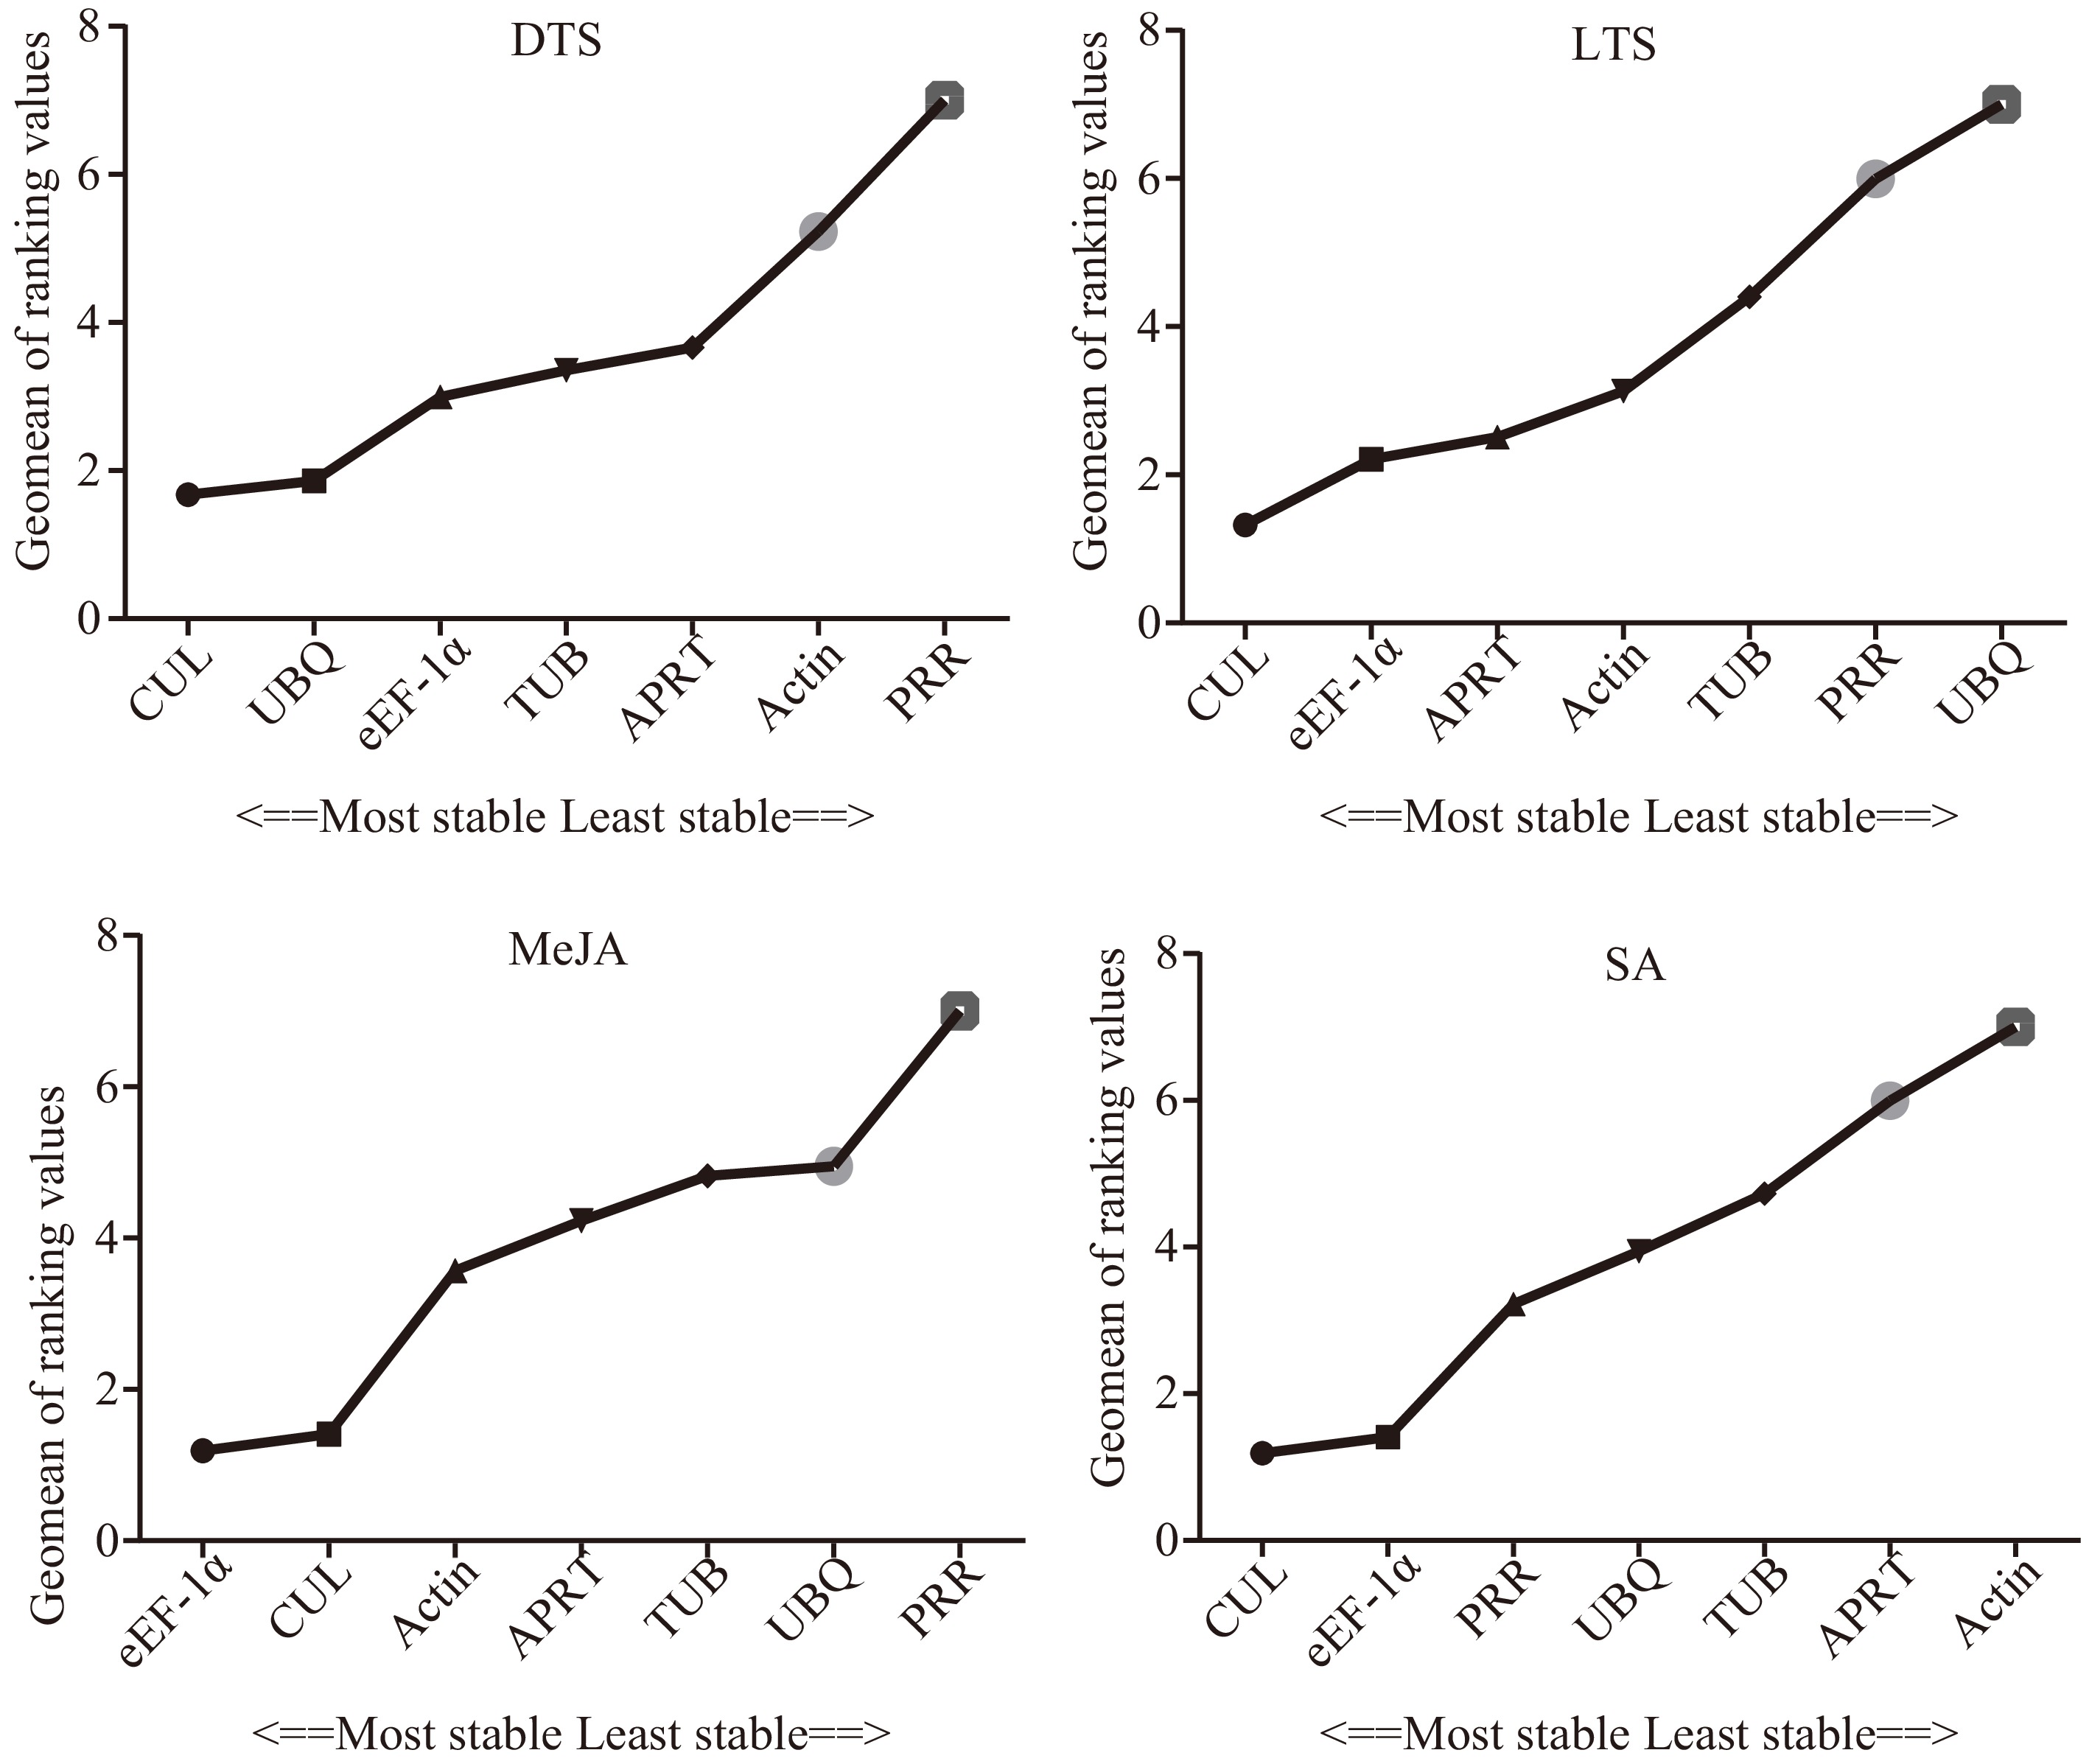
Figure 5.
Comprehensive stability of the seven candidate internal reference genes. DTS, different G. elegans tissue samples; LTS, G. elegans leaves under low-temperature stress; CTS, both of the DTS and LTS samples. CUL, cullin; eEF-1α, eukaryotic elongation factor 1-alpha; APRT, adenine phosphoribosyl transferase; TUB, β-tubulin; Actin, actin; PRR, pseudo response regulator; UBQ, polyubiquitin.
-
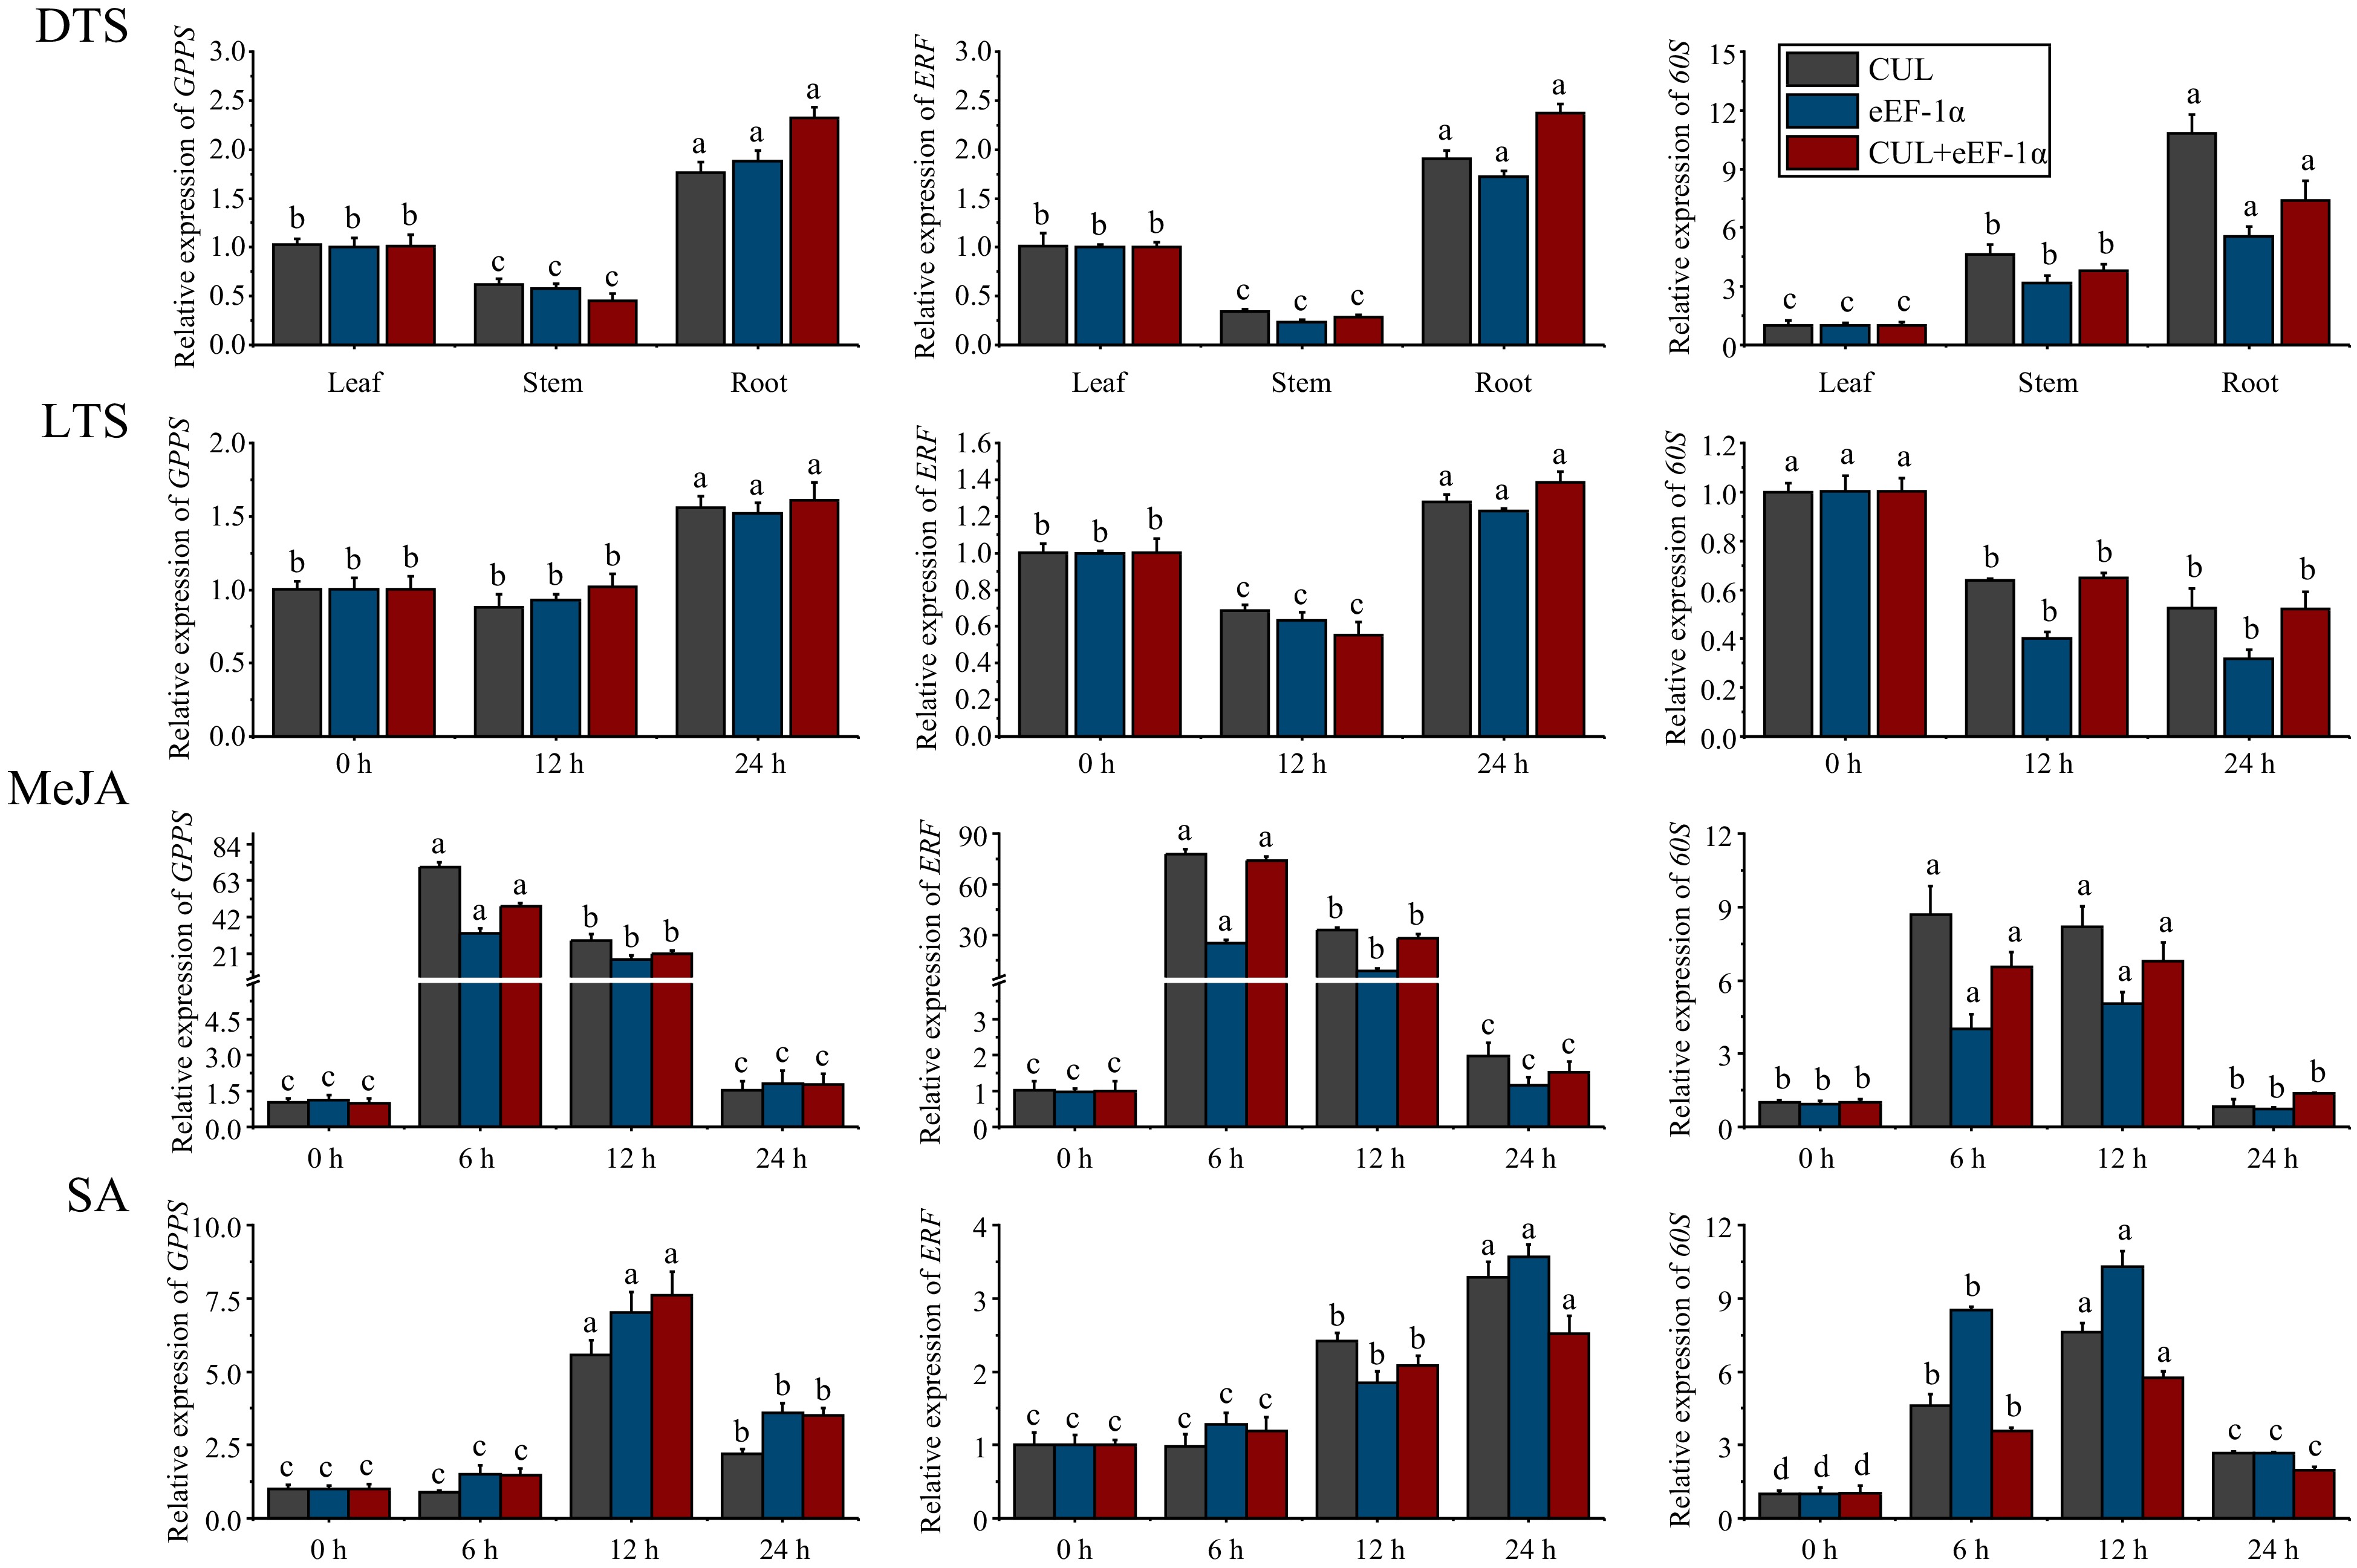
Figure 6.
Expression patterns of GPPS, ERF, and 60S in different tissues (DTS) of G. elegans and at different time points after low temperature (LTS), MeJA, and SA stresses. CUL, cullin; eEF-1α, eukaryotic elongation factor 1-alpha; GPPS, geranyl diphosphate synthase; ERF, ethylene-responsive transcription factor; 60S, 60S ribosomal protein. All data points were means ± standard error (n = 3). Data analysis was conducted using DPS 7.05 software, and Duncan's new multiplex range test was employed to assess the significance of differences. Lowercase letters were utilized to indicate significant distinctions between groups, with each letter corresponding to a unique group. (p-value < 0.05).
-
Gene name Gene description Gene ID Primer name Primer sequence (5'-3') Product length (bp) Actin Actin Ge.c133917 Actin-F TGCGGCGATCATCTACTCCG 127 Actin-R AGCGAGGCTGGAAATCCGAA APRT Adenine phosphoribosyl transferase Ge.c138712 APRT-F AGACAACGGTCCCAAGAAGCA 90 APRT-R ACCATGGGATTGGTCGGTCC CUL Cullin Ge.c140024 CUL-F GTTCTTACAGGCACGACACAA 115 CUL-R CCAAGCACCTTCAGCATCAT eEF-1α Eukaryotic elongation factor 1-alpha Ge.c81268 eEF-1α-F GCGATGTTCCCCATGTCACC 117 eEF-1α-R CGGTTGGAAGCCTCAGGTCAT PRR Pseudo response regulator Ge.c146065 PRR-F ACGCATCAATCACAGCCCAC 210 PRR-R GTACGTGGCTCATACACGGC TUB β-tubulin Ge.c147995 TUB-F AGGTGTCCGCAGACTTGACA 291 TUB-R GCTGCGGCATATTGAAGGCA UBQ Polyubiquitin Ge.c122802 UBQ-F CTCCGTCTCCGTGGTGGATT 80 UBQ-R TGGCCAAACTTCGGTGTAACCT GPPS Geranyl diphosphate synthase Ge.c151190 GPPS-F GTGAGTTTGTTGGTGGTGAGA 93 GPPS-R GGAGATGTTGGTGAGTGTATGTAG ERF Ethylene-responsive transcription factor Ge.c141467 ERF-F AGGAAGTGGTAGAAGACATTATCG 157 ERF-R CTTGAGAGCTGCTTCATCGTAT 60S 60S ribosomal protein Ge.c131257 60S-F CACCTGAGACCTGCTGAATATAAG 84 60S-R AGACAACACGCCACCATAAG Table 1.
Sequences of RT-qPCR primers.
-
Gene Slope (k) Amplification
efficiency (%)Correlation
coefficient (R2)CUL −3.023 1.142 0.999 eEF-1α −3.099 1.102 0.999 APRT −3.013 1.147 0.999 TUB −3.154 1.075 0.996 Actin −2.992 1.159 0.993 PRR −3.117 1.093 0.996 UBQ −3.314 1.003 0.999 Table 2.
Primer amplification parameters for the seven candidate internal reference genes in Gelsemium elegans.
-
Group Gene geo
meanAR
meanMin Max SD Stability
rankDTS APRT 24.89 24.89 23.66 25.79 0.56 1 TUB 24.14 24.15 23.00 25.54 0.73 2 eEF-1α 20.25 20.28 18.40 22.10 0.79 3 CUL 23.75 23.77 22.44 25.76 0.80 4 Actin 23.63 23.65 22.44 25.68 0.84 5 UBQ 18.80 18.84 17.13 20.97 0.99 6 PRR 23.15 23.25 20.90 26.89 1.98 7 LTS CUL 24.38 24.39 23.95 25.55 0.27 1 eEF-1α 20.99 20.99 20.53 21.98 0.32 2 TUB 26.15 26.16 25.35 27.28 0.34 3 Actin 26.46 26.46 26.01 27.60 0.36 4 APRT 26.17 26.17 25.67 27.56 0.41 5 PRR 24.32 24.32 23.59 25.18 0.42 6 UBQ 18.03 18.06 16.19 20.01 0.82 7 MeJA CUL 24.13 24.13 23.28 24.99 0.31 1 eEF-1α 22.34 22.35 21.54 23.08 0.41 2 TUB 25.01 25.02 24.00 26.55 0.58 3 UBQ 18.03 18.04 17.02 19.30 0.63 4 APRT 25.35 25.36 23.97 27.00 0.74 5 Actin 24.38 24.39 23.37 25.94 0.77 6 PRR 21.88 21.89 20.14 23.13 0.79 7 SA CUL 26.54 26.54 25.95 27.46 0.35 1 eEF-1α 22.21 22.22 20.98 23.00 0.49 2 PRR 25.59 25.60 24.29 27.28 0.67 3 UBQ 19.42 19.44 18.21 20.97 0.70 4 TUB 27.69 27.72 25.58 29.39 0.79 5 APRT 27.50 27.52 25.11 29.74 0.83 6 Actin 27.73 27.75 26.12 29.28 0.84 7 Notes: geo mean, geometric mean; AR mean, average mean; Min, minimum mean; Max, max mean; SD, standard deviation. DTS, different G. elegans tissue samples; LTS, G. elegans leaves under low temperature stress; CUL, cullin; eEF-1α, eukaryotic elongation factor 1-alpha; APRT, adenine phosphoribosyl transferase; TUB, β-tubulin; Actin, actin; PRR, pseudo response regulator; UBQ, polyubiquitin. Table 3.
Expression stability of the seven candidate internal reference genes by BestKeeper.
Figures
(6)
Tables
(3)