-
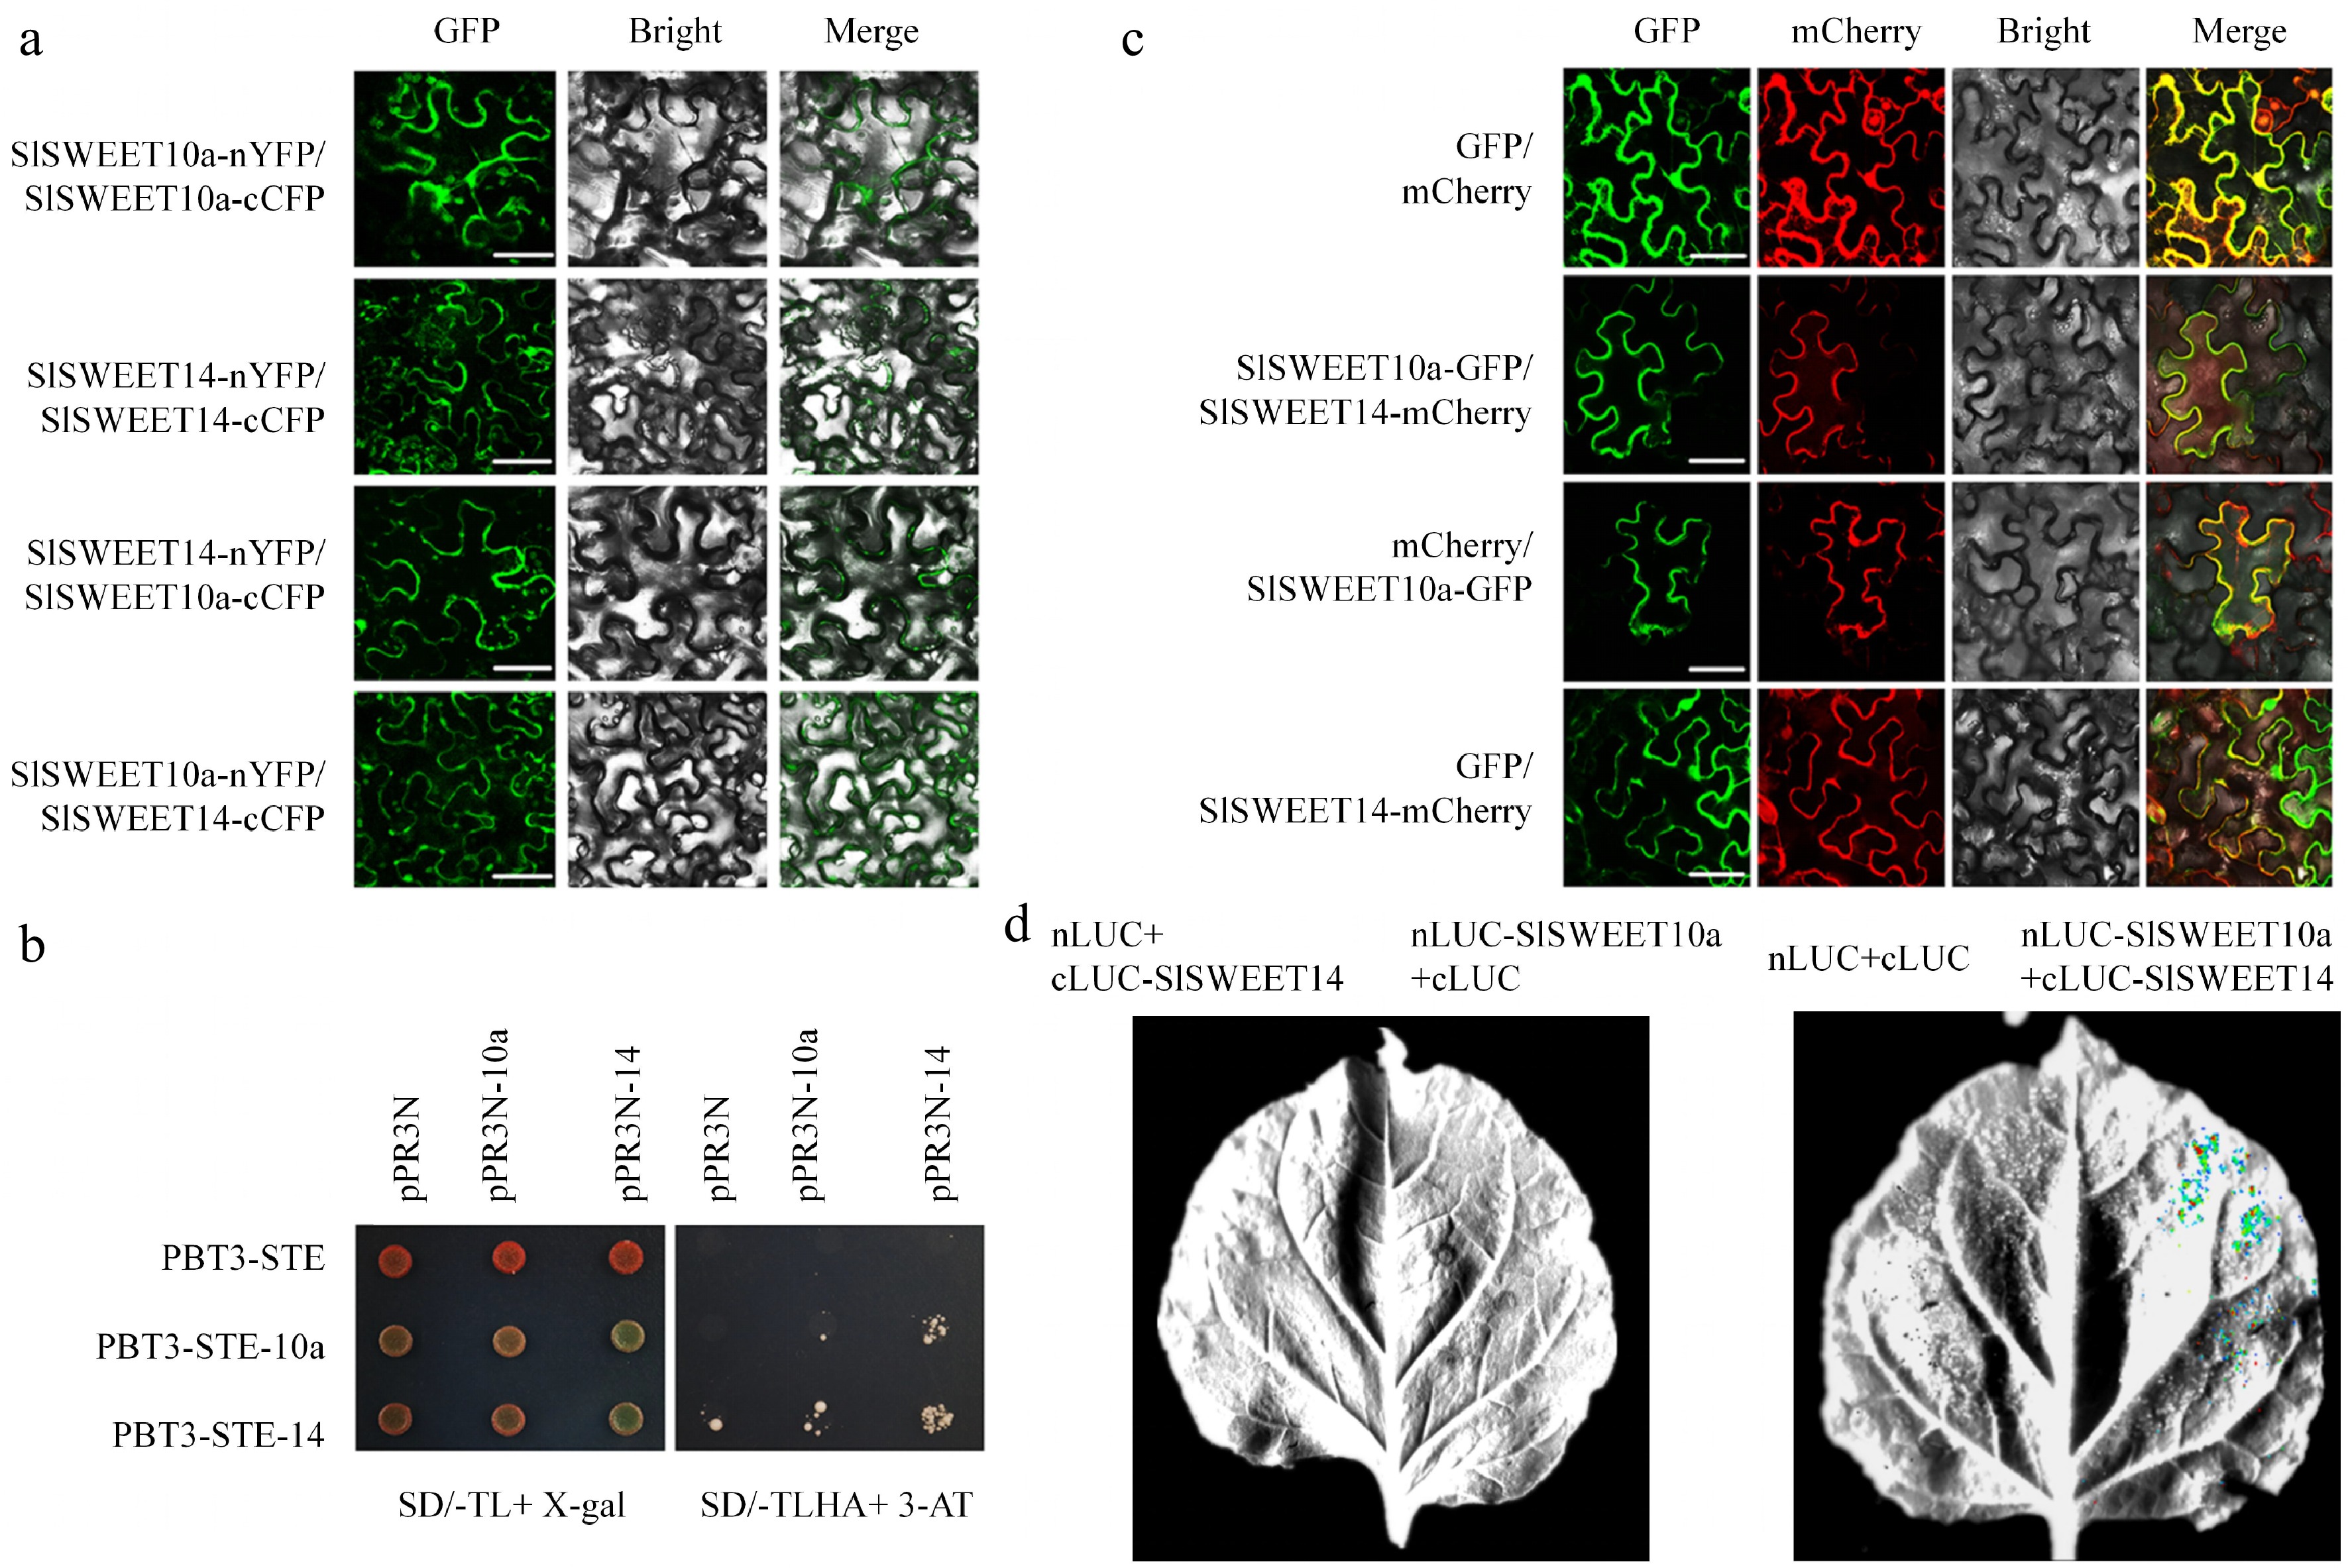
Figure 1.
SlSWEET10a interacts with SlSWEET14. (a) Interaction of SlSWEET10a and SlSWEET14 was verified by bimolecular fluorescence complementation (BiFC). Leaves of N. benthamiana were co-infiltrated with fusion proteins, and the green fluorescence signals were detected 2 d later with a confocal microscope. (b) Interaction of SlSWEET10a and SlSWEET14 was revealed by split-ubiquitin yeast two-hybrid. Histidine (His) and adenine (Ade) reporter genes were used for testing the interaction; X-gal (100 μg/mL) staining assay (left panel) and 3-amino-1,2,4-triazole (10 mM) (right panel) were also used. pPR3N with pBT3-STE, pPR3N-SlSWEET10a with pBT3-STE, pPR3N-SlSWEET14 with pBT3-STE, pPR3N with pBT3-SlSWEET10a, and pPR3N with pBT3-SlSWEET14 were used as negative controls. The experiment was performed at least three times. SD-TL, SD/-Trp/-Leu; SD-TLHA, SD/-Trp/-Leu/-His/-Ade. (c) SlSWEET10a and SlSWEET14 were co-localised in N. benthamiana leaves. The fusion proteins were co-expressed in N. benthamiana leaves; the combinations of SlSWEET10a-GFP with empty vector carrying mCherry reporter gene, and of SlSWEET14-mCherry with empty vector carrying GFP reporter gene were used as negative controls. (d) Firefly luciferase complementation imaging assays of SlSWEET10a and SlSWEET14 in N. benthamiana leaves.
-
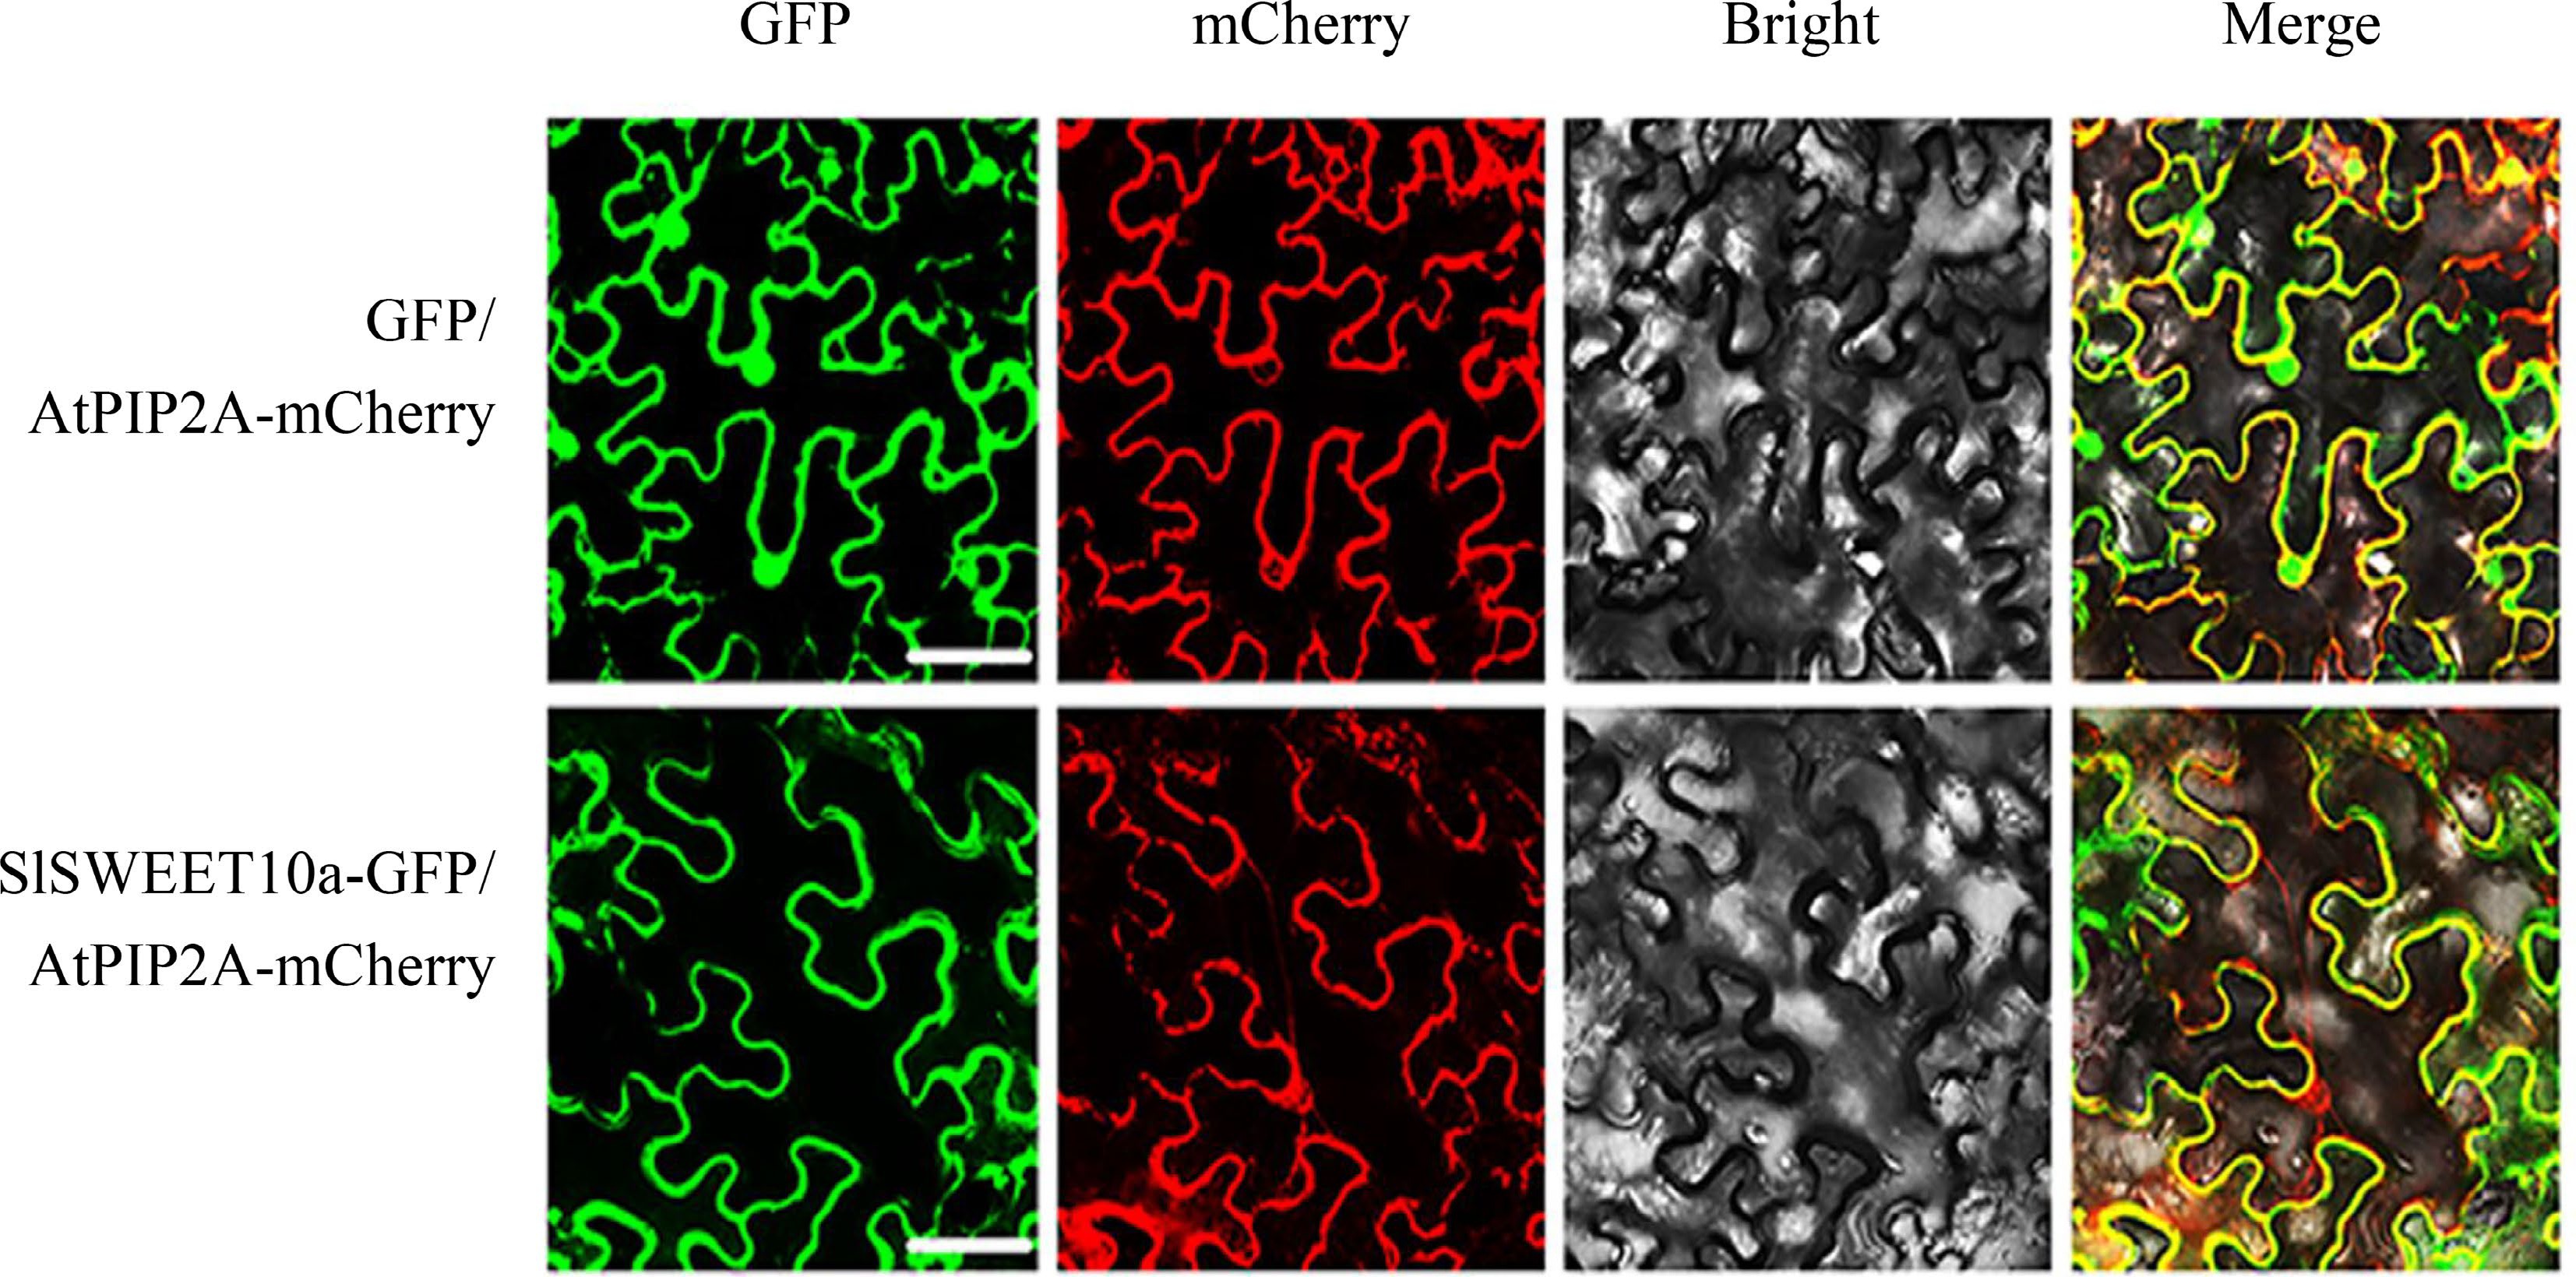
Figure 2.
The subcellular localization of SlSWEET10a. An mCherry-labelled plasma membrane protein, AtPIP2A, was used as positive control. Scale bars correspond to 25 μm. These experiments were performed at least three times, representative results are shown.
-
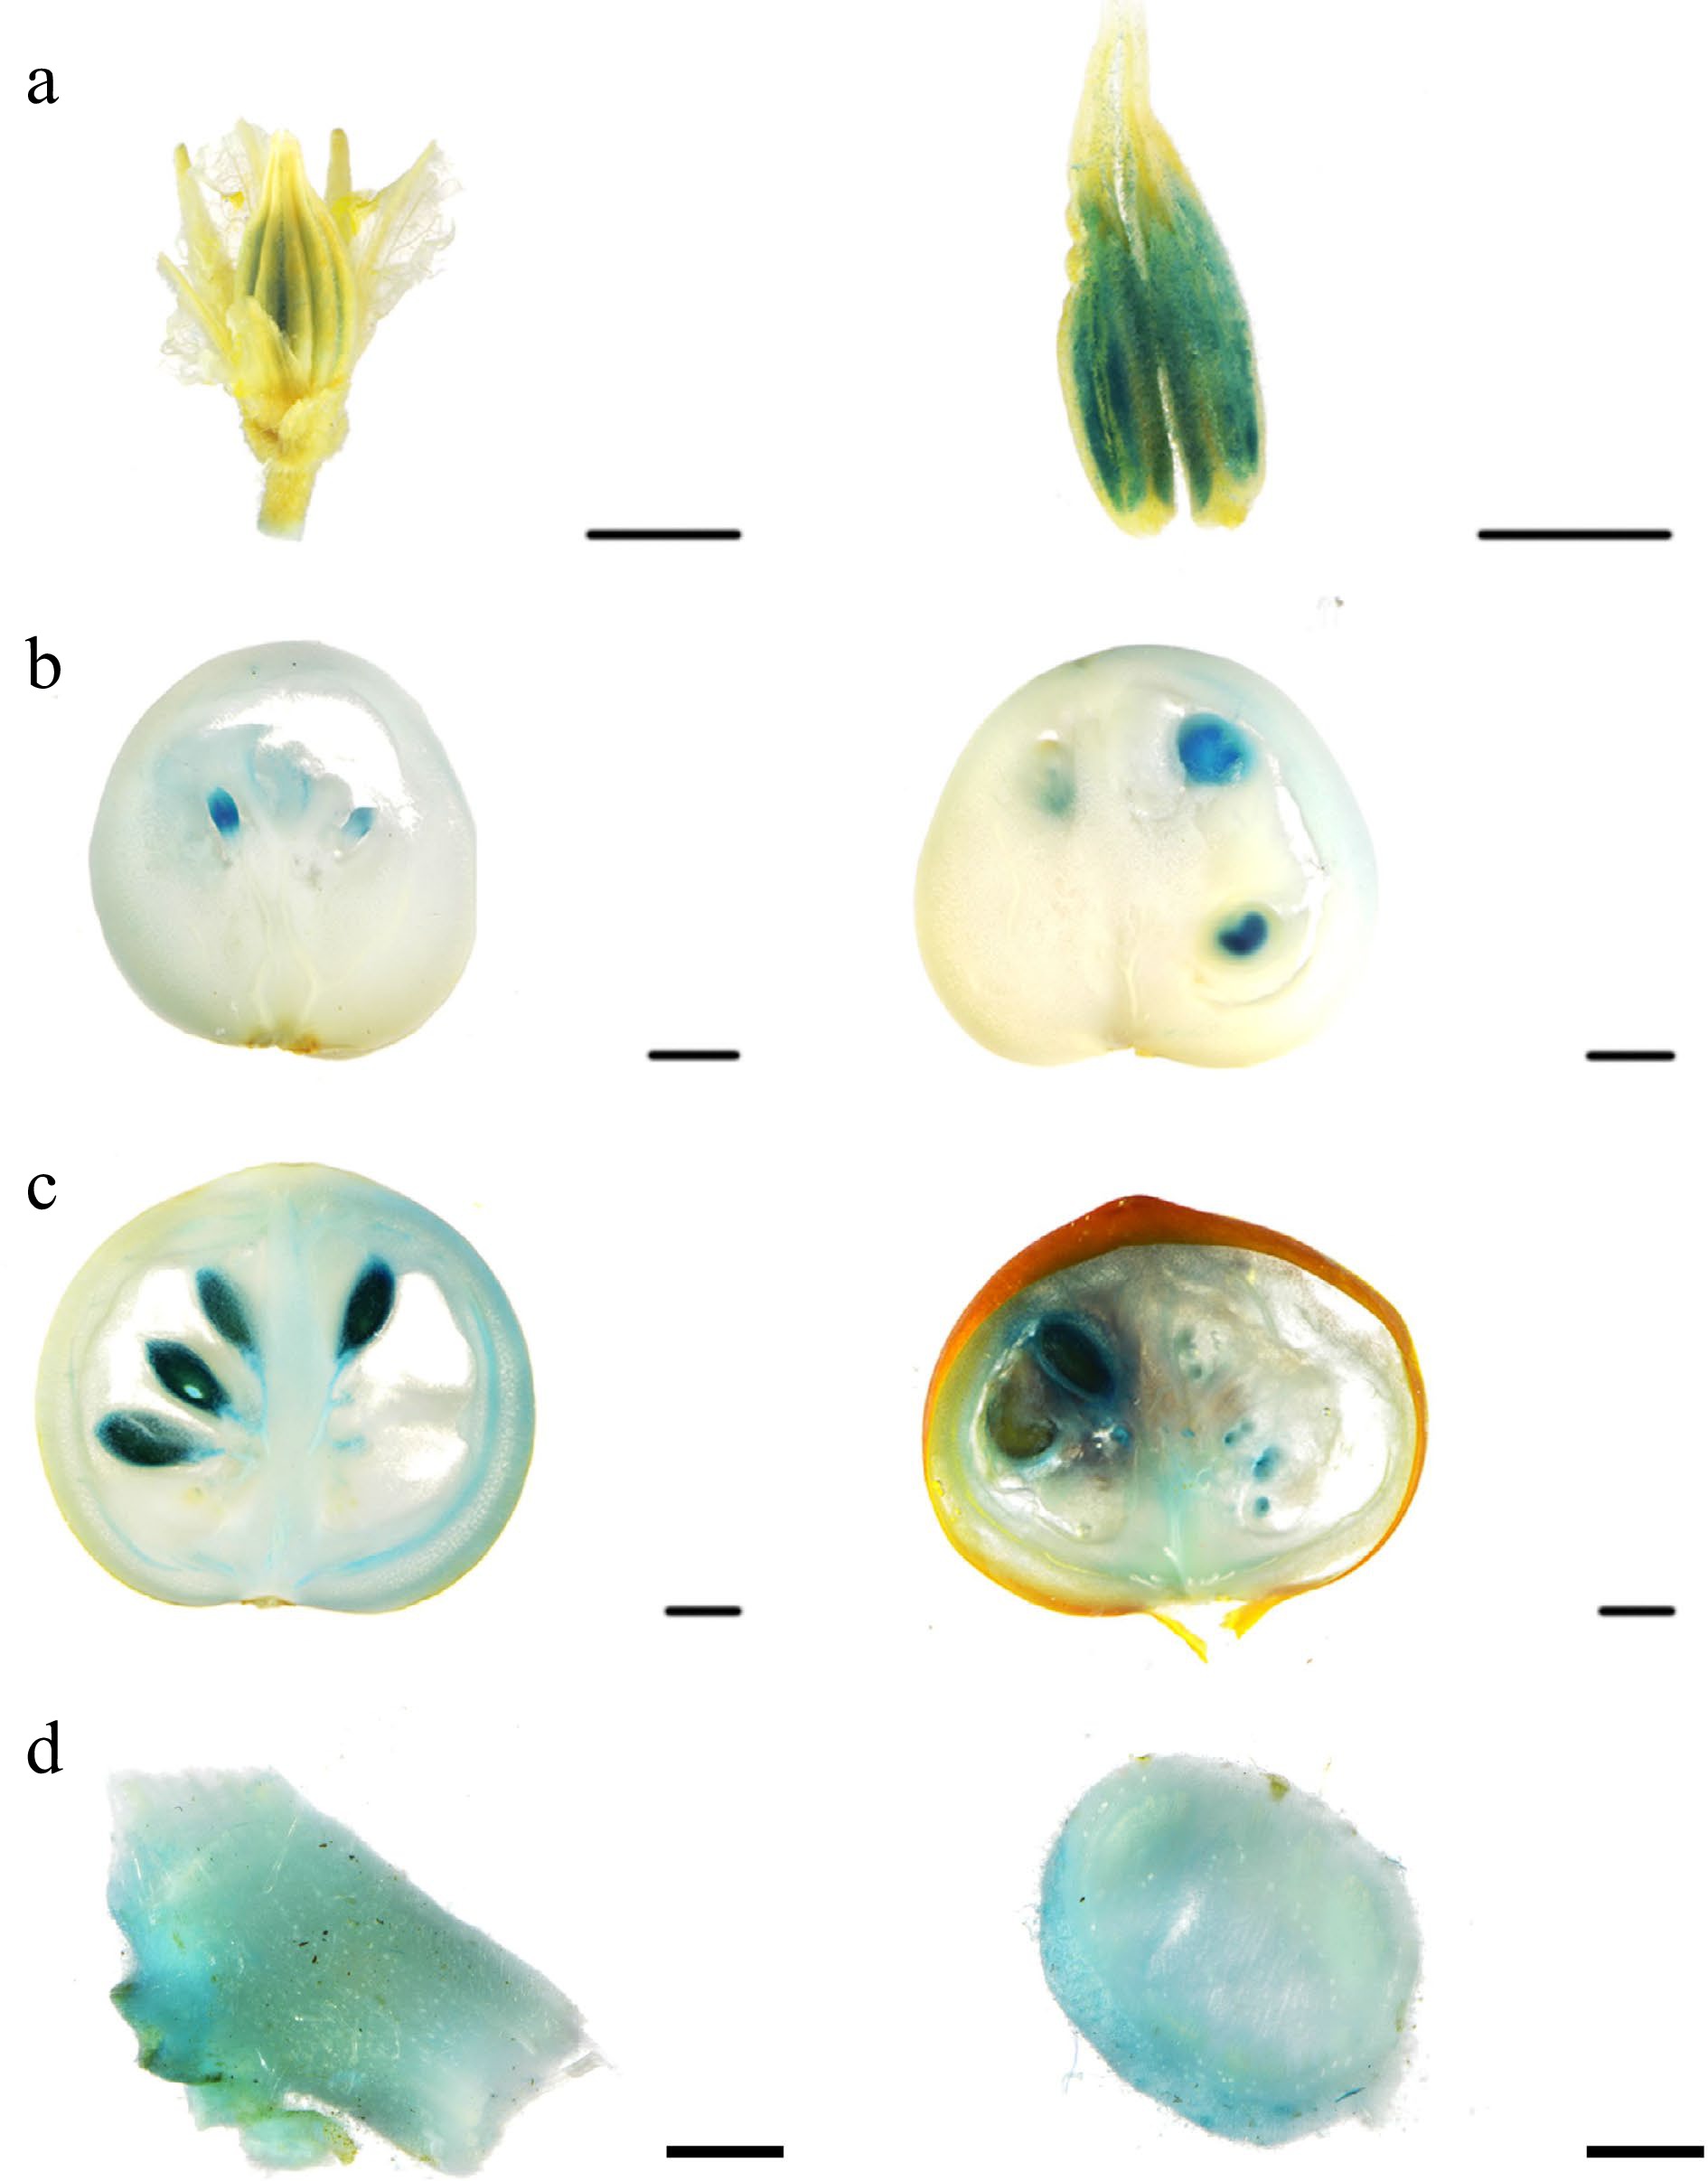
Figure 3.
Spatiotemporal expression analysis of SlSWEET10a. (a) Histochemical analysis of pSlSWEET10a: GUS activity in flower. (b) Fruits of expanding period, (c) fruits of mature green stage and red ripe stage, and (d) stem. Scales bars = 2,000 μm.
-
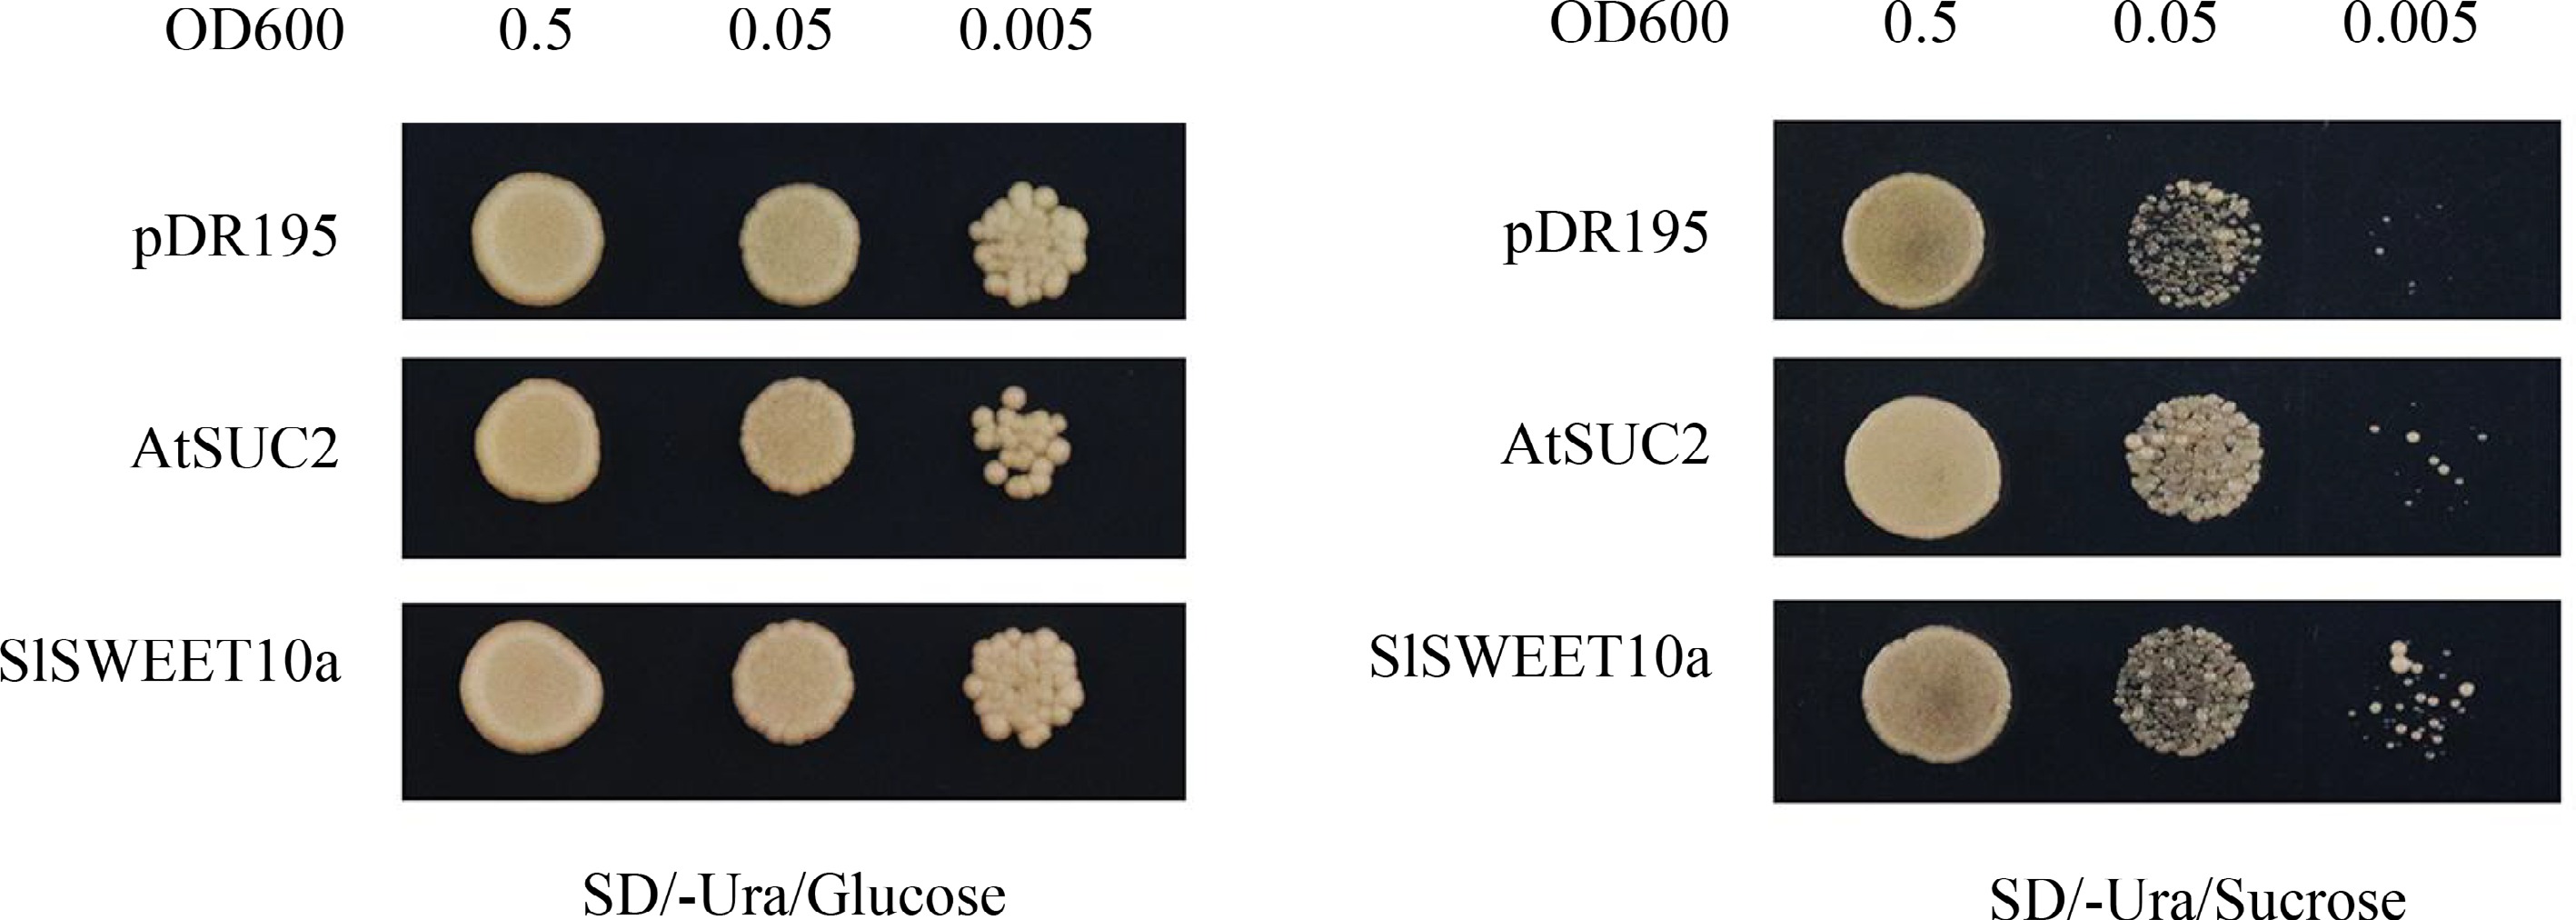
Figure 4.
Sucrose transport activity of SlSWEET10a in yeast. Growth status of SUSY7/ura3 expressing SlSWEET10a. Yeast cells were cultured on SD/-Ura medium supplemented with 2% glucose or 2% sucrose. Yeast cells expressing AtSUC2 and pDR195 empty vector were used as a positive and negative control, respectively. Yeast cells of SUSY7/ura3 were grown at 30 °C for 4 d.
-
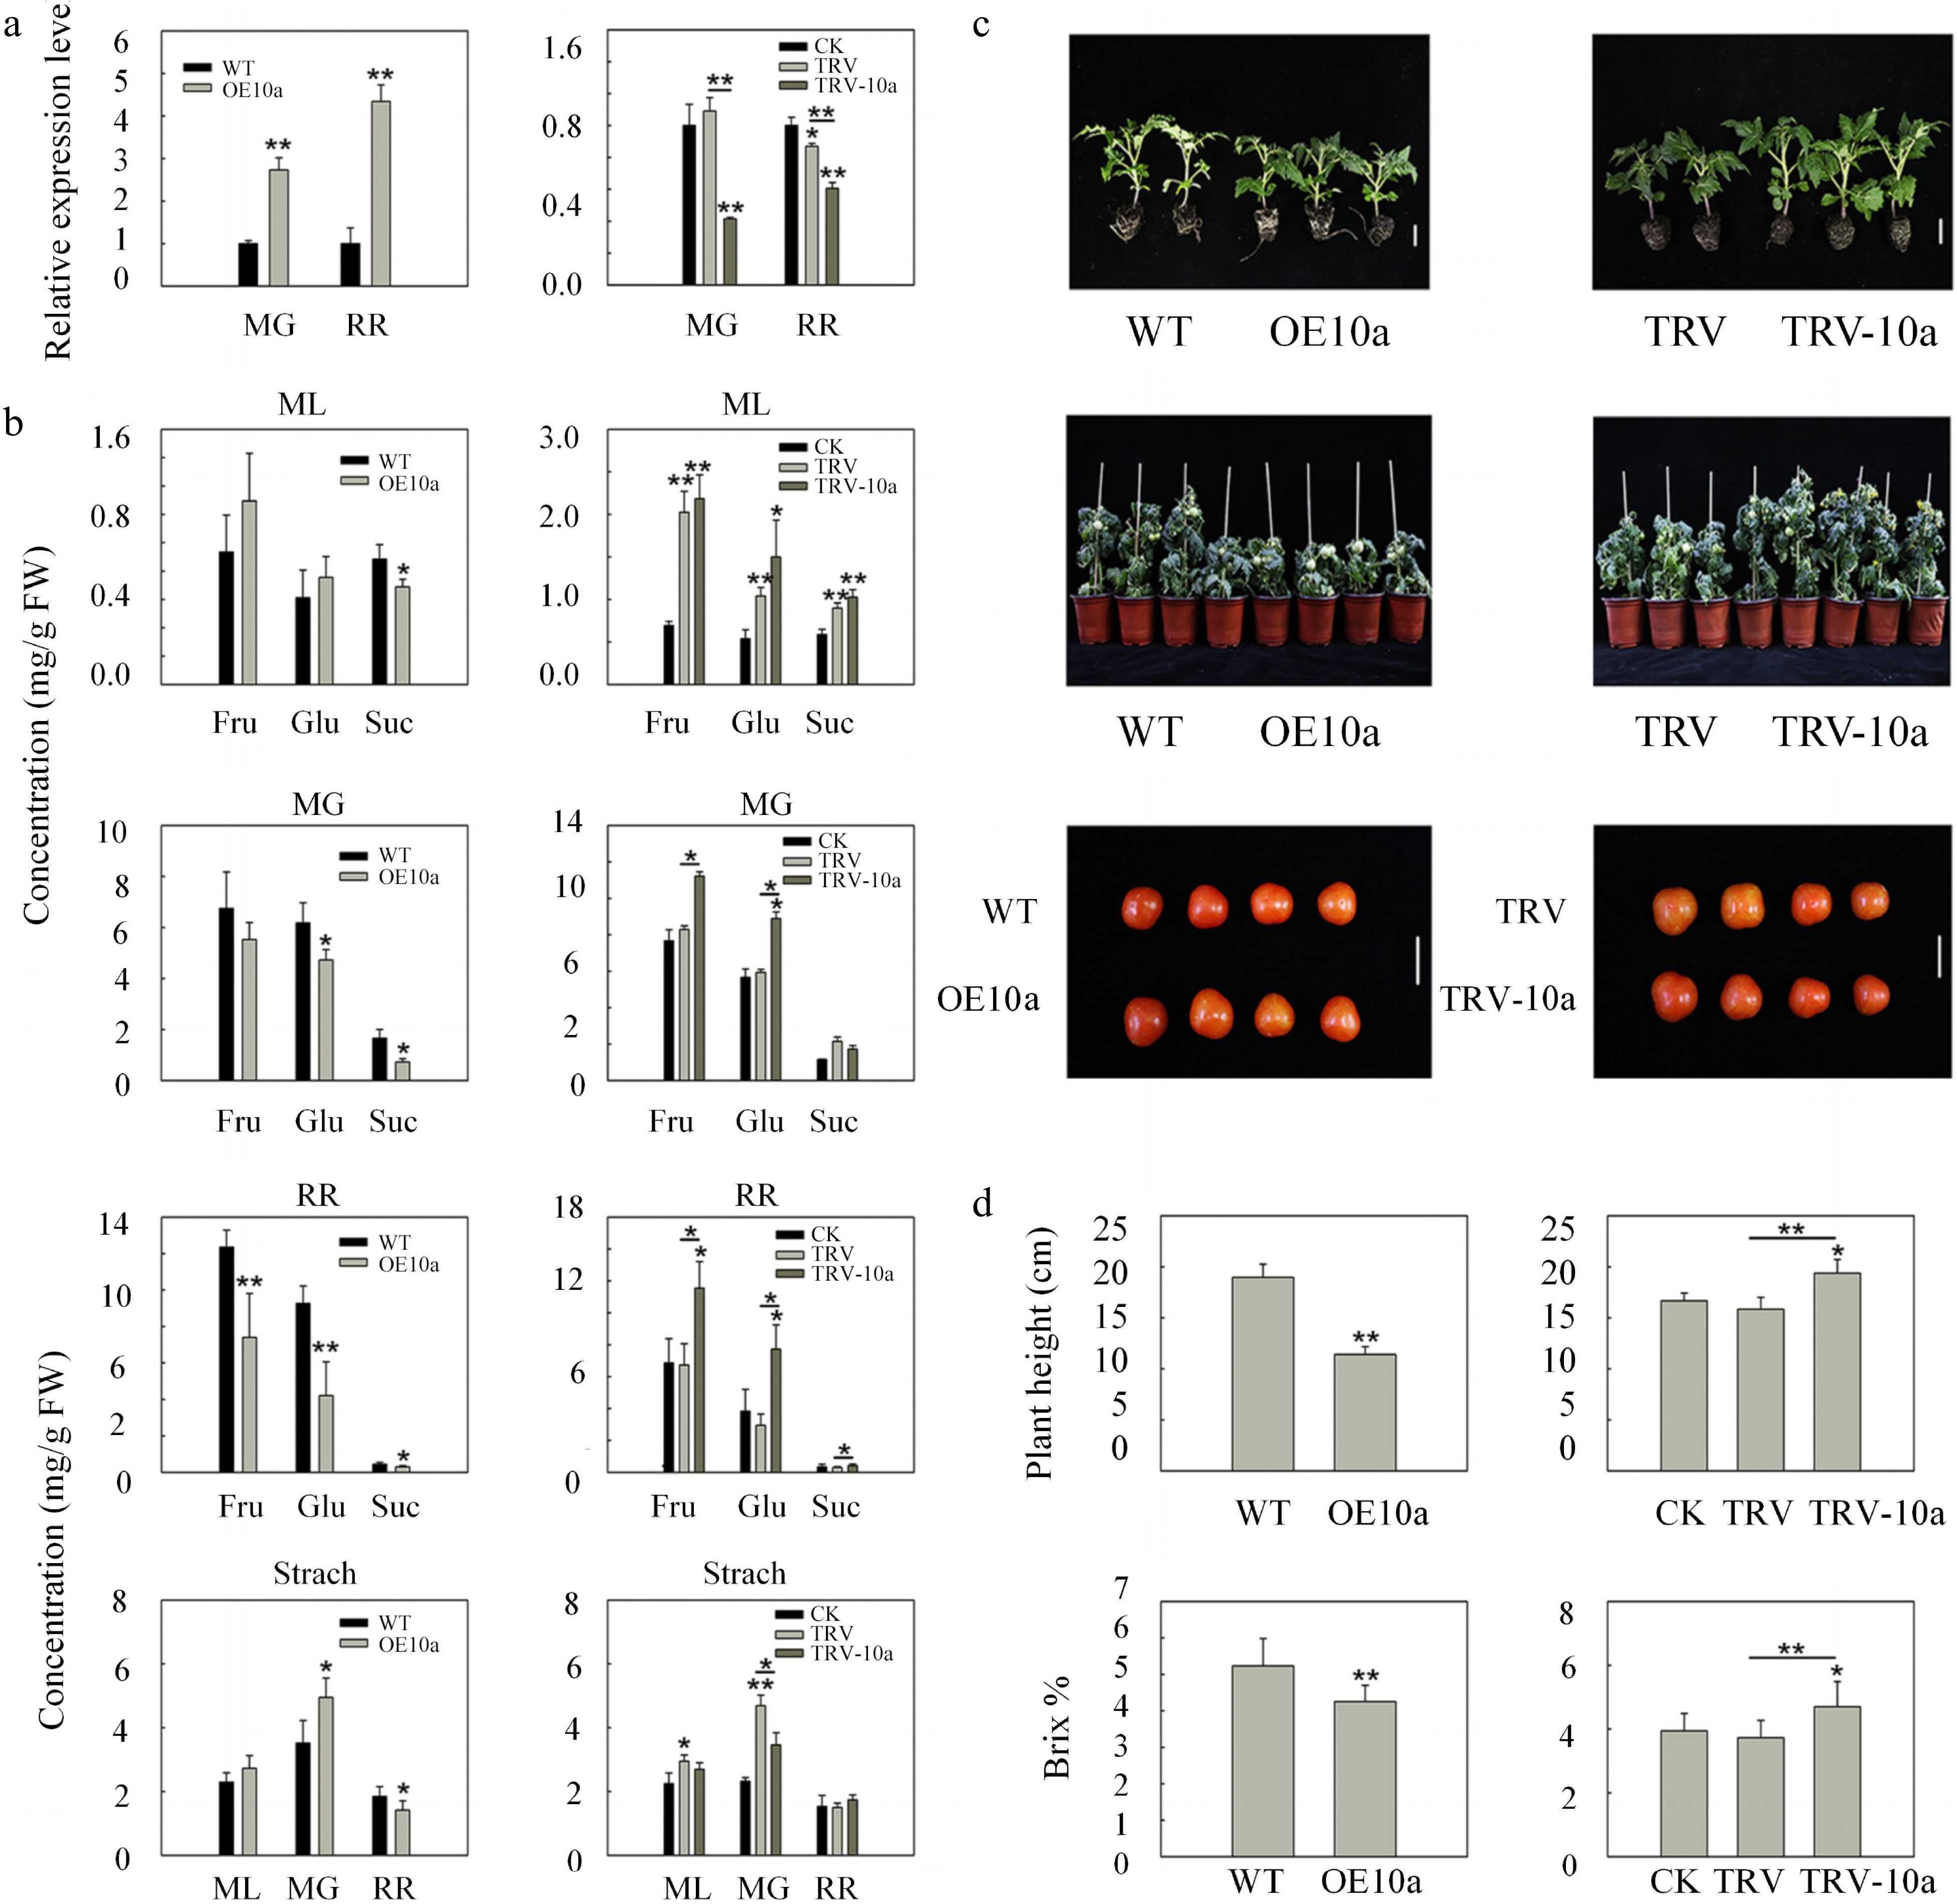
Figure 5.
Sugar concentrations and morphology phenotype as well as phenotypic parameters in SlSWEET10a overexpression lines and silencing lines. (a) The relative expression levels of SlSWEET10a in wild type (WT), SlSWEET10a overexpression (OE10a), control (CK, only injected with infiltration buffers), non-silenced (TRV), and silenced SlSWEET10a (TRV-10a) fruits at the mature green stage (MG) and red ripe stage (RR), respectively. The expression level of WT and CK was set to 1, respectively. The ACTIN was used as internal control. Data are mean values ± SD of at least three biological replicates. (b) Fructose (Fru), glucose (Glu), sucrose (Suc), and starch concentrations in mature leaves (ML), mature green fruits (MG), and red ripe fruits (RR) in different lines. FW, fresh weight. Data represent the mean values ± SD of at least five biological replicates. (c) Plant architecture of the SlSWEET10a (OE10a) lines and SlSWEET10a silencing (TRV-10a) lines about 30 and 80 d after sowing the seeds, respectively, and fruits at the stage of red ripen fruits. Scale bars = 2 cm. (d) Plant height (n ≥ 15) about 90 d after sowing the seeds and soluble solid content (indicated by brix %) of fruits (n ≥ 20) at the red ripe stage in OE10a lines and TRV-10a lines. Data represent mean values ± SD. * p < 0.05, ** p < 0.01 according to Student's t test.
-
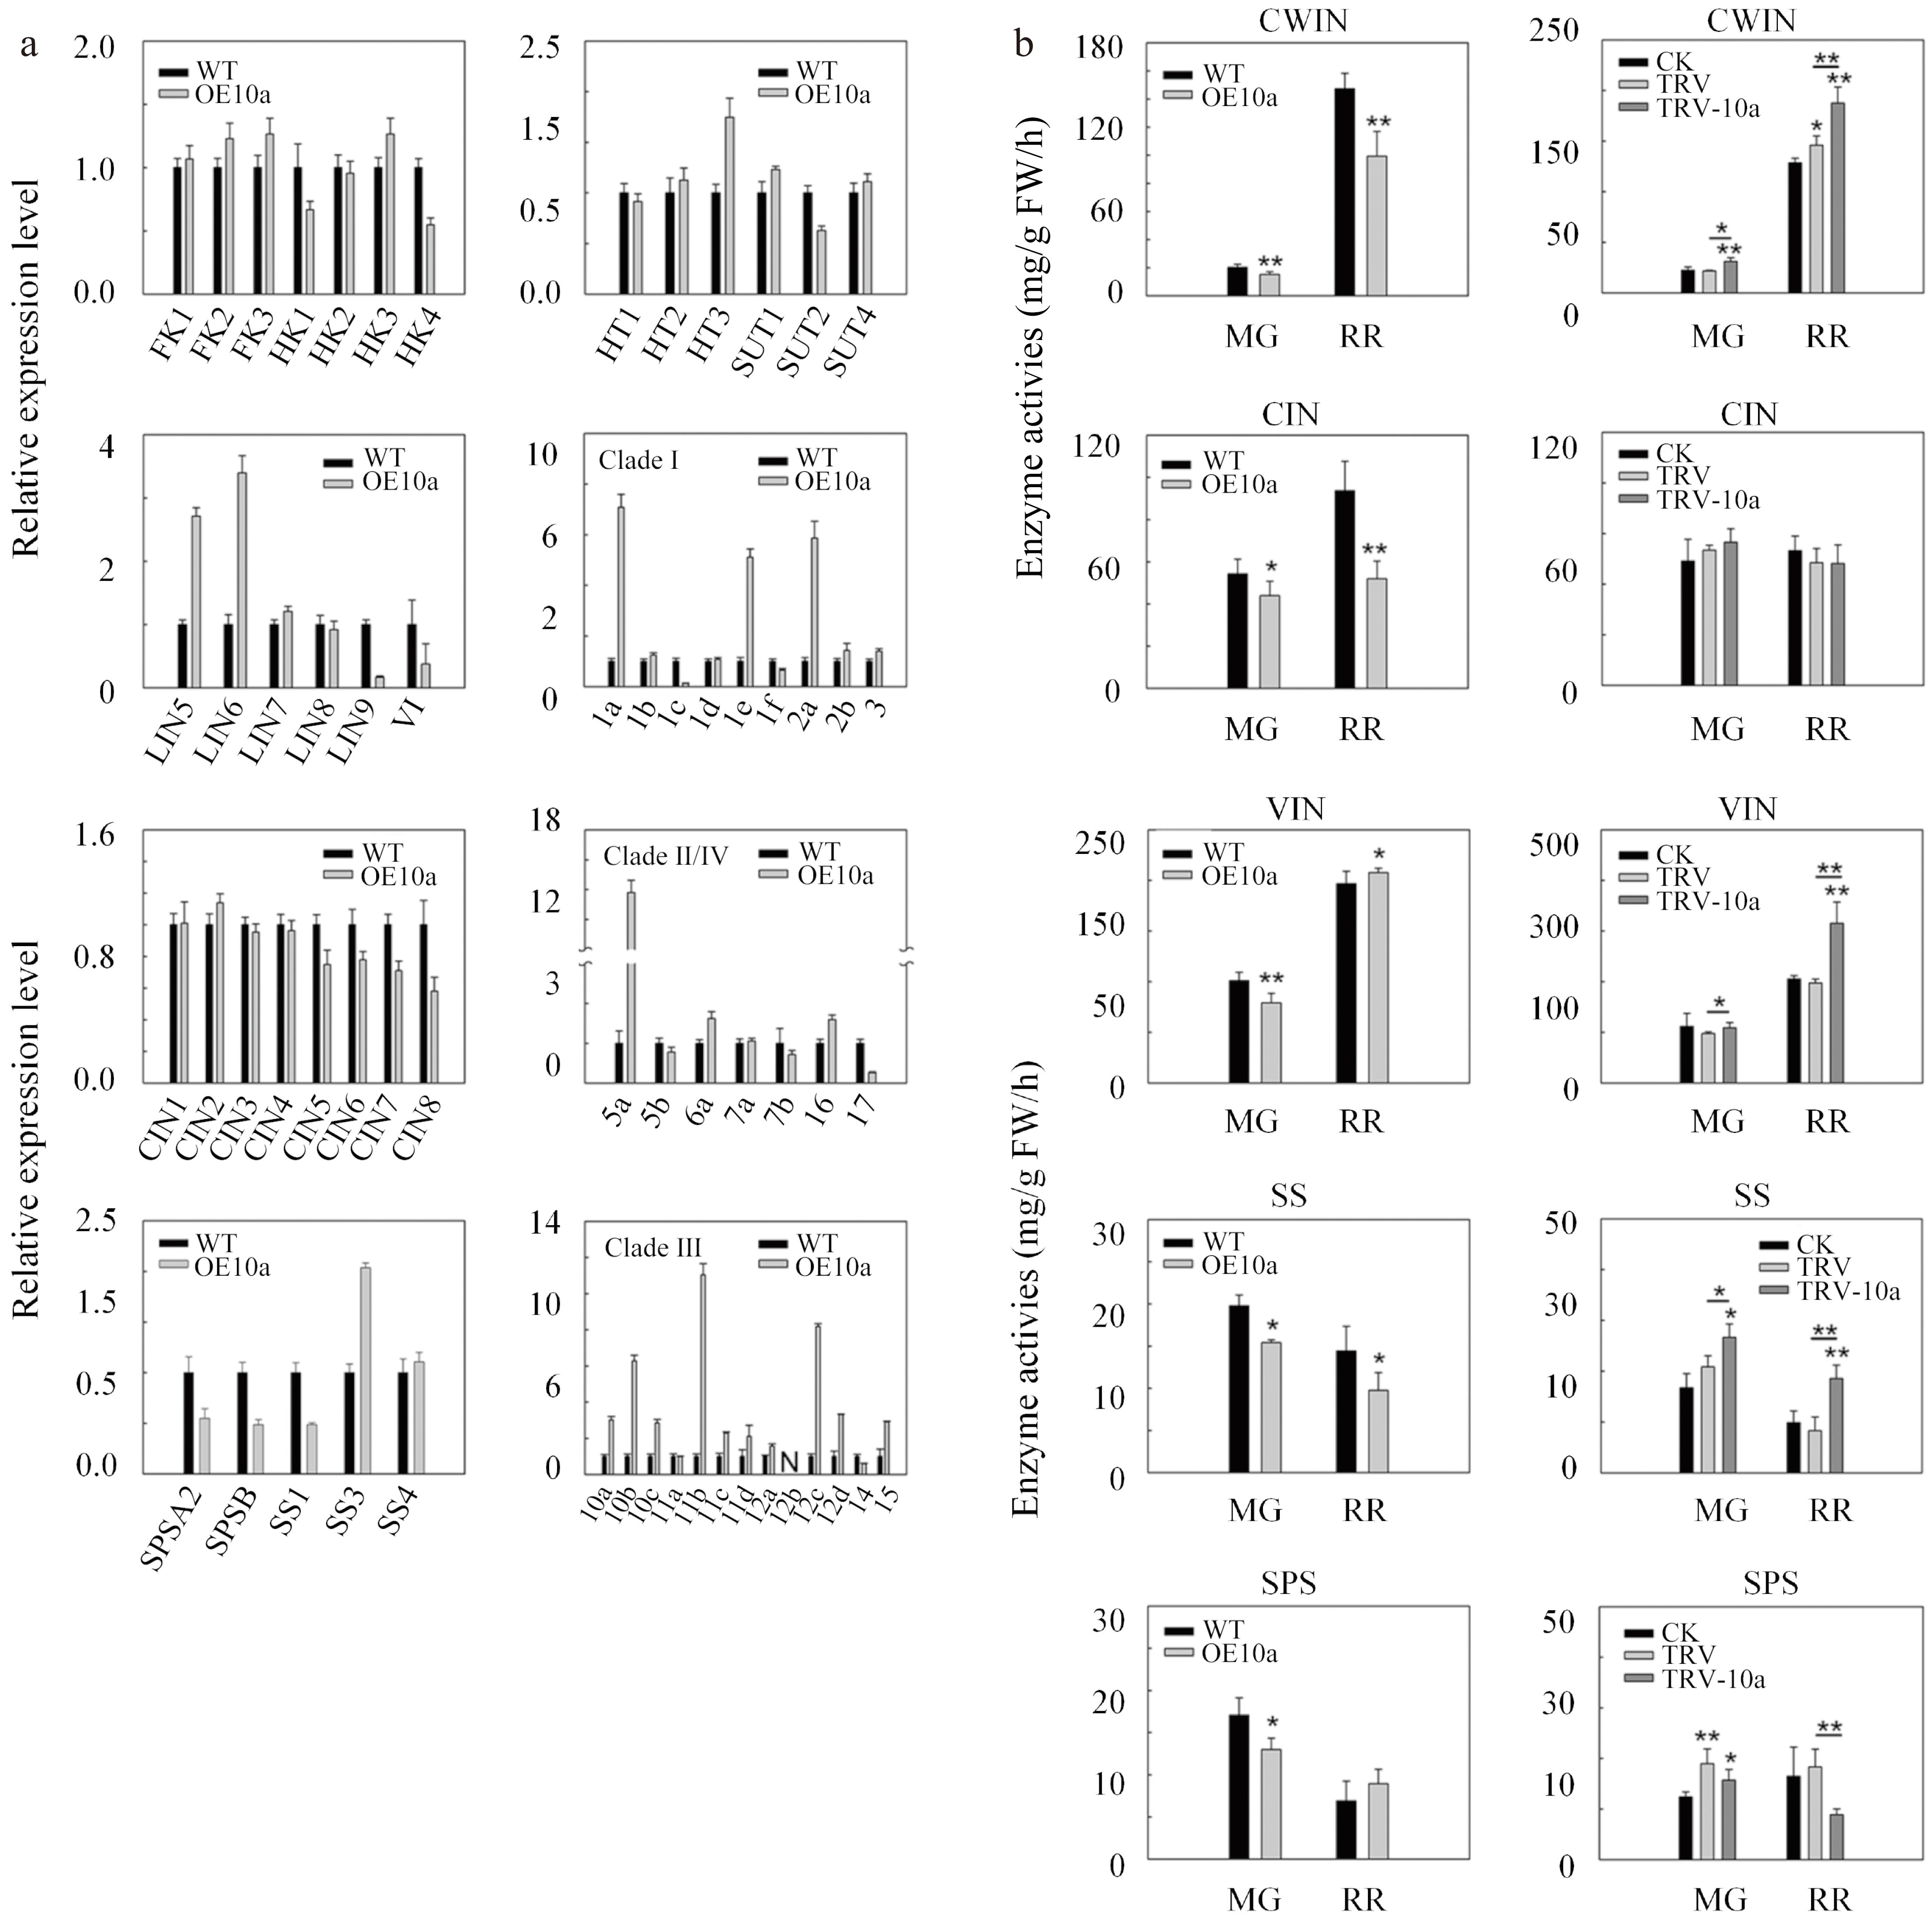
Figure 6.
Relative expression levels of genes associated with sucrose metabolism in mature green fruits and assays of enzymes in fruits for SlSWEET10a. (a) Transcript levels of sucrose metabolism genes in OE10a fruits at the mature green stage. FK, fructokinase; HK, hexokinase; SPS, sucrose phosphate synthase; SS, sucrose synthase; LIN, cell wall invertase; VI, vacuolar invertase; CIN, cytoplasmic invertase; HT, hexose transporter; SUT, sucrose transporter; 1a-17, Sugar will eventually be exported transporters (SWEETs). The expression data of WT was set to 1. The ACTIN gene was used as internal control. (b) Enzyme activity assay in mature green fruits (MG) and red ripe fruits (RR) in OE10a and TRV-10a lines. CWIN, cell wall invertase; CIN, cytoplasmic invertase; VIN, vacuolar invertase; SS, sucrose synthase; SPS, sucrose phosphate synthase.
Figures
(6)
Tables
(0)