-
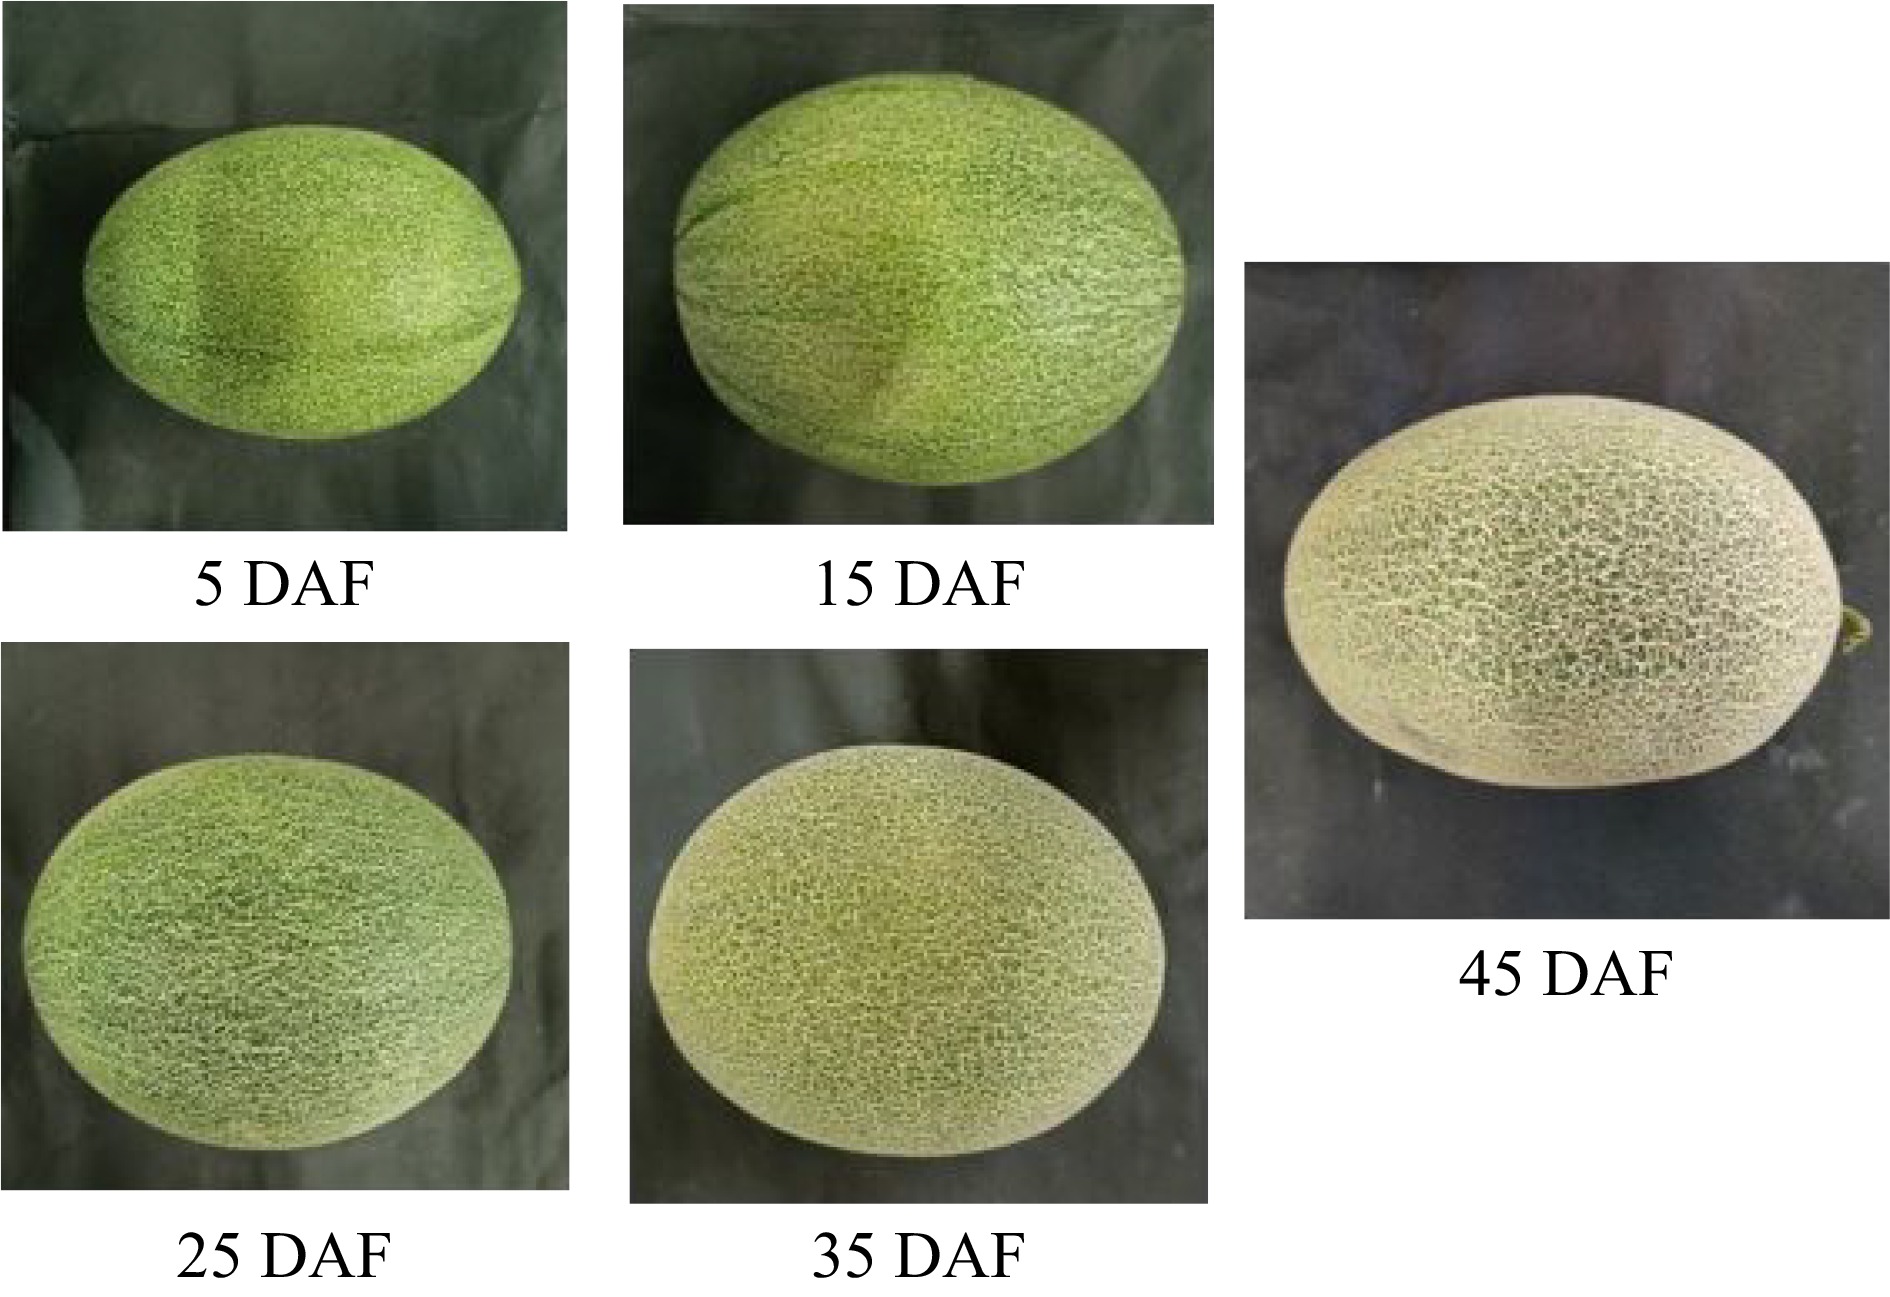
Figure 1.
Appearance changes of melon at different days post anthesis.
-
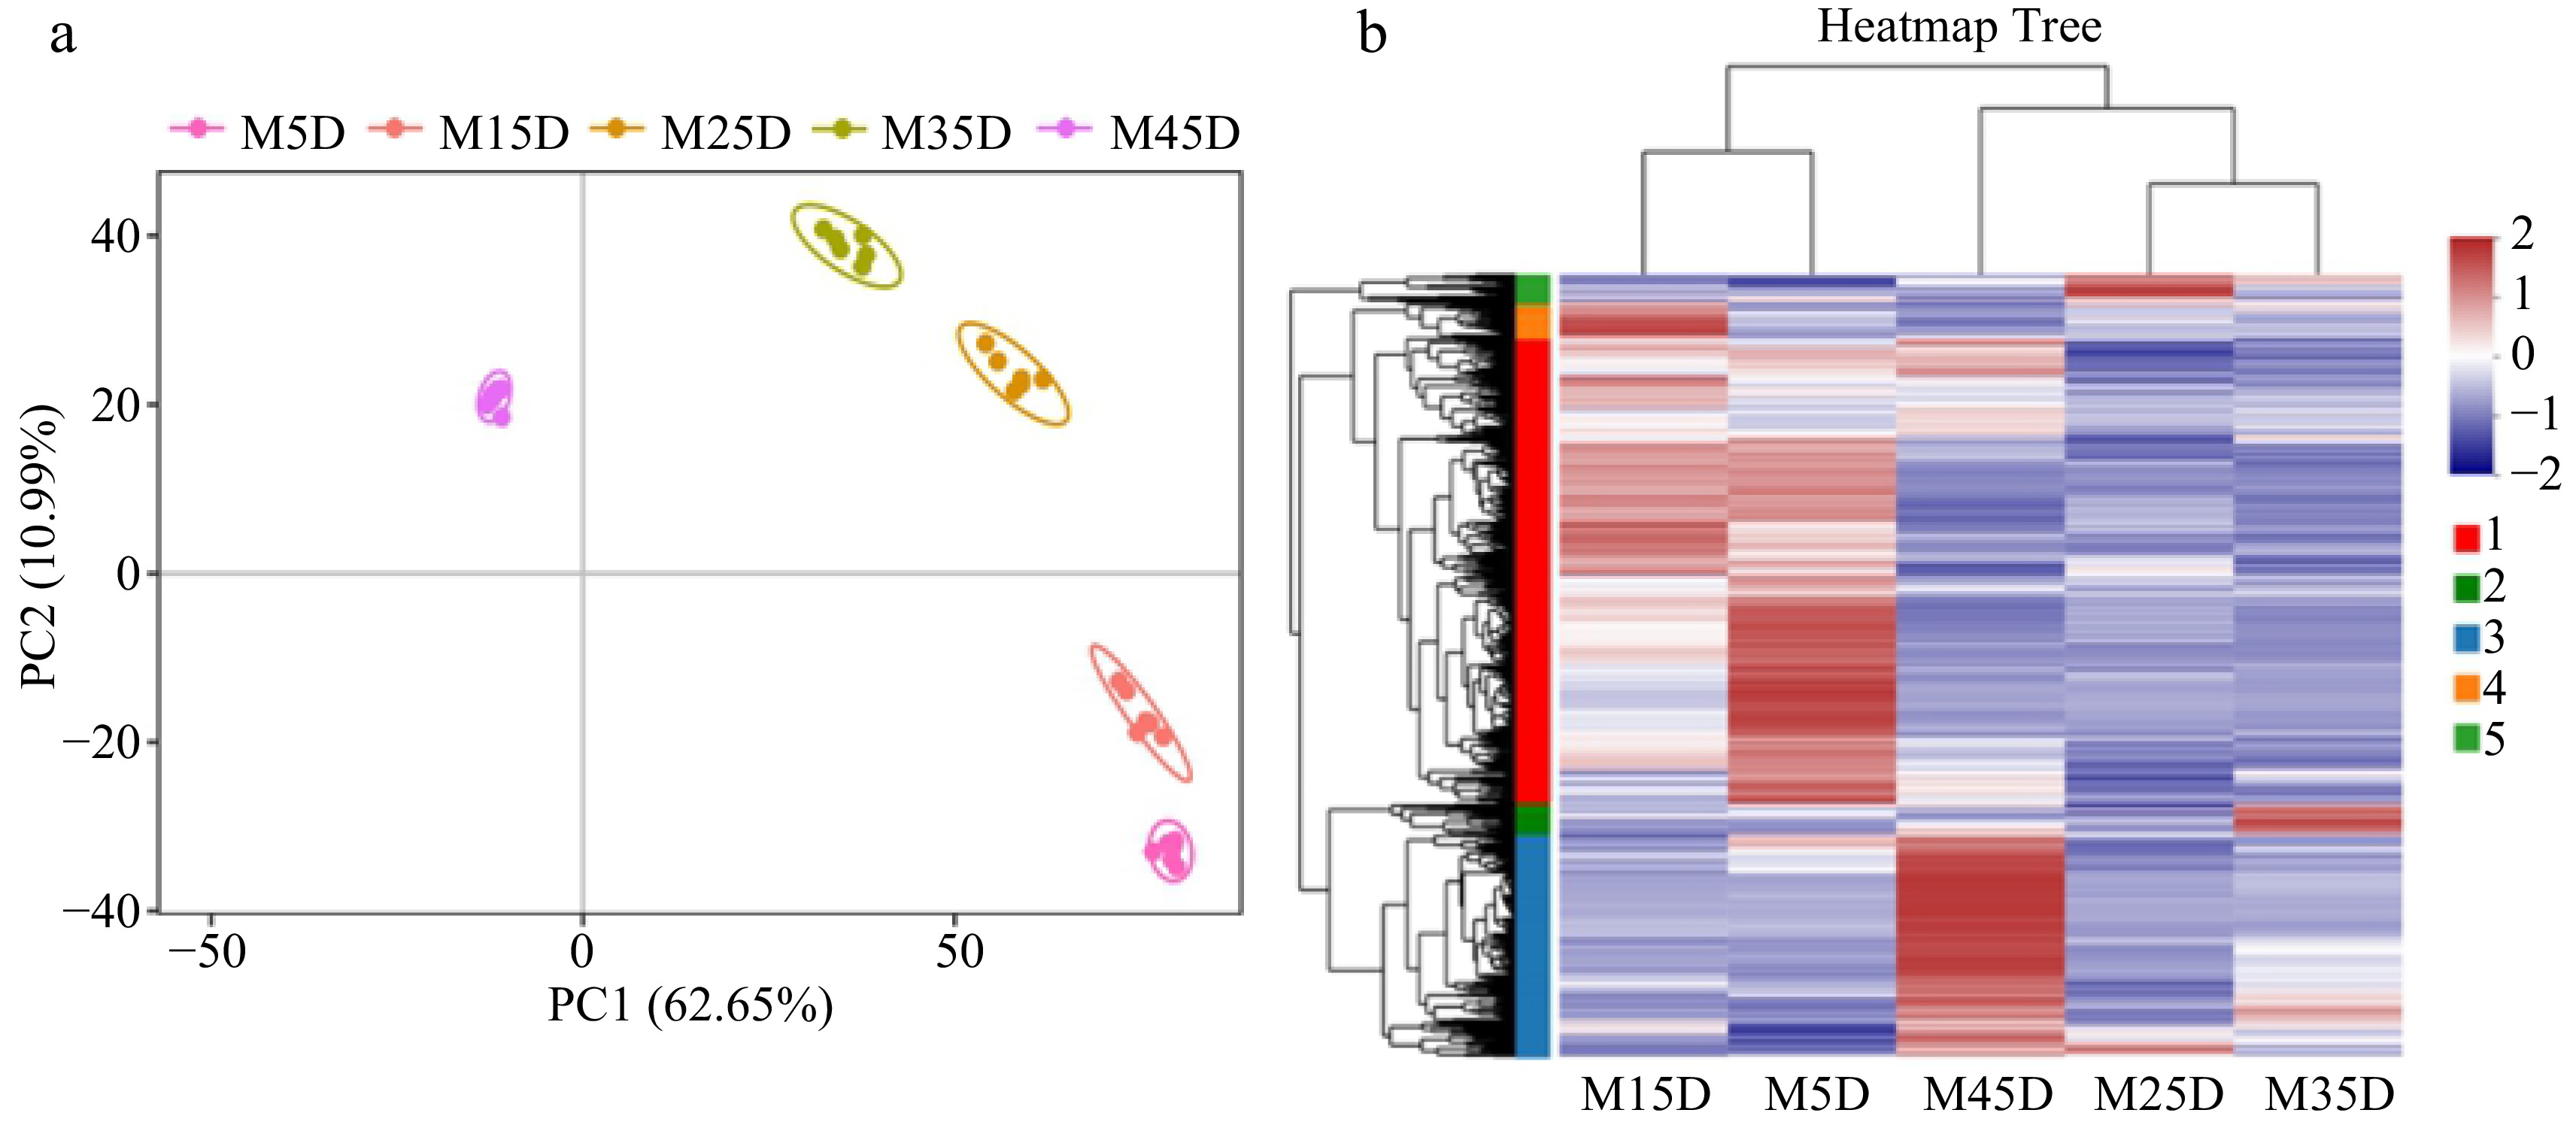
Figure 2.
Metabolome analysis of five developmental stages in melon fruit. (a) PCA of metabolome data. (b) Heat map of metabolites from five developmental stages.
-
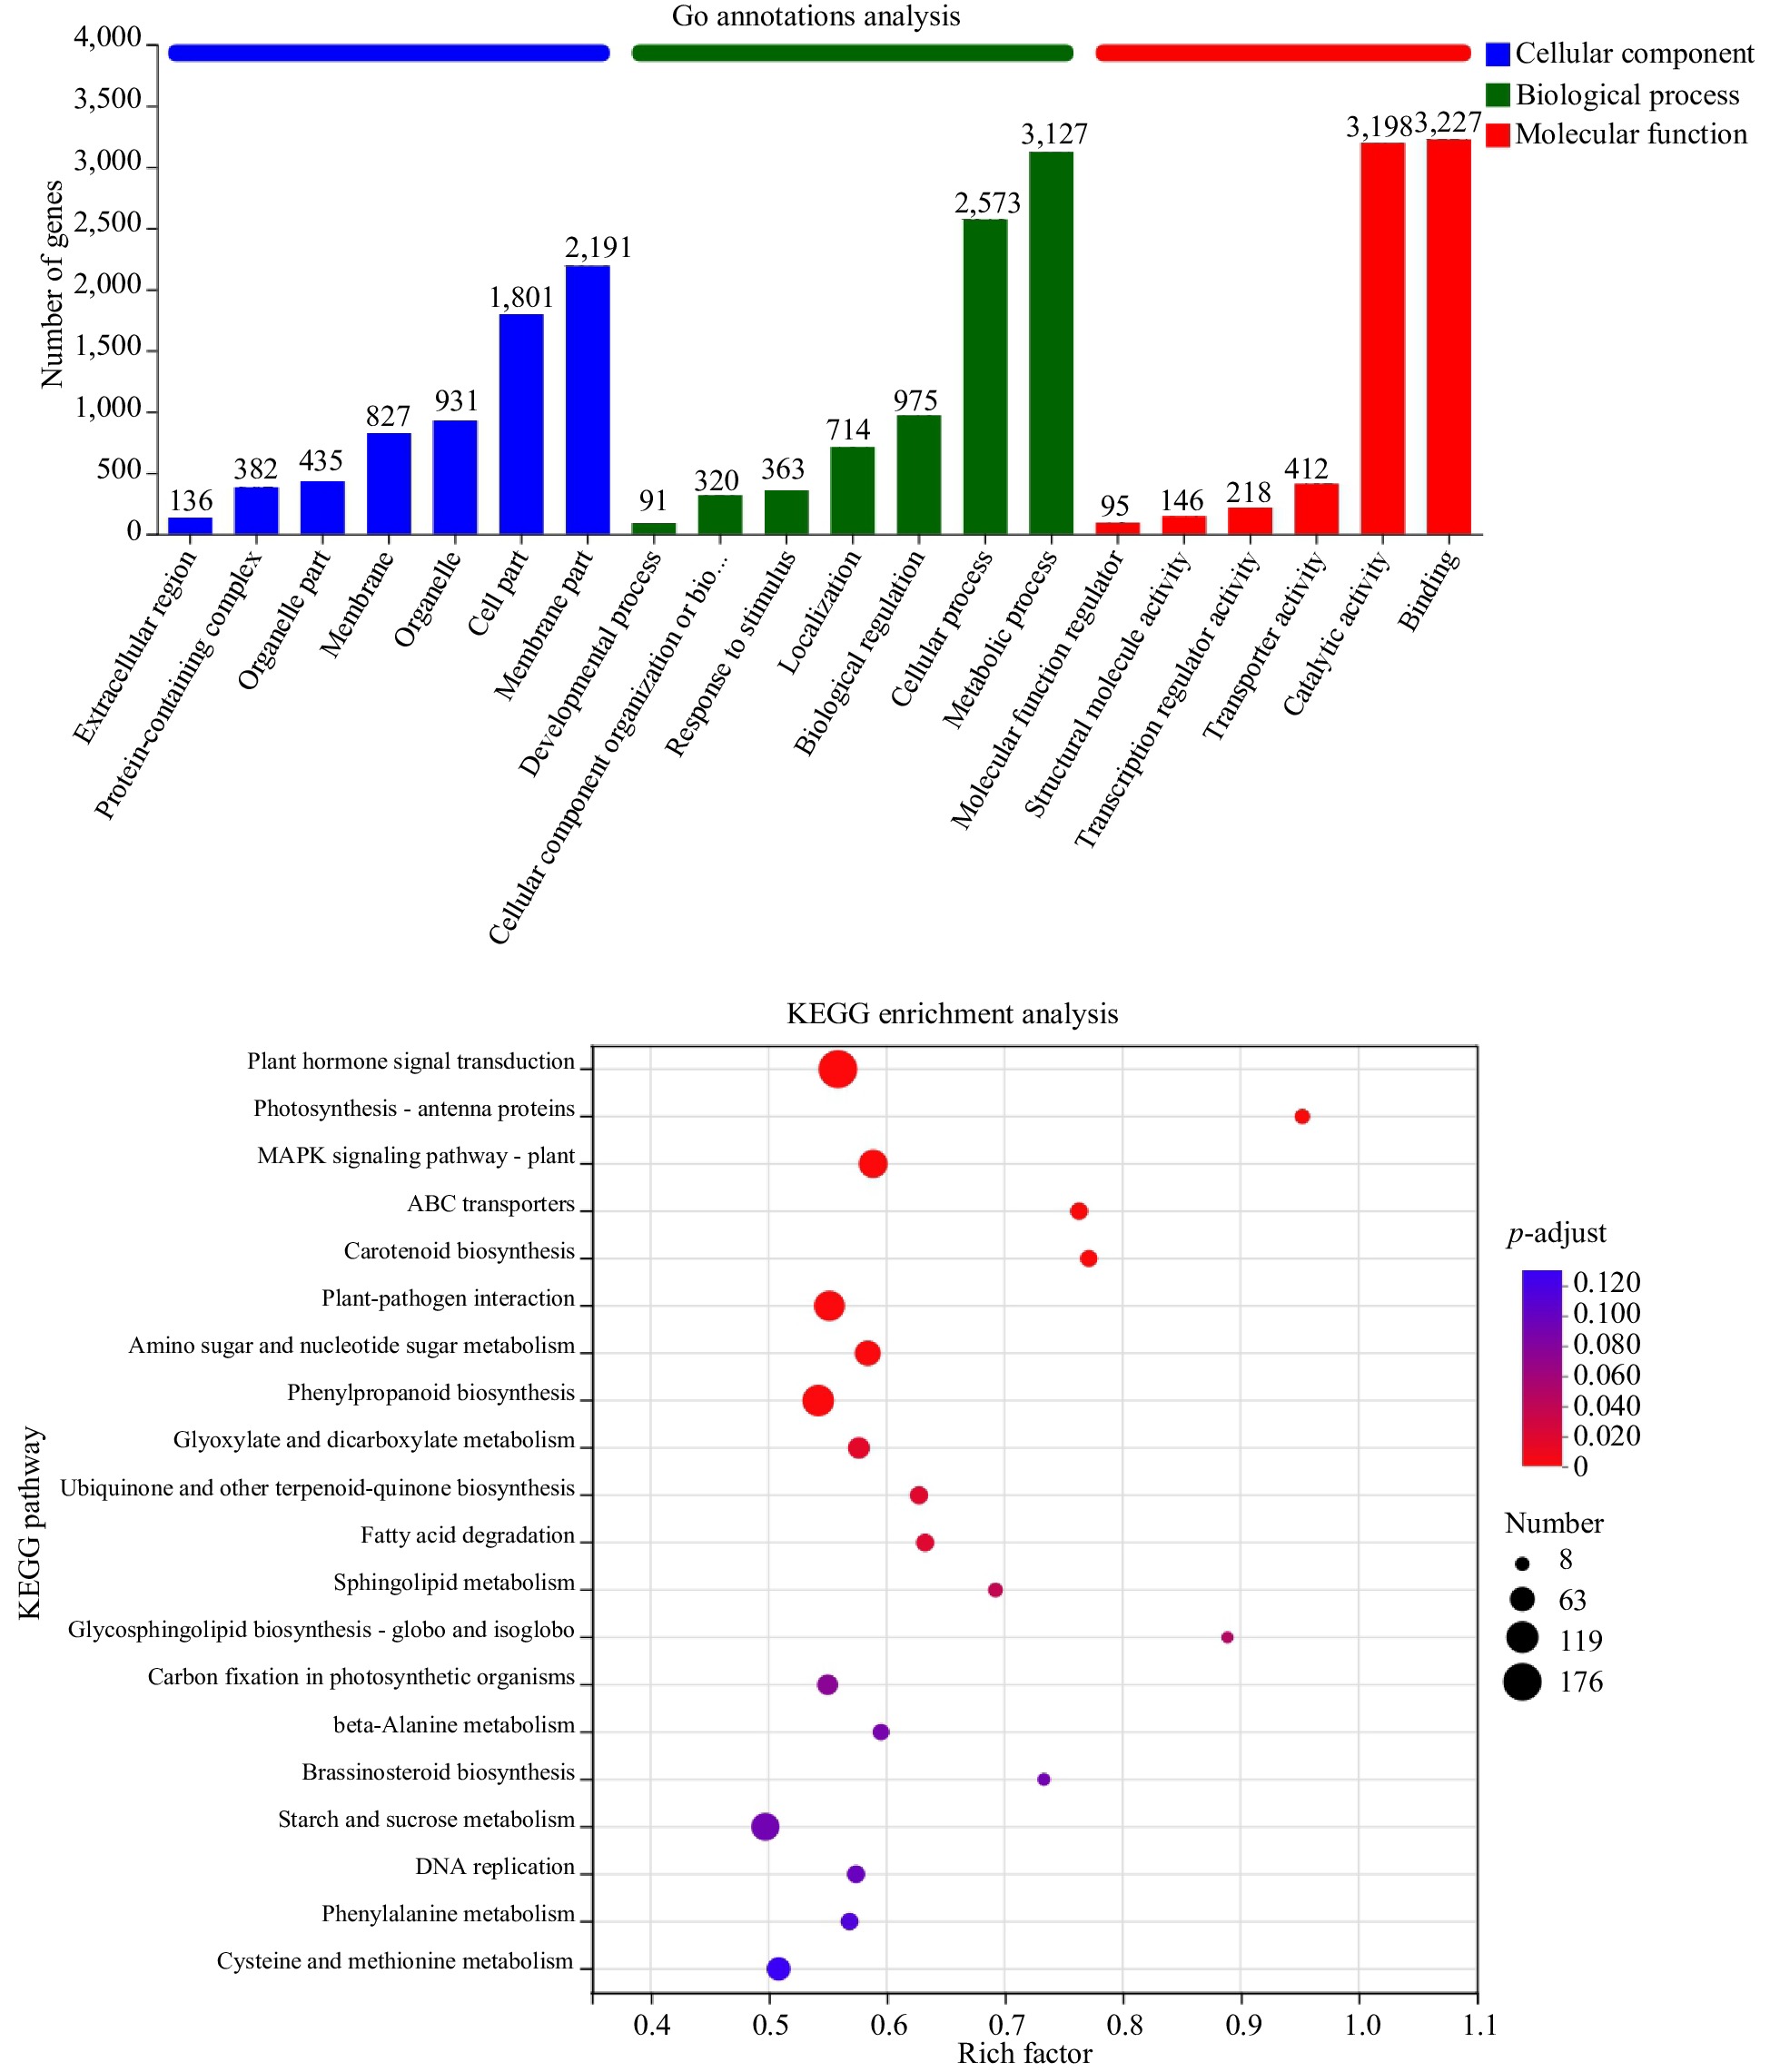
Figure 3.
GO annotation classification and KEGG enrichment analysis of differential genes.
-

Figure 4.
Transcriptome analysis and k-means cluster analysis of metabolites and genes.
-
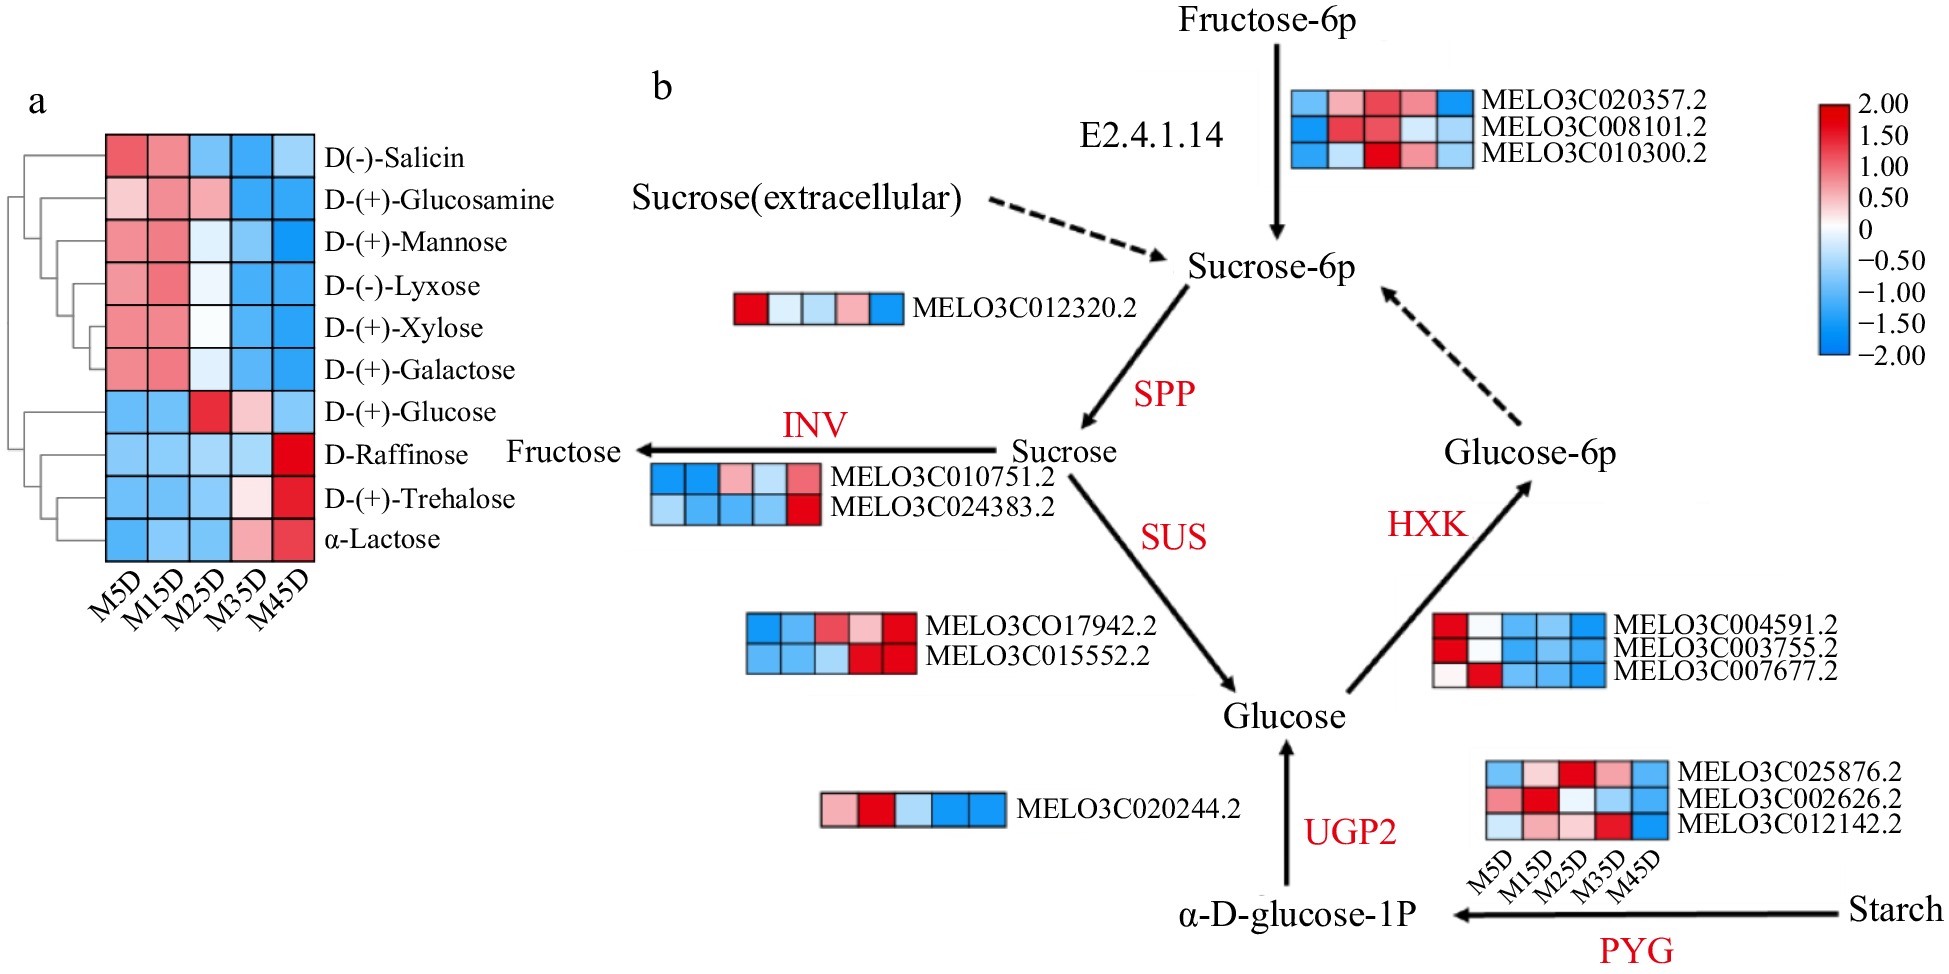
Figure 5.
The expression pattern of genes involved in soluble sugar accumulation in melon at five developmental stages. The development progression of gene expression from M5D to M45D is indicated in five box strings. SPP, sucrose-phosphatase; SUS, sucrose synthase; INV, invertase; HXK, hexokinase; PYG, glycogen phosphorylase; UGP2, UTP-glucose-1-phosphate uridylyltransferase; E2.4.1.14: SPS, Sucrose-phosphate synthase.
-
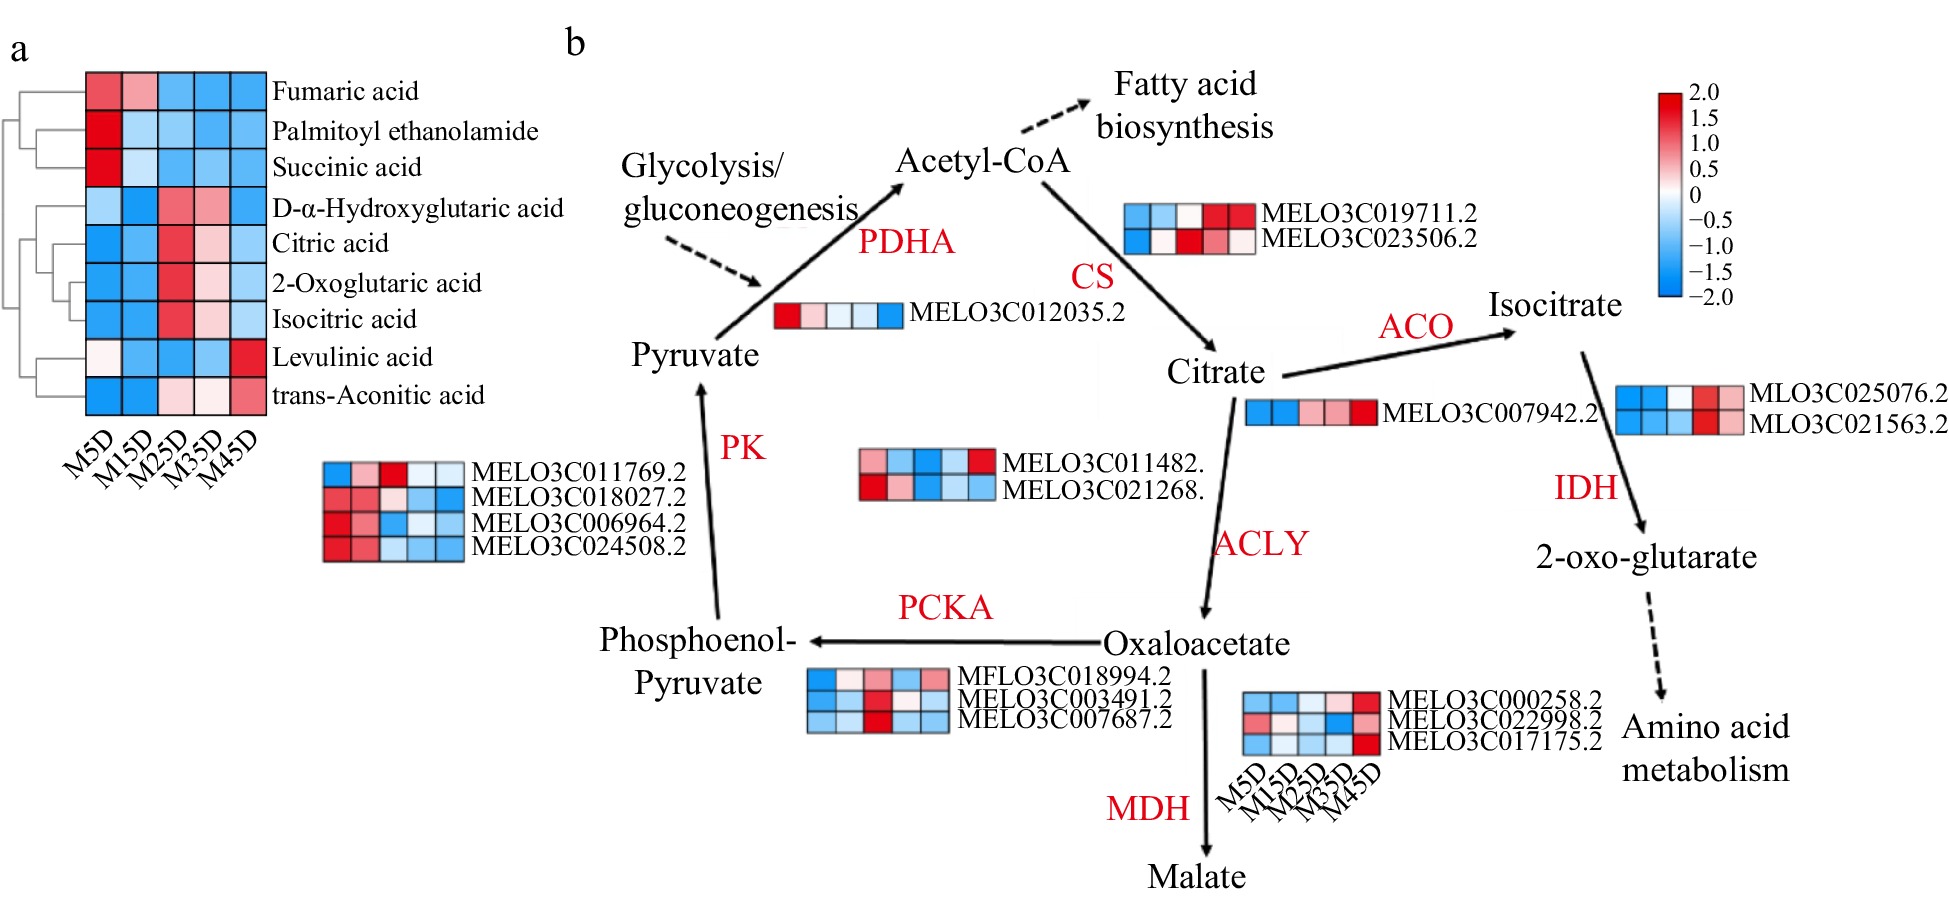
Figure 6.
Expression pattern of organic acid metabolic genes and identification in melon at five developmental stages. The development progression of gene expression from M5D to M45D is indicated in five box strings. PK, Pyruvate kinase; PDHA, pyruvate dehydrogenase; CS, Citrate synthase; ACO, aconitate hydratase; IDH, isocitrate dehydrogenase; ACLY, ATP citrate (pro-S)-lyase; PCKA, Phosphoenolpyruvate carboxykinase; MDH, Malate dehydrogenase.
-
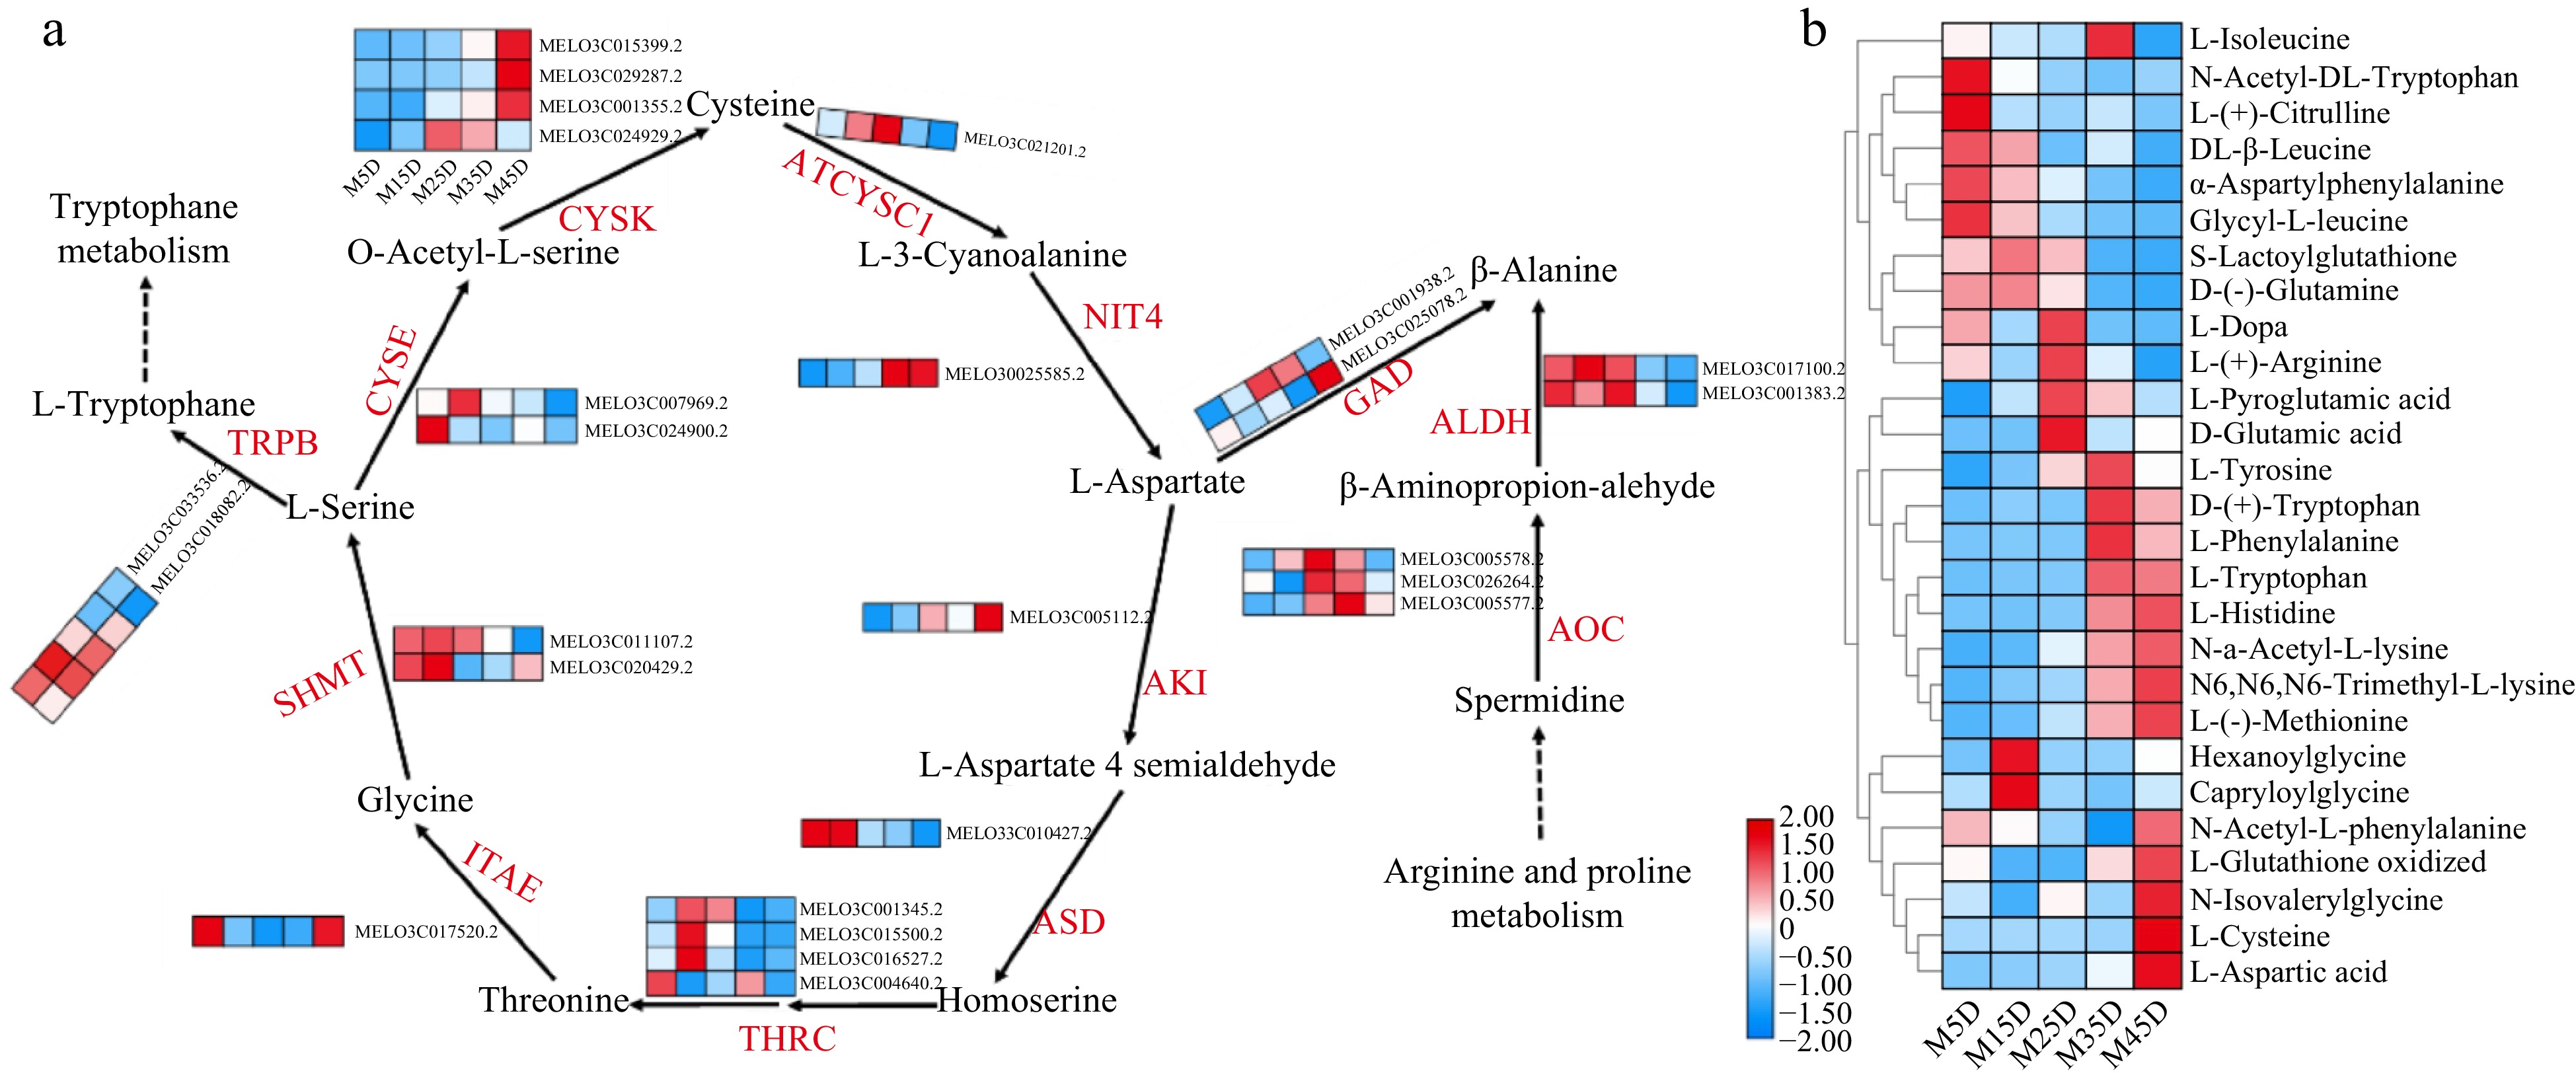
Figure 7.
Expression pattern of amino acid metabolic genes and identification in melon at five developmental stages. The development progression of gene expression from M5D to M45D is indicated in five box strings. ITAE, L-allo-threonine aldolase; THRC, threonine synthase; TRPB, tryptophan synthase; SHMT, serine hydroxymethyltransferase; CYSE, serine acetyltransferase; CYSK, cysteine synthase; ATCYSC1, L-3-cyanoalanine synthase; NIT4, bifunctional nitrilase/nitrile hydratase; AOC, Amine oxidase; ALDH, aldehyde dehydrogenase (NAD+); GAD, glutamate decarboxylase; AKI, aspartokinase; ASD, aspartate-semialdehyde dehydrogenase.
-
Days after flowering (day) Weight
(g)Longitudinal (cm)/transverse diameter (cm) Hardness (kg/m3) Soluble solid (%) 5 144 ± 11.97d / 5.01 ± 1.58c 6.35 ± 0.52e 15 837.42 ± 81.43c 0.72 ± 0.04c 6.13 ± 0.17a 8.14 ± 0.2c 25 1523.24 ± 97.22b 0.75 ± 0.02b 5.58 ± 1.42b 6.79 ± 0.59d 35 2045.58 ± 153.45a 0.76 ± 0.05b 4.98 ± 0.38c 10.84 ± 0.43b 45 2170.08 ± 142.17a 1.07 ± 0.05a 4.41 ± 0.001d 15.16 ± 0.51a Values in the same line with different letters indicate statistically significant differences at p < 0.05. Table 1.
Fruit phenotypes of muskmelon at different developmental stages.
-
Group M5D:M15D M15D:M25D M25D:M35D M35D:M45D Total Up 59 79 89 91 268 Down 103 95 91 89 All 162 174 180 180 Table 2.
Statistics of differentially regulated metabolites 271.
-
Compared samples Total no. of DEGs with significant difference Total no. of DEGs significantly up-regulated Total no. of DEGs significantly down-regulated M5D_vs_M15D 2926 924 2002 M15D_vs_M25D 3691 1308 2383 M25D_vs_M35D 3400 1662 1738 M35D_vs_M45D 2882 896 1986 Table 3.
Statistical table of different genes in different groups.
Figures
(7)
Tables
(3)